
How to measure retail conversion rate using store entries
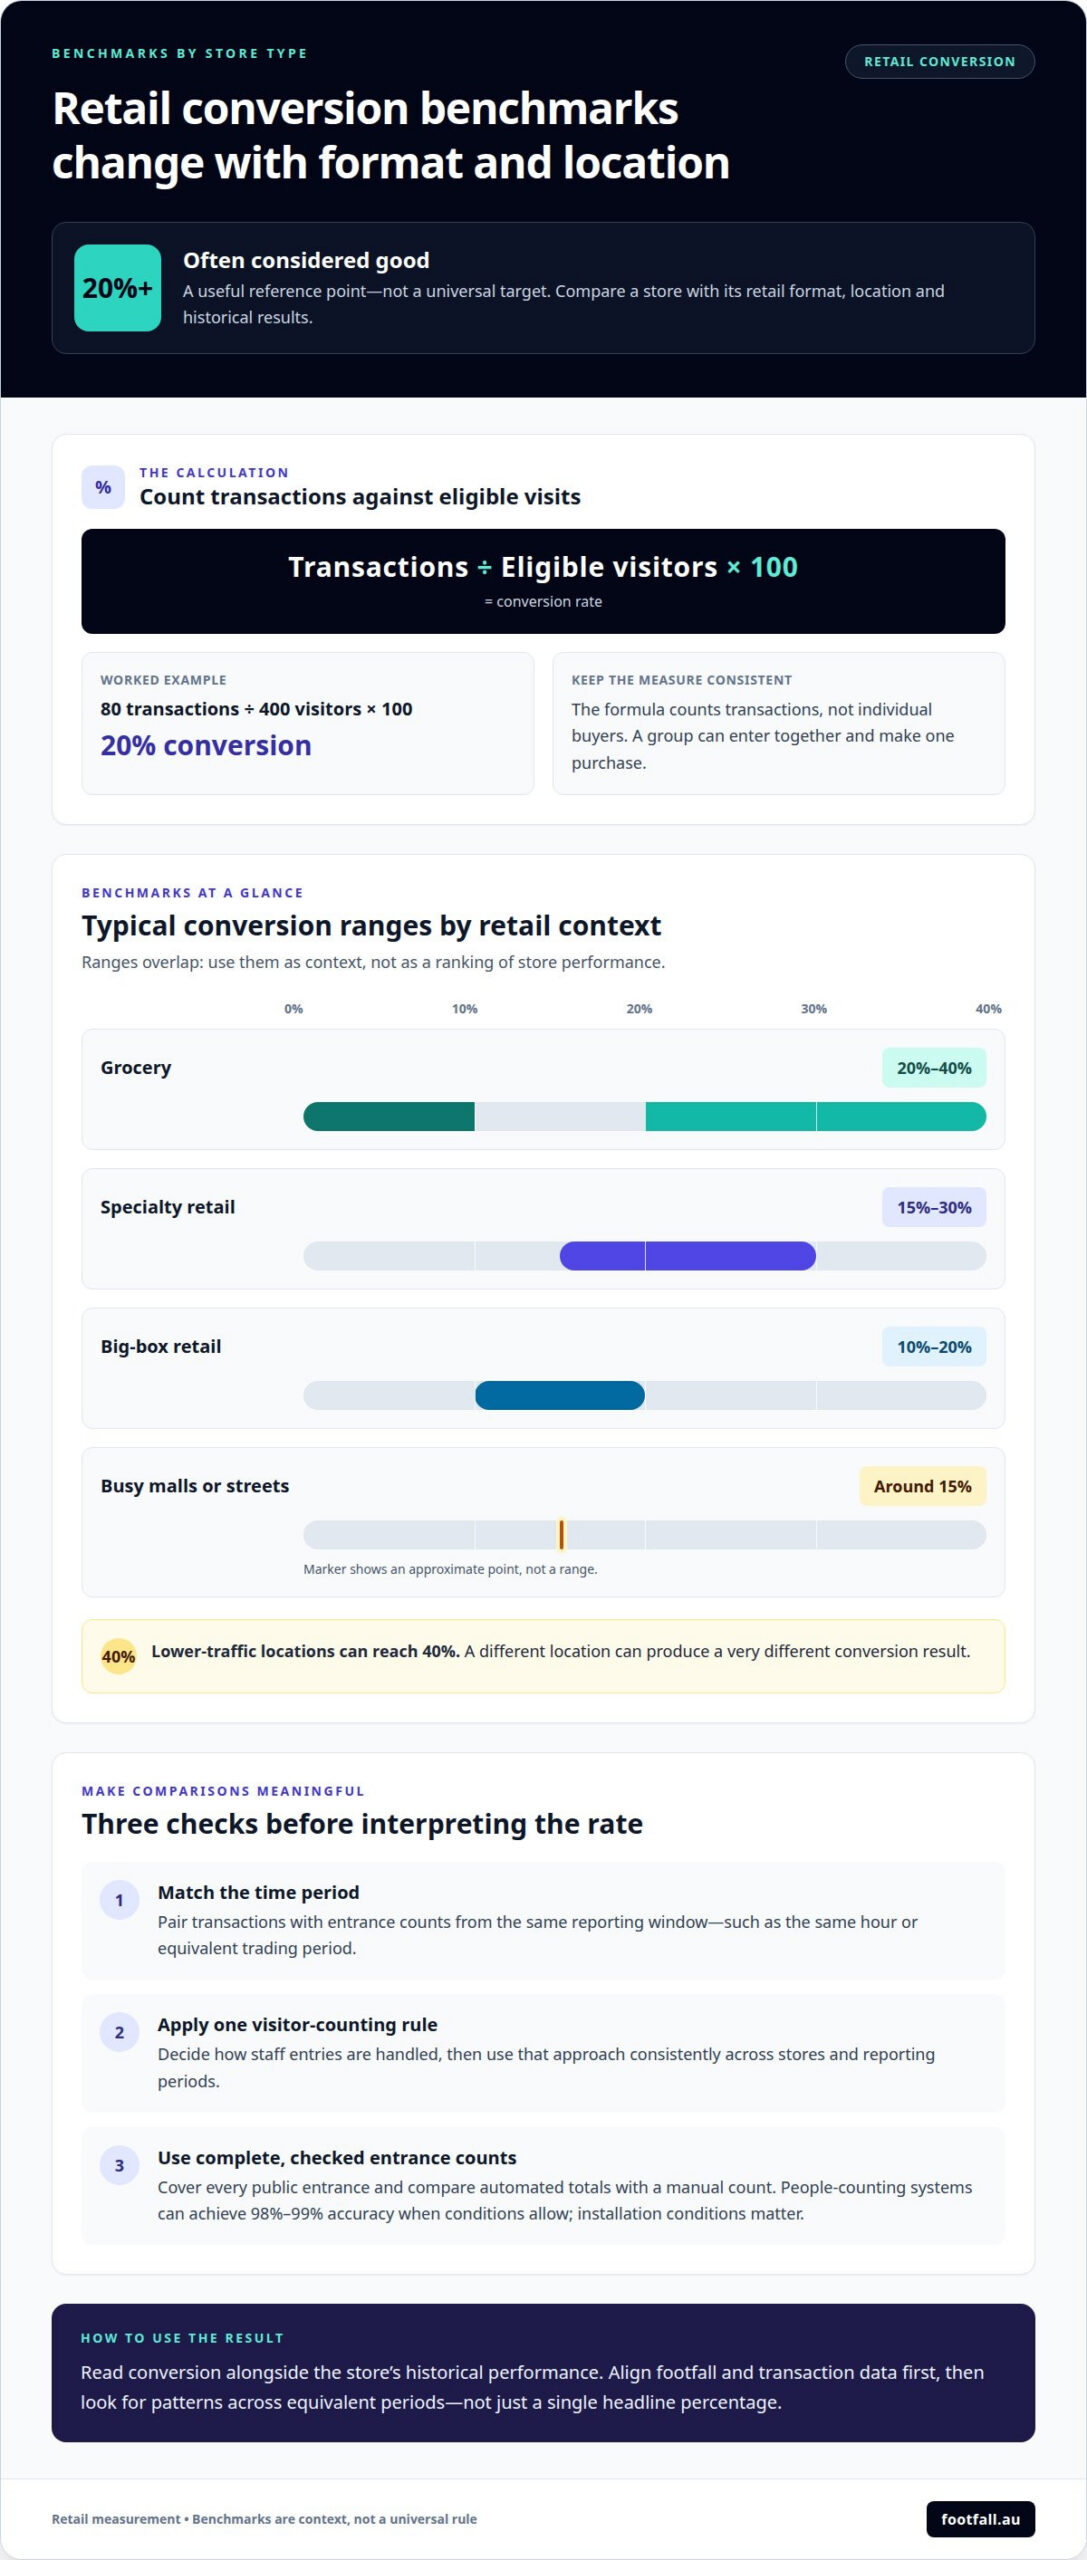
A retail conversion rate of around 20% or more is often considered good, but there’s no universal benchmark for every store. Calculate it by dividing transactions by eligible visitors and multiplying by 100. Measuring store conversion rate with people counters gives you the entry count for that calculation, while transaction data shows how many visits resulted in sales.
That figure is useful only when both counts cover the same period and apply a consistent definition of an eligible visit. Staff entries can also affect visitor totals, so decide how to treat them before comparing performance.
This guide explains how to interpret a retail conversion rate, whether to exclude staff, and how people counters measure store entries. It also shows how aligning entry and transaction data turns a headline percentage into a more reliable picture of store performance.
Key Takeaways
- Judge a store’s conversion performance against its retail format, location and historical results rather than relying on one universal benchmark.
- Decide how staff movements are handled consistently so traffic and conversion comparisons remain meaningful.
- Use entry counters to build a dependable view of foot traffic, then align those counts with transaction data to spot useful trends.
- Explore people-counting technology when you need clearer evidence to guide store operations and performance decisions.
What is a good retail conversion rate?
Calculate retail conversion by dividing transactions by eligible store visitors, then multiplying by 100. To calculate it from people-counter data, match entrance counts with transaction totals from the same time period, such as the same hour.
Define the Conversion Rate Formula
1. Use this formula: transactions ÷ visitors × 100 = conversion rate. The retail conversion-rate formula measures how effectively store visits become purchases; it counts transactions, not individual buyers. A group may enter together and make one purchase, so keep the measure consistent when comparing stores or periods.
Around 20% or more is described as good, but retail formats differ. Busy malls or streets may sit around 15%, while lower-traffic locations can reach 40%. Specialty retail benchmarks range from 15% to 30%, big-box retail from 10% to 20%, and grocery from 20% to 40%.
Calculate Store Conversion from Counter Data
2. Pair the entrance visitor count with transactions recorded for the identical time bucket. For example, 80 transactions divided by 400 eligible visitors, multiplied by 100, equals a 20% store conversion rate. Use matching periods, such as 15, 30 or 60 minutes, so the retail conversion formula compares like with like.
For physical stores, use people-counter data for visitor totals and point-of-sale records for transactions. Apply consistent counting rules, then compare equivalent trading periods. Because conversion varies with store format and location, use the rate alongside the store’s historical performance rather than treating a single benchmark as universal.
Should staff be excluded from visitor counts?
In Australia, privacy considerations depend on whether a system collects identifiable personal information. Entry totals that do not identify individuals differ from data used to track or identify them; design the measurement around aggregated traffic counts.
Match point-of-sale transactions with people-counter totals by aligning timestamps and reporting periods. For example, compare transactions with entrance counts from the same hour, rather than pairing daily sales with hourly foot traffic.
- Set a consistent staff-counting rule. Decide whether staff entries are excluded, then apply the same approach across stores and reporting periods. For a store with eight employees and 400 visitors, forty staff passes add 10% to the visitor count for that day. Staff movement can therefore change the calculated retail conversion percentage.
- Compare hourly patterns before changing staffing. A store may convert at 31% at 10 am, 14% between noon and 2 pm, and 27% in the late afternoon. Use those differences to align staffing with peak traffic, rather than relying only on a daily conversion figure.
- Respond to traffic and queue signals. If traffic surges from 11 am to 1 pm while conversion falls below the store’s hourly baseline, review service coverage and queue length. Long queues can make shoppers more likely to abandon a purchase; check stock availability alongside staffing when investigating friction.
- Turn patterns into measured changes. Use people-counter data to identify when shopping visits rise, adjust staff coverage around those periods, then compare conversion across equivalent time windows. People-counting data can help retailers make these operational decisions using observed entrance traffic.
Using people counters to measure store entries
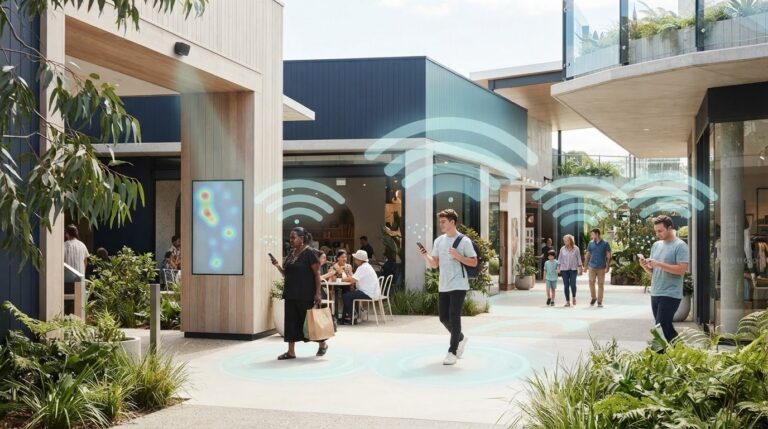
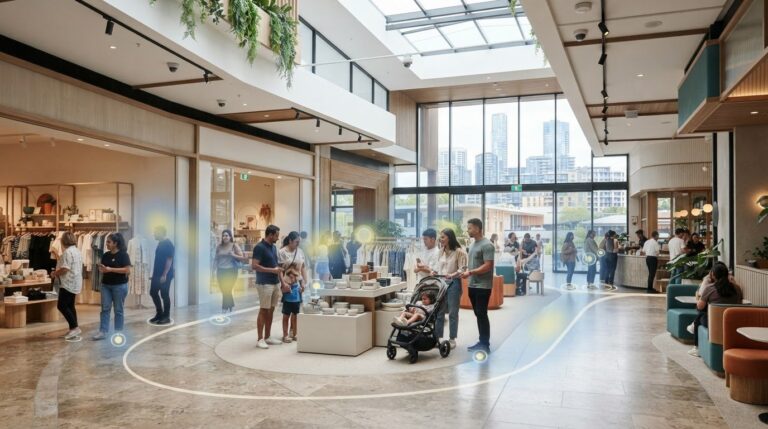
1. Map each entrance and its layout before installing a counter. Ceiling-mounted 3D stereovision sensors can count movement through each entrance zone, while infrared counters also measure footfall at store entrances. Cover every public entry used during the reporting period.
- Set the counting area. Position the sensor to capture people crossing the entrance, not movement nearby. A short manual count helps confirm that the chosen area matches actual entries. Check how doors, displays or the physical layout affect visibility and movement.
- Validate the count. People-counting systems typically achieve 98 to 99% accuracy when conditions allow, but installation conditions matter. Compare automated totals with a manual count, then review whether accuracy remains stable. A consistent daily count supports more useful retail conversion rate trends.
- Align traffic and transactions. Export entrance totals and transaction data for matching periods, then compare hourly, daily or weekly results. This lets retail analytics show when footfall changes alongside purchases. Keep the period consistent across stores so differences inform decisions rather than reflect mismatched reporting.
- Turn patterns into action. Review traffic alongside revenue, staffing and store operations. If entry counts rise while sales remain flat, investigate the customer journey and service coverage before changing a plan. Use repeated tracking to distinguish a lasting pattern from a single busy day.
For a practical approach to measuring store conversion rate with people counters, explore people-counting solutions that support entrance measurement and retail analytics.
Footfall Australia: FootfallCam Pro2 People Counters
Footfall Australia offers FootfallCam Pro2 People Counters for retailers who need a clearer measure of store entries. Use people-counting data alongside transaction totals to calculate conversion and examine how traffic changes across trading periods.
People counters are useful when manual counts take staff time or when consistent footfall data can inform store decisions. Counter totals provide the visitor figure; transaction data completes the conversion calculation. Aligning both datasets makes comparisons more meaningful.
For a people-counting solution that supports store-entry measurement, contact Footfall Australia to discuss your requirements.
Make store measurement part of better decisions
Make each reporting cycle a prompt for action. Instead of treating conversion as a score, use it to investigate how the store experience supports or interrupts buying intent. Consistent measurement helps teams distinguish operational changes from normal variation and focus on tests with clear outcomes.
Measuring store conversion rate with people counters gives retail teams a consistent view of movement through physical stores. First identify the questions that matter, then use the data to guide focused operational changes. Record what changed and what the results show, so each review informs the next decision.
With a clear measurement approach, store teams can move from observation to practical action. Contact Footfall Australia to discuss people counting for your stores.
Frequently Asked Questions
Can I export the data?
Export options depend on the analytics platform and the reporting tools available to your organisation. When exporting data, use a consistent view of store entries and transactions, with the same date range and store filters for each review. This makes it easier to share results with retail teams and compare like with like.
Can conversion improve without increasing foot traffic?
Yes. A store can convert more visits into purchases without attracting more visitors. Look for points of friction, such as unclear product information, limited staff availability or a difficult route to checkout. Test one focused operational change and compare results across similar trading periods. Track average transaction value separately from conversion to see which measure changed.
How accurate are people-counting sensors?
People-counting systems typically achieve 98 to 99% accuracy when conditions allow. Actual performance depends on factors such as the entrance setup and how clearly the counting area captures movement. A short manual count can help assess the setup. Consistent results matter for trend analysis, because changing accuracy can make traffic shifts harder to interpret.
How do I start?
Start with one store and define the entrances and reporting periods to assess. Use a four-week measurement period as a baseline, then combine entry and transaction records for matching periods. Record relevant changes, such as promotions or altered trading hours, alongside the results. This context helps distinguish operational effects from normal variation.
How often should stores review conversion?
Review conversion at an interval suited to the decision: hourly for staffing patterns, daily for trading checks, and weekly or monthly for broader trends. Avoid strategic changes based on one unusual day. Compare several weeks of results, and use the same period last year when seasonal trading may affect visitor behaviour.