Understand Retail Foot Traffic and Its Role in Store Performance
Longer opening hours do not always mean better store performance. Evaluating retail store performance with footfall data helps retailers understand when people enter, how visits change across the week and whether busy periods lead to sales. Footfall counts visits; conversion measures the share of visitors who make a purchase.
Foot traffic is useful when reviewing store hours, but visitor numbers are only one part of the decision. This article explains what retail footfall measures, how it differs from conversion and how to interpret both alongside sales and staffing needs. It also shows how hourly and daily patterns can inform opening-hour decisions, so schedules reflect customer activity rather than intuition alone.
Key Takeaways
- Separate visitor counts from purchases to understand whether a store needs more traffic or a stronger in-store sales experience.
- Read conversion and dwell time together: longer visits can reflect engagement, congestion or difficulty finding products.
- Compare traffic by hour and day with sales and staffing patterns to make opening-hour decisions more evidence-based.
- Use consistent footfall trends to spot changes in store performance, assess campaigns and identify where operations may need attention.
What Is Foot Traffic in Retail?
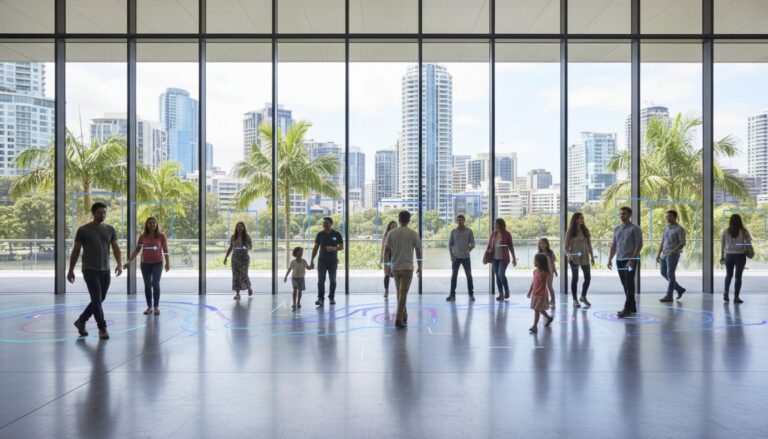
Retail foot traffic, also called walk-in traffic, counts people entering a store during a defined period, such as a day, week or month. It measures physical visits, not purchases or revenue. In Australia, retail turnover rose 1.2% month-on-month in June 2025, seasonally adjusted, according to the Australian Bureau of Statistics. Turnover and footfall describe different parts of retail activity.
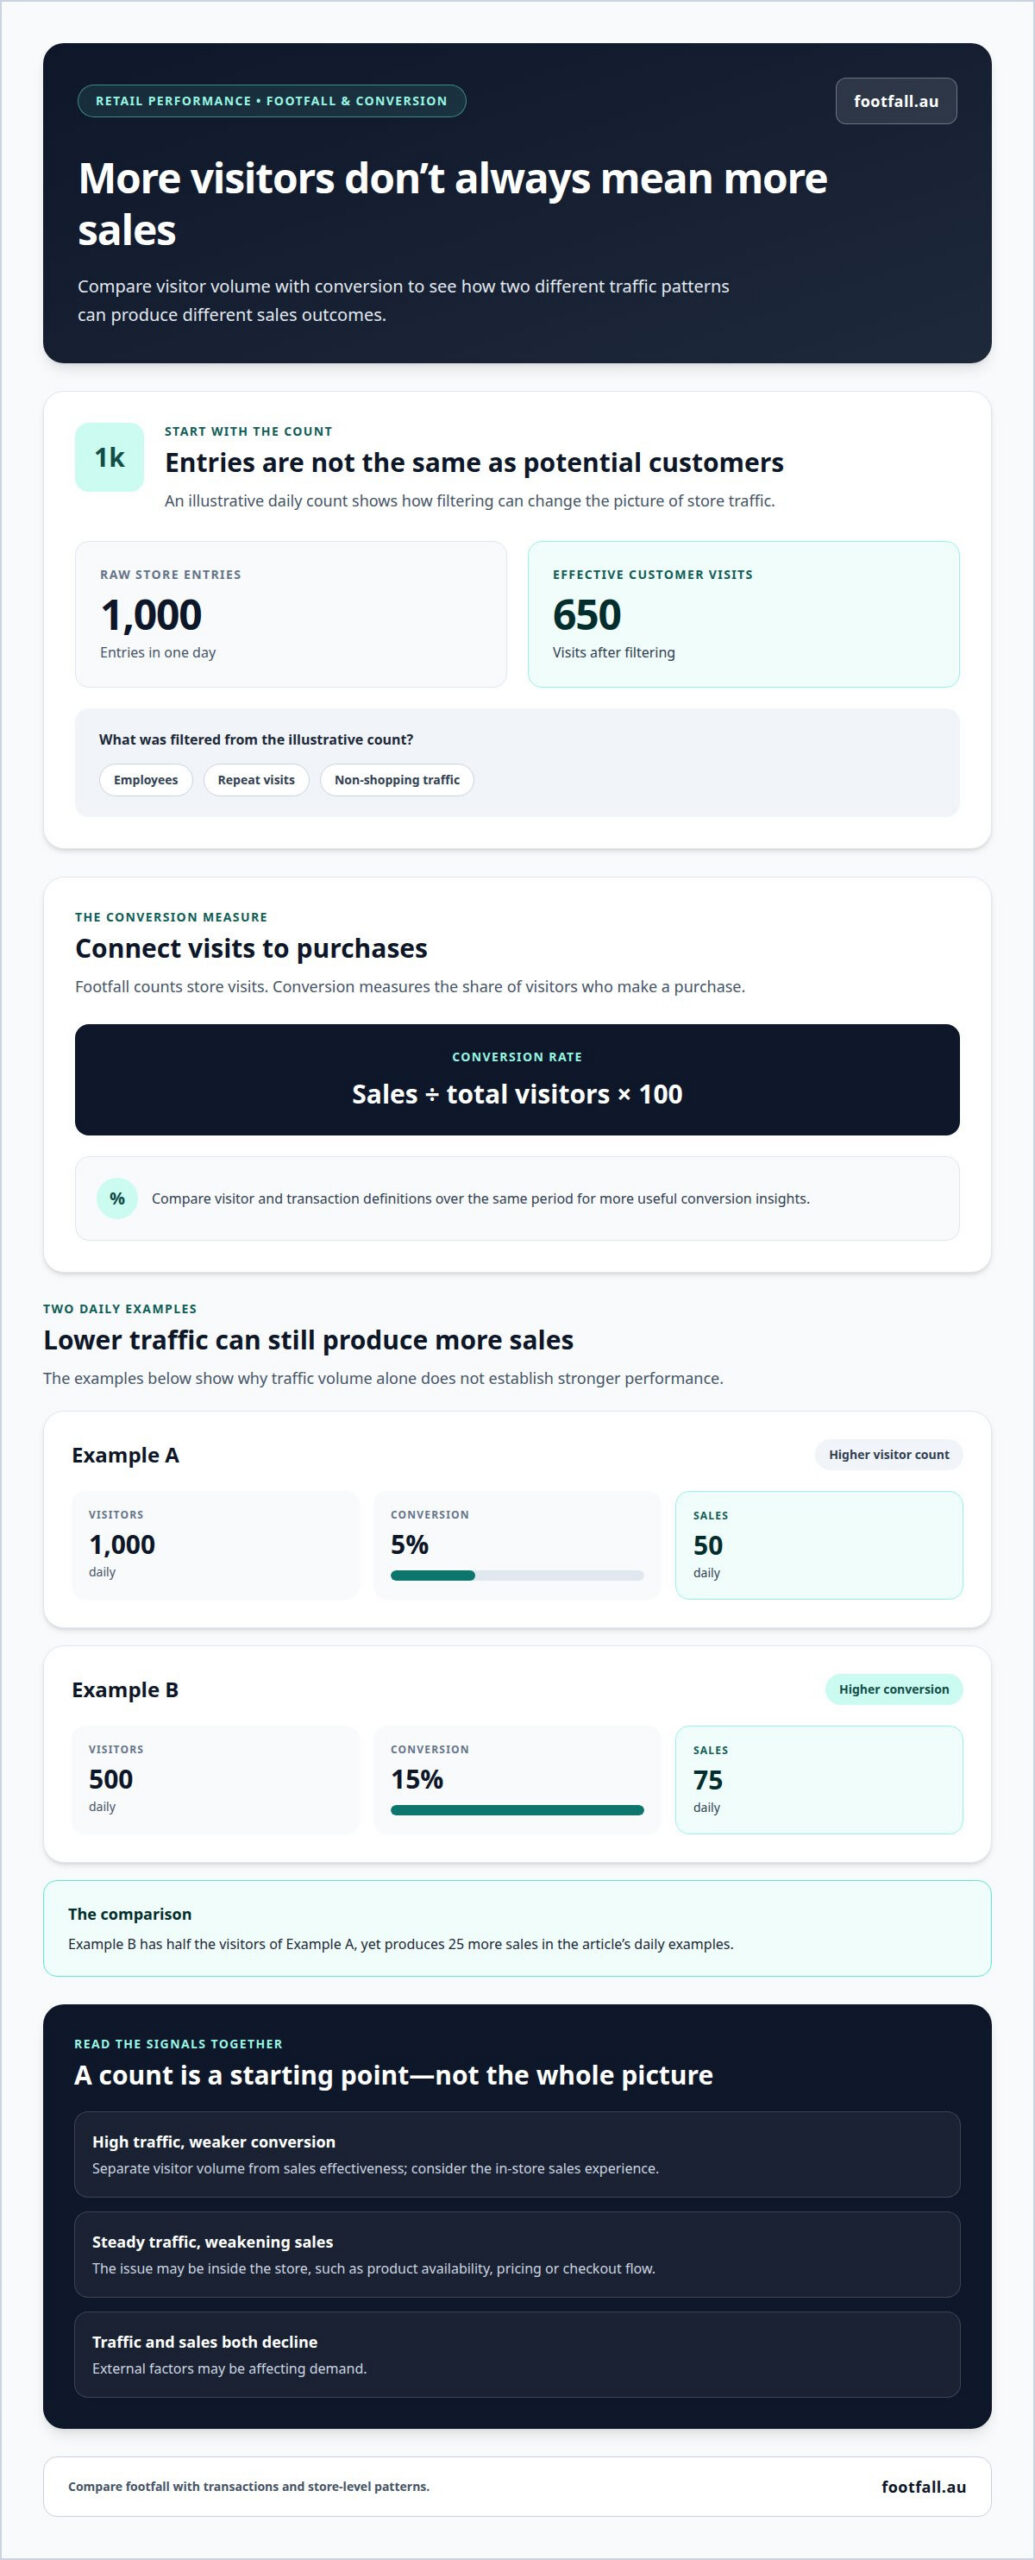
A counter may record every entry, including employees, repeat visits and people who do not shop. An illustrative example starts with 1,000 store entries per day. After filtering staff, repeated visitors and non-shopping traffic, the total becomes 650 effective customer visits daily. This distinction matters when comparing traffic with sales: raw entries can overstate the number of potential customers.
Use footfall patterns to match staffing and operations to demand. Compare visitor counts by hour and day, then align employee shifts with recurring peaks. If Saturday afternoons attract more visitors than weekday mornings, managers can schedule more customer-service coverage during that busy period. The same pattern can guide cleaning and security schedules, helping teams focus resources when store activity is highest.
Comparing traffic patterns can also inform opening hours. Consistently low traffic near closing may prompt a review of those hours, while steady evening visits may support keeping the store open. Footfall alone cannot show whether visits generate sales, so compare traffic with transactions and operating needs before changing schedules. Quieter periods may also offer opportunities to adjust staffing or inventory. This makes evaluating retail store performance with footfall data an operational decision, not simply a count of visitors.
How is footfall different from sales conversion?
Footfall counts store visits, while conversion measures how many visitors make a purchase. Dwell time and movement patterns add context about the customer experience.
Connecting Visitor Counts to Sales
A store’s conversion rate is sales divided by total visitors, multiplied by 100. This links physical traffic to sales activity and helps separate visitor volume from sales effectiveness.
For example, 1,000 daily visitors at a 5% conversion rate produce 50 sales. A store with 500 daily visitors and a 15% conversion rate produces 75 sales. Comparing both measures shows why high traffic alone doesn’t establish stronger performance. Use compatible visitor and transaction definitions, then compare results across the same period. This makes conversion insights more accurate and useful for operational decisions.
Assessing Visit Quality and Commercial Value
Visit quality considers who visits, how they move through a store and whether they return. Dwell time measures the average time visitors spend inside, but longer stays may indicate engagement, congestion or difficulty finding products. Interpret it alongside customer flow and sales.
Visitor demographics can inform product assortments and displays, while repeat-visit patterns can help distinguish loyal customers from new visitors. Location-level analysis can also show catchment areas, customer capture and potential cannibalisation between stores. These insights help assess commercial value beyond entry totals.
Compare footfall and zone engagement before, during and after marketing campaigns. A traffic increase without stronger conversion may point to a mismatch between the campaign audience and the in-store offer. For a fuller view of visitor movement, people-counting analytics can complement entrance counts.
Footfall as a retail performance indicator
Footfall analytics turns entry counts into a view of store performance over time. A basic counter recording 500 entries in one day provides a starting point, but the count becomes more useful when compared with earlier days, sales and store-level metrics. Track patterns by hour, day and week to distinguish an isolated rush from a sustained change in customer activity.
Interpret footfall trends alongside conversion and turnover. If visitor numbers remain steady while sales weaken, the issue may be inside the store, such as product availability, pricing or checkout flow. If both traffic and sales decline, external factors may be affecting demand. Comparing passing traffic with store entries can also reveal whether fewer people are walking past or fewer passers-by are coming inside.
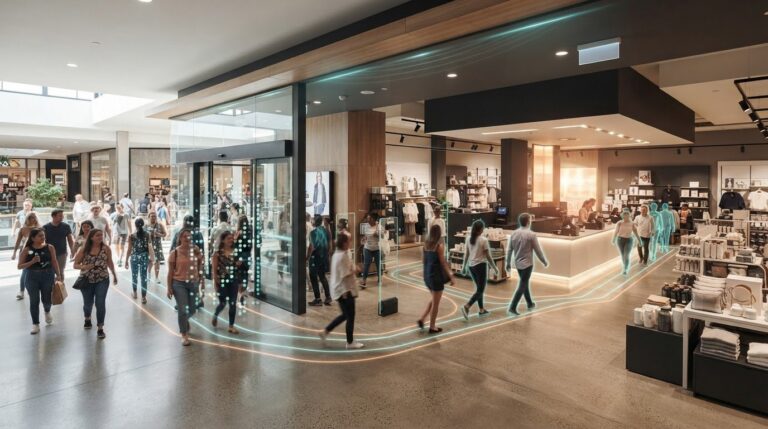
Movement data adds another layer of insight. Video analytics can reveal bottlenecks, neglected zones and routes that draw visitors towards particular displays. If customers consistently bypass an area, retailers can assess its signage, layout or product placement. These patterns help explain why stores with similar entry counts may deliver different results, and where changes could improve the customer journey.
Use a consistent comparison period to assess campaigns and operations. Review footfall before, during and after a promotion, then compare changes with sales and zone engagement. Across multiple locations, these metrics can identify stores that attract visitors and stores that convert them effectively. Managers can then direct staffing or layout reviews towards specific patterns, rather than relying on a single daily total. To build this view, explore people-counting analytics for retail environments.
Footfall Australia
Footfall Australia helps retailers build a clearer picture of store visits when entry counts alone are not enough to guide performance decisions. Its people-counting and analytics offerings include FootfallCam Pro2 People Counters, FootfallCam Pro1 IP Cameras, FootfallCam Centroid and FootfallCam V9 Software. Together, these options support a data-led approach to understanding traffic across physical retail environments.
Consider people-counting technology when you need consistent visitor data to compare store activity, assess traffic patterns or inform staffing and opening-hour decisions. The right approach depends on the questions your business needs its footfall data to answer, such as how visits vary by time or location.
Contact Footfall Australia to discuss how its people-counting solutions could support your store performance analysis.
Turn Store Insights into Your Next Decision
Start by connecting visitor measurement to a decision your team can act on, such as reviewing store hours, staffing patterns or layout. Evaluating retail store performance with footfall data is more useful when the measurement approach matches the question, whether you need entrance counts or insights into movement across a retail space.
Footfall Australia offers FootfallCam Pro2 People Counters, FootfallCam Pro1 IP Cameras and FootfallCam Centroid to support different approaches to people counting and visitor analysis. Choose a clear operational question first, then discuss which solution best fits the information your stores need.
Contact Footfall Australia to discuss your retail footfall measurement needs. A practical next step can bring greater clarity to the decisions ahead.
Frequently Asked Questions
How can footfall analytics inform decisions about store opening hours?
Footfall analytics can help identify trading periods when customer visits and sales activity support keeping a store open. Compare traffic by hour with transactions, staffing coverage and operating requirements. For example, a store might assess a quiet late-afternoon period differently if sales remain steady or nearby customer activity suggests unmet demand. Use recurring patterns, not a single unusual day, to inform schedule changes.
Can footfall data predict a store’s success?
Footfall data can indicate demand, but it cannot predict success on its own. A new location may attract visitors without converting them into customers, while strong sales can depend on product availability, pricing and repeat business. Combine traffic trends with sales, occupancy and local trading context. For example, rising visits alongside declining transactions suggest a different issue from falling visits and sales together.
What is zone-level footfall analytics and how is it used in retail?
Zone-level footfall analytics measures how visitors move through defined areas inside a store, rather than counting entrance activity alone. A retailer could compare engagement near a promotional display with traffic through a nearby aisle. If visitors pass the display without stopping, the team can assess its placement or visibility. Movement patterns can also reveal congestion and underused areas that warrant a layout review.
How accurate are modern footfall counting systems?
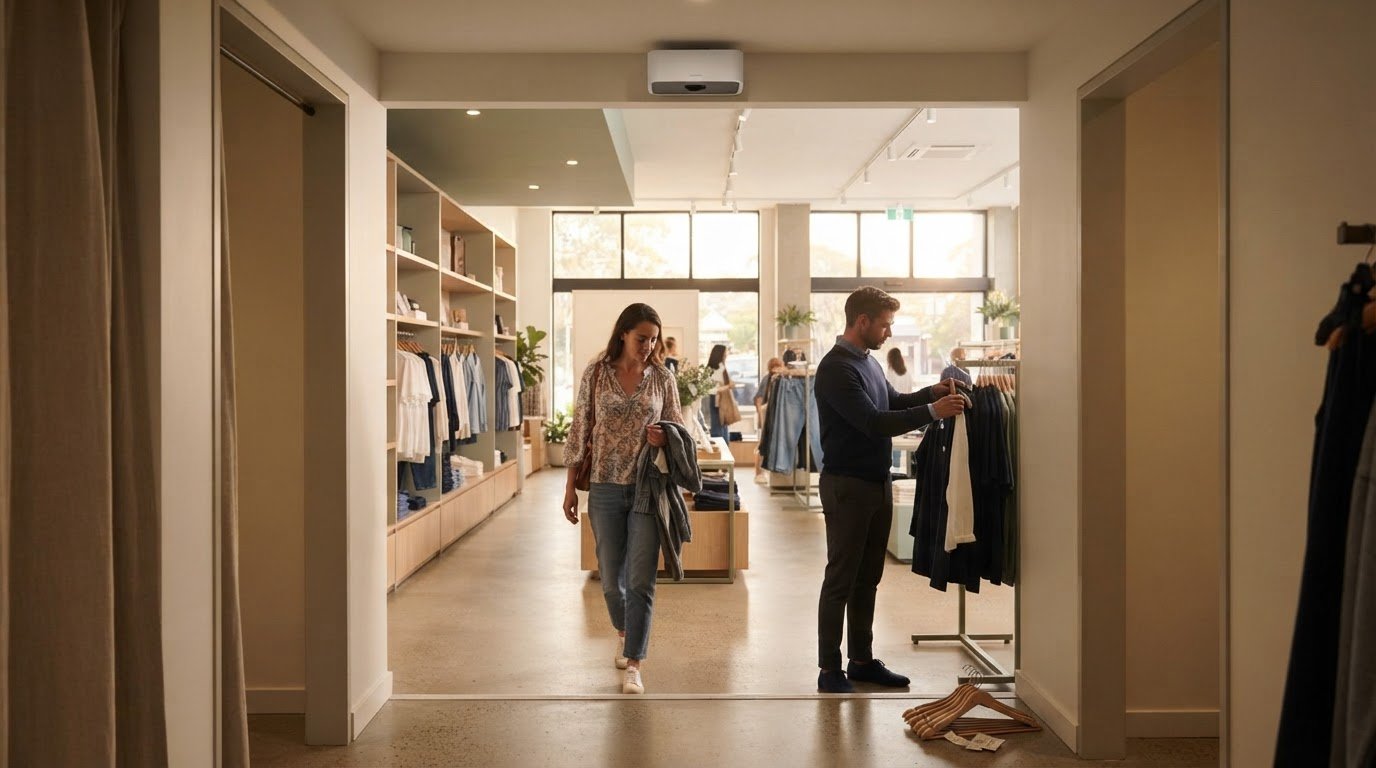
Ceiling-mounted AI-powered video analytics can achieve accuracy rates of 98% or higher. Counting quality depends on camera positioning, system configuration, lighting and the analytics technology used. Entrance design and crowd density can also affect infrared counter performance. Treat accuracy as a property of the installed system and its conditions, then assess whether entry and exit counts remain consistent with observed store activity.
How can profitability be maximised by analysing footfall at the point of sale?
Compare traffic near checkout areas with transaction patterns to identify where sales opportunities may be lost. For example, busy periods with low transaction activity can prompt an investigation into queue congestion, staffing coverage or product availability. Review these patterns across trading periods and locations. The evidence can guide targeted operational changes, while sales data helps distinguish increased visitor activity from stronger commercial outcomes.