From Spreadsheet to Automated Reporting: A Strategic Guide for Data-Driven Organisations
Recent research indicates that 94% of business spreadsheets contain errors that directly affect executive decision-making. If your team spends over eight hours every week on manual data entry and fixing broken pivot tables, you’re likely operating in a reactive state rather than a proactive one. Transitioning from spreadsheet to automated reporting isn’t just about saving time; it’s about establishing a single source of truth that replaces intuition with empirical evidence.
You understand the frustration of delivering reports that are already outdated by the time they reach a stakeholder’s desk. We promise to show you how to eliminate these manual bottlenecks and transition to a sophisticated, automated reporting ecosystem that drives measurable growth. This guide outlines the strategic shift toward real-time data access, utilizing tools like the FootfallCam Pro2 and V9 analytics software to transform raw physical movement into actionable business intelligence.
Key Takeaways
- Identify the hidden fiscal and operational costs of manual data preparation and how it traps your high-value staff in repetitive, low-impact tasks.
- Learn the strategic steps to transition from spreadsheet to automated reporting by integrating AI-powered sensors that stream data directly to the cloud.
- Discover why the combination of FootfallCam Pro2 hardware and V9 software provides a more reliable, scalable foundation than fragile, custom-coded workbooks.
- Master a clear implementation framework, from auditing current data bottlenecks to utilizing the Legacy Swap Out Plan for immediate hardware modernization.
- Shift your organizational focus from reactive data cleaning to proactive strategic analysis using real-time dashboards and over 60 automated reporting templates.
The Hidden Cost of Manual Spreadsheet Reporting in 2026
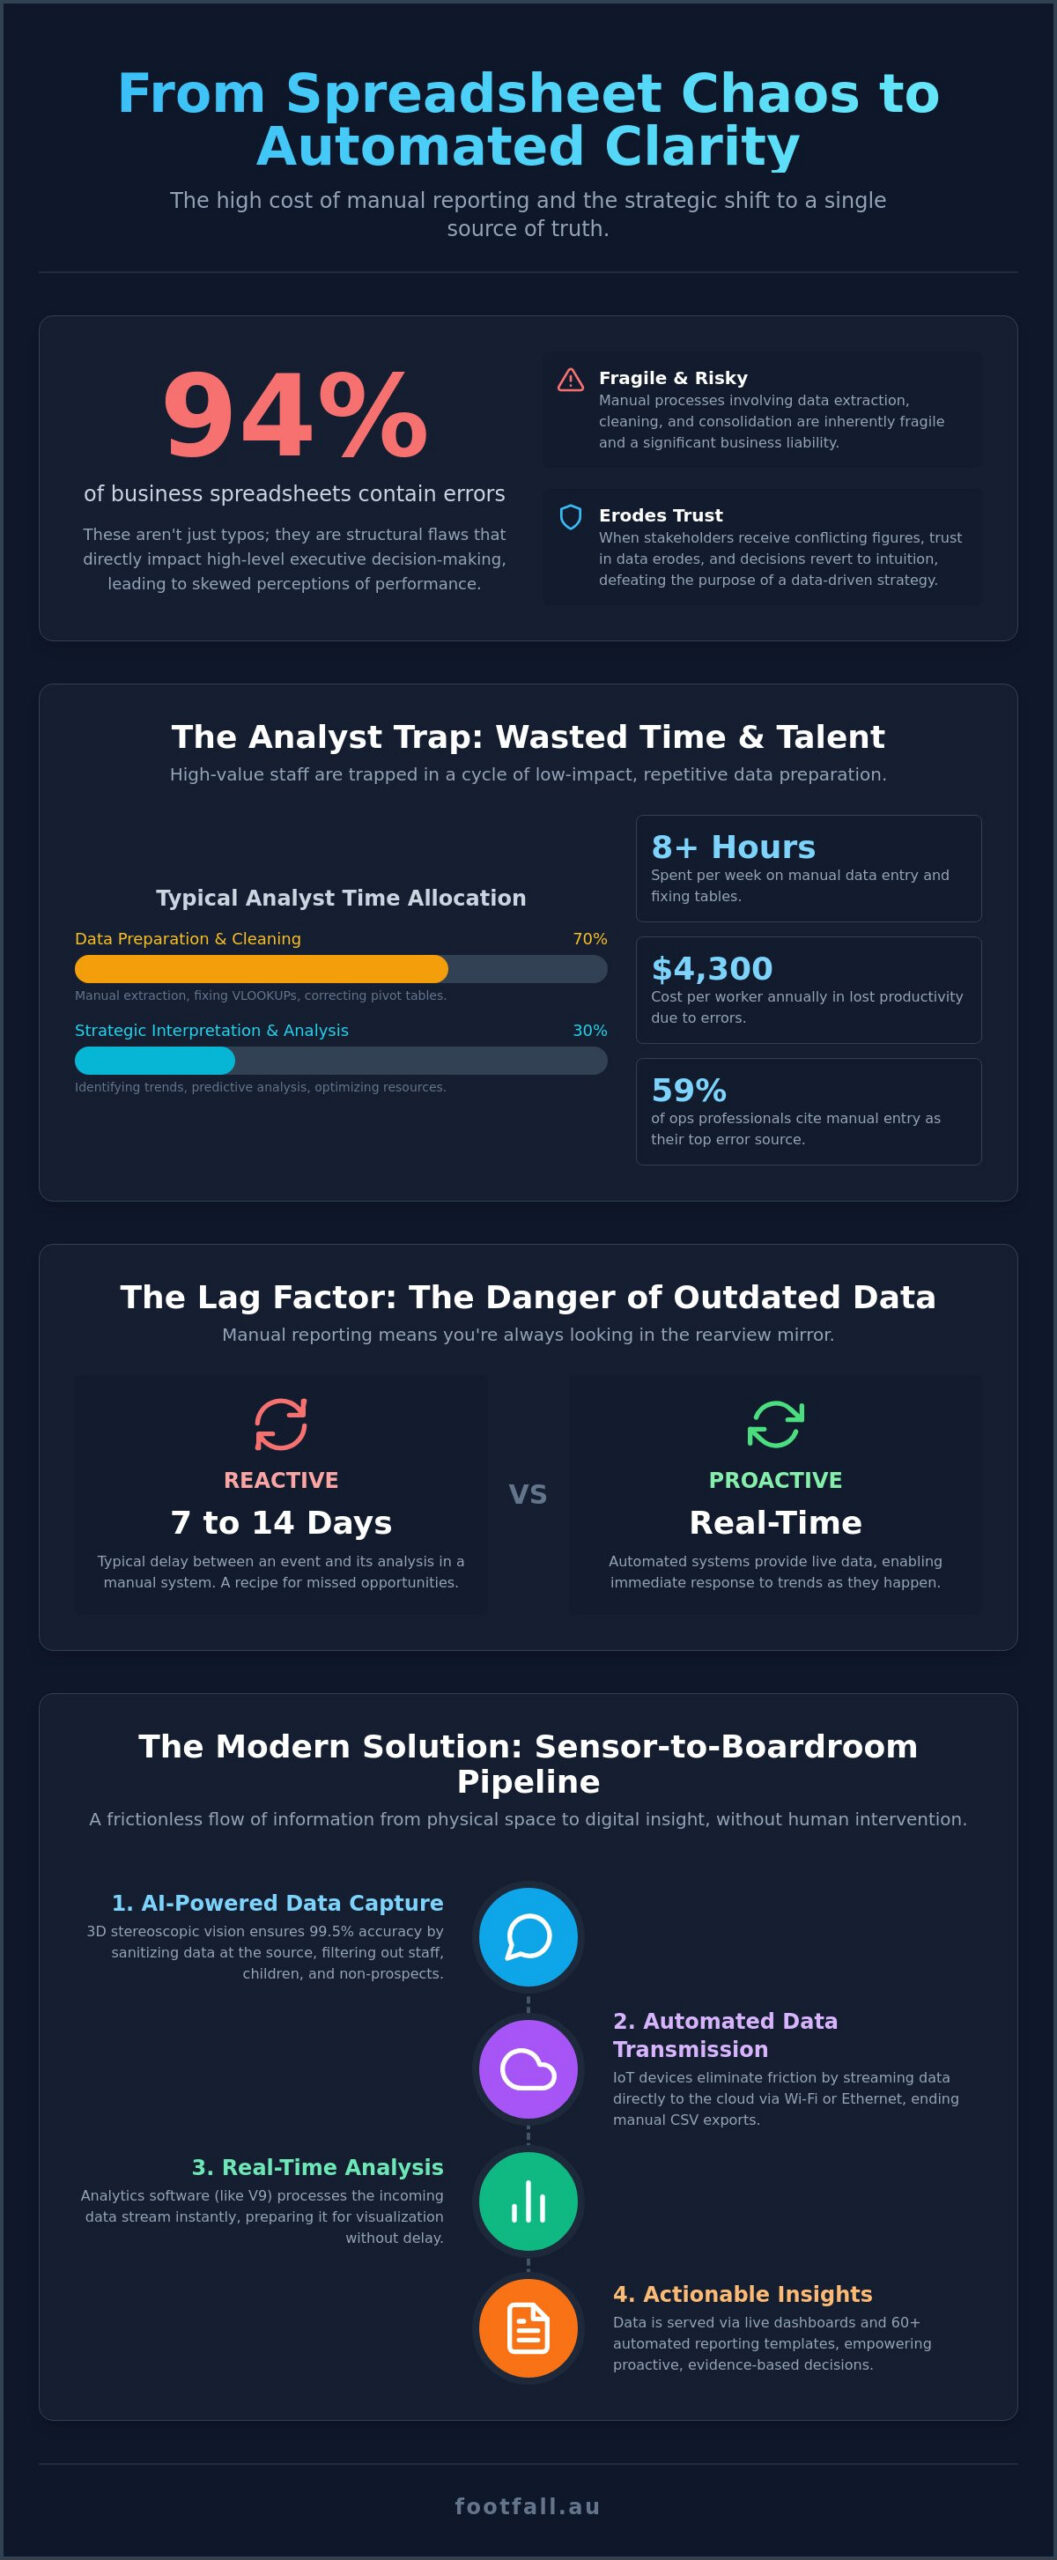
Manual reporting is a repetitive cycle that involves extracting raw data from various silos, manually cleaning it in Excel, and distributing static files. This process is inherently fragile. When organizations transition from spreadsheet to automated reporting, they often discover that their previous reliance on manual workbooks was a significant liability. According to research cited in Frontiers of Computer Science, 94% of business spreadsheets contain errors that directly influence decision-making. These aren’t just minor typos. They’re structural flaws that skew the perception of organizational performance.
The typical manual reporting workflow includes several high-risk steps:
- Data extraction from disconnected hardware or software silos.
- Manual cleaning to remove duplicates or fix formatting inconsistencies.
- Formula-heavy consolidation into a “master” workbook.
- Manual distribution of static PDF or Excel files to stakeholders.
High-value analysts often fall into what we call the “Analyst Trap.” In this scenario, staff spend approximately 70% of their time on data preparation rather than strategic interpretation. Instead of identifying behavioral trends or optimizing resource allocation, they’re verifying VLOOKUPs and fixing broken pivot tables. This creates a dangerous lag factor. Insights derived from manual spreadsheets are typically seven to 14 days behind real-world events. In a fast-moving environment, acting on two-week-old data is a recipe for missed opportunities and inefficient operations.
The Financial Impact of Data Entry Errors
The fiscal consequences of manual entry are substantial. Inc. Magazine reported in 2026 that workers spend an average of 3.6 hours per week fixing spreadsheet errors. This costs organizations roughly $4,300 per worker annually in lost productivity. A DOSS study cited in the same year found that 59% of operations professionals report manual data entry mistakes as their most common error source. Beyond these direct labor costs, the risk to the bottom line is immense. A single broken formula in a staffing model can lead to incorrect multi-million dollar labor allocations. When stakeholders receive conflicting figures from different departments, trust in the data erodes. Decisions then begin to rely on intuition again, which defeats the purpose of a data-driven strategy.
Opportunity Costs: What Your Team Isn’t Doing
Every hour spent as a data janitor is an hour lost as a strategic advisor. Automation allows your team to pivot from documenting what happened last week to predicting what will happen tomorrow. In the Australian retail landscape, real-time responsiveness is a competitive necessity. By moving from spreadsheet to automated reporting, organizations empower their teams to focus on predictive analysis. This shift enables management to adjust staffing levels or marketing efforts based on live footfall trends. It ensures that resources are always aligned with actual human behavior rather than historical guesses. The result is a more agile organization that can respond to shifting behavioral trends as they happen.
To further enhance these marketing efforts, apmediagrowth.com.au provides a framework for Australian brands to optimize their landing page performance and digital conversion rates.
From Sensor to Software: The Mechanism of Modern Automation
Transitioning from spreadsheet to automated reporting requires more than just new software; it requires a reliable, automated data source. Many organizations attempt to automate their reporting using data that is still collected manually or via legacy infrared beams. This creates a “garbage in, garbage out” scenario where sophisticated dashboards are fed by flawed, inconsistent inputs. Modern automation begins at the ceiling, not the desktop. It’s about creating a “sensor-to-boardroom” pipeline that operates without human interference.
AI-Powered Data Collection
The first step in a truly automated pipeline is replacing manual tallies and basic sensors with AI-driven hardware. The FootfallCam Pro2 uses 3D stereoscopic vision to perceive the physical environment with human-like depth perception. This technology ensures 99.5% accuracy by filtering out non-prospects at the source. It distinguishes between staff members, children, and shopping groups, ensuring that the data entering your system represents genuine business opportunities. By sanitizing data at the point of collection, you eliminate the need for the extensive “cleaning” phases that typically plague manual spreadsheet workflows.
The Automated Data Pipeline
Once captured, information must move without human intervention. Legacy systems often require a manager to perform a “CSV export” or a manual download at the end of each day. Modern IoT devices eliminate this friction by streaming data directly to the cloud via Wi-Fi or Ethernet. This creates a real-time data flow that supports immediate decision-making rather than day-old batch processing. For organizations with existing infrastructure, tools like the FootfallCam Centroid can integrate legacy CCTV feeds into this automated flow, providing a bridge to modern analytics without a total hardware overhaul. Secure cloud storage and automated backups ensure that your historical records remain intact and accessible from any location.
True sophistication emerges when you move from fragmented local files to a unified footfall data analysis platform. This centralization is the backbone of data maturity. Through robust APIs, traffic data can automatically sync with Point-of-Sale (POS) and workforce management systems. This integration allows the business to calculate conversion rates and labor efficiency metrics in real-time. If you’re looking to modernize your data collection, our automated counting solutions provide the foundational accuracy required for strategic growth. By connecting the physical environment directly to the boardroom, you remove the latency and errors that define the manual era.
Beyond VBA: Why Dedicated Platforms Outperform Custom Spreadsheets
Many organizations rely on a single “Excel expert” to maintain complex VBA macros and Power Query connections. This creates significant maintenance debt. If that individual leaves the organization, the reporting infrastructure often collapses or becomes a legacy burden that no one else can troubleshoot. Moving from spreadsheet to automated reporting mitigates this risk by shifting the logic from a person-dependent file to a professionally maintained platform. It’s the difference between a fragile, custom-built tool and a resilient, enterprise-grade system.
Scalability is another critical hurdle. Managing five spreadsheets is a minor task; managing 50 for a national retail chain is a logistical nightmare. A centralized software instance allows for global updates to reporting logic, ensuring that every stakeholder looks at the same KPIs simultaneously. This also addresses the security risks inherent in emailing XLSX files. Sensitive business data is significantly safer in a secure cloud environment than sitting in an unencrypted inbox where it can be easily forwarded or misplaced.
Spreadsheets vs. FootfallCam V9 Software
FootfallCam V9 Software replaces manual formula creation with over 60 pre-built industry templates. These aren’t just generic charts. They’re strategic tools designed for specific retail and public space outcomes, such as conversion rate analysis and heat mapping. While a spreadsheet requires manual labor to update each week, V9 handles automated distribution. You can schedule high-fidelity reports for daily, weekly, or monthly delivery directly to stakeholder inboxes. This ensures that every branch manager and executive operates from “One Version of the Truth,” eliminating the conflicting figures often found in disconnected local files. It moves the organization away from debates about data accuracy and toward discussions about strategic growth.
Data Integrity and Validation
Dedicated platforms offer a level of data integrity that spreadsheets simply cannot match. V9 includes platform-level health checks that notify you instantly if a sensor goes offline. In a manual system, you might not realize a data gap exists until the end of the month when the final report is due. The software also handles automated data cleaning. If a network interruption occurs, the system automatically syncs and validates the missing information once connectivity is restored. This process requires zero manual intervention. Finally, dedicated platforms provide robust audit trails. You can track exactly who accessed the data and when they did so, providing a level of governance and compliance that is impossible to achieve with standard spreadsheets. This shift from spreadsheet to automated reporting ensures that your data isn’t just automated, but consistently accurate, secure, and ready for scrutiny.
Implementing Automated Reporting in Your Organisation
Modernising your reporting infrastructure is a structured process that moves beyond technical installation. It requires a shift in organisational culture and a clear roadmap to ensure long-term utility. Successfully moving from spreadsheet to automated reporting involves five critical steps designed to eliminate manual bottlenecks and establish a foundation of empirical truth.
- Step 1: Audit current data sources. Identify where manual entry is most prevalent and where maintenance debt is accumulating. Determine which reports are currently reactive and how they can be transformed into proactive tools.
- Step 2: Upgrade the hardware foundation. Reliable automation is impossible without accurate sensors. Utilize the Legacy Swap Out Plan to replace outdated infrared or manual systems with AI-powered counters.
- Step 3: Define KPIs in the V9 environment. Move your logic into the software. Configure the system to calculate your specific business metrics automatically rather than in a local workbook.
- Step 4: Configure automated distribution. Set up scheduled delivery for stakeholders. This ensures that the right data reaches the right person at the right time without manual intervention.
- Step 5: Transition to action. Reallocate the time saved from data cleaning toward strategic analysis. Use the newfound clarity to drive operational changes.
Defining Your Strategic KPIs
Transitioning from spreadsheet to automated reporting allows you to monitor metrics that are too complex for manual workbooks to handle reliably. Move your focus beyond simple “total ins” to sophisticated indicators like conversion rates and average dwell times. The V9 software enables you to set up automated alerts for unusual traffic patterns, allowing managers to respond to surges or dips as they happen. You can also benchmark performance across national sites automatically, identifying top-performing locations and applying their strategies to underperforming areas.
This shift towards analytical precision is also transforming the trade industry. By utilizing data-led lead generation for tradies, contractors can identify high-performing marketing channels and allocate their budget more effectively, moving away from the guesswork of traditional advertising.
Training and Adoption
The success of automation depends on how easily your team can use the information. The V9 interface is designed for non-technical managers, presenting complex data through intuitive, visual dashboards. This accessibility improves accountability at the store level, as managers can see the direct impact of their staffing and layout decisions. High-precision hardware like the FootfallCam Pro2 also allows you to validate marketing spend by correlating footfall spikes with specific campaign dates. To begin your journey toward a more efficient, data-driven future, contact our specialist team today to discuss your automation requirements.
The FootfallCam Ecosystem: Your Partner in Data Maturity
Footfall Australia serves as the strategic partner for organisations looking to move beyond basic data collection. As the preferred provider for national people counting systems, we focus on the utility of information rather than just the provision of hardware. The synergy between high-precision sensors and intuitive software creates a seamless flow from physical movement to boardroom insight. This integration ensures that your transition from spreadsheet to automated reporting is not just a technical upgrade but a shift in organisational maturity. It allows you to execute strategy rather than just track numbers.
By centralising your data within the FootfallCam environment, you future-proof your operations. Our people counting technology incorporates advanced AI and machine learning to interpret human behavior with high precision. This allows businesses to stay prepared for shifting behavioral trends while maintaining a stable, evidence-based foundation for every operational decision. We treat physical presence as a sequence of human actions that can be interpreted to drive growth.
Comprehensive Support for Your Transition
Moving away from manual processes requires reliable infrastructure. We provide professional installation and remote configuration services to ensure your system is optimised from day one. Our Basic and Premium Support plans offer ongoing peace of mind, providing varying levels of technical oversight and data health monitoring to ensure 24/7 availability. The Legacy Swap Out initiative further facilitates this transition by assisting organisations in replacing fragile, outdated hardware with modern AI-driven solutions. This comprehensive approach ensures that your reporting pipeline remains robust and your data integrity stays uncompromised. It’s a structured path to long-term stability.
Case Study: The Impact of Automation
One national retail chain successfully eliminated manual data cleaning by adopting V9 automation, saving their operations team 15 hours per week in administrative labor. This shift led to a measurable improvement in staffing efficiency. By using automated traffic data, management could align staff rosters with actual visitor peaks rather than relying on historical guesses. This change directly improved customer service levels while reducing unnecessary labor costs during quiet periods.
The transition from spreadsheet to automated reporting is an essential step for competitive businesses. It empowers your team to stop managing files and start managing growth. By choosing a partner that values accuracy and efficiency above all else, you ensure that your organisation is ready for the future of physical space analytics. The move toward automation is a move toward clarity, reliability, and strategic advantage.
Future-Proofing Your Organisational Intelligence
The transition from manual data extraction to a sensor-to-boardroom pipeline represents a fundamental shift in how modern organisations operate. By moving from spreadsheet to automated reporting, you eliminate the maintenance debt of custom workbooks and the high risk of human error. It’s not just about saving hours of administrative labor; it’s about ensuring every decision is backed by empirical evidence rather than intuition. You’ve seen how AI-powered hardware and sophisticated software like FootfallCam V9 can transform raw movement into strategic advantage.
Our team is ready to help you implement a system that offers 99.5% accuracy guaranteed and a library of 60+ automated report templates. Upgrade from spreadsheets to automated reporting with Footfall Australia and leverage our national Australian support network to keep your insights flowing 24/7. Reliable data is the cornerstone of sustainable growth. We look forward to helping you build a more efficient, insight-driven future.
Frequently Asked Questions
How long does it take to move from spreadsheets to an automated system?
Most organisations complete the transition from spreadsheet to automated reporting within two to four weeks. This timeline includes the physical installation of FootfallCam Pro2 hardware and the initial configuration of the V9 software environment. Once the sensors are active, data begins streaming immediately. The final week is typically reserved for fine-tuning automated report distribution and ensuring all stakeholders have access to their respective dashboards.
Do I need advanced IT skills to use FootfallCam V9 software?
Advanced IT skills aren’t required to operate the FootfallCam V9 software. The platform is designed for business managers and operations teams, offering an intuitive interface that simplifies complex data sets. While our technical team handles the initial setup and remote configuration, day-to-day users can easily navigate over 60 pre-built report templates. This allows you to focus on strategic analysis rather than technical troubleshooting or manual formula management.
Can automated reporting integrate with my existing POS system?
Integration with existing Point-of-Sale (POS) systems is a core feature of a modern automated reporting ecosystem. By using robust APIs, the FootfallCam V9 software can automatically correlate transaction data with visitor traffic. This allows your organisation to calculate conversion rates in real-time without manual data merging. This synergy provides a more accurate view of store performance and helps identify specific windows of opportunity for operational improvement.
What happens to my historical spreadsheet data during the transition?
Your historical data remains a valuable asset during the transition. You can import legacy spreadsheet records into the V9 software to maintain a continuous narrative of your business performance. This ensures that you don’t lose year-on-year comparisons when moving from spreadsheet to automated reporting. Having all data in one centralised instance allows for more sophisticated long-term trend analysis and helps validate the accuracy of your new automated sensors against previous manual benchmarks.
How much time can my staff realistically save with automated reporting?
Staff typically save between eight and fifteen hours per week by eliminating manual data entry and cleaning tasks. Instead of acting as data janitors who extract and reformat CSV files, your team can pivot to strategic advisory roles. Automation handles the repetitive cycle of data collection and distribution. This allows high-value analysts to spend their time interpreting behavioral trends and optimising resource allocation across your locations.
Is the data from automated people counters more accurate than manual counting?
Automated people counters provide significantly higher accuracy than manual counting methods. The FootfallCam Pro2 uses 3D stereoscopic vision to achieve a guaranteed 99.5% accuracy rate, even in high-traffic environments. Manual counting is prone to human fatigue and distraction, often leading to inconsistent results. Automation removes these variables, providing a stable and empirical foundation for your business reports that is not subject to the limitations of human observation.
Can I still export data to Excel if I need to do a one-off custom analysis?
The V9 software maintains full export functionality for one-off custom analyses. While the goal is to centralise reporting, we recognise that specific, unique queries may occasionally require manual manipulation. You can export data in various formats, including XLSX and CSV, at any time. This ensures you have the flexibility to perform deep-dive investigations while still relying on the automated system for your primary, daily strategic reporting and stakeholder distribution.
What is the Legacy Swap Out Plan and how does it help with automation?
The Legacy Swap Out Plan is a strategic initiative designed to help organisations modernise their hardware foundation. It facilitates the replacement of outdated manual clickers or basic infrared counters with AI-powered FootfallCam Pro2 sensors. This plan lowers the barrier to entry for businesses still tethered to manual reporting. By upgrading your hardware, you ensure that the data feeding your automated reports is accurate, high-fidelity, and ready for advanced analytics.