Benchmarking Retail Store Performance: A Data-Driven Guide for 2026
What if your highest-grossing location is actually your least efficient operation? It’s easy to feel a sense of security when top-line revenue climbs, but high sales volume often masks underlying conversion issues that quietly erode your ROI. You’ve likely felt the frustration of trying to justify staffing costs during peak hours without the hard evidence to back your decisions. Benchmarking retail store performance effectively requires looking past the cash register to understand the human behavior driving every visit.
We understand that relying on intuition in a data-rich environment feels increasingly risky. This guide provides the frameworks you need to correlate foot traffic with sales outcomes, moving your strategy from guesswork to empirical logic. You’ll learn how to evaluate the five core KPIs of store health and gain the data-backed confidence required to optimize your physical footprint. We’ll start by breaking down the specific metrics that separate market leaders from those still guessing at their success.
Key Takeaways
- Identify why revenue alone is a deceptive metric and how shifting toward efficiency-first benchmarks reveals the true health of your operations.
- Master the art of correlating foot traffic with POS data to calculate conversion rates, the single most critical indicator of in-store performance.
- Learn a step-by-step framework for benchmarking retail store performance that aligns your data sources with specific operational “North Star” goals.
- Discover how to evaluate your store’s “Capture Rate” to understand how effectively your storefront converts street traffic into active visitors.
- Explore how AI-powered tools like the FootfallCam Pro2 automate the collection of pure customer data by filtering out staff and group movements.
The Fundamentals of Benchmarking Retail Store Performance in 2026
Benchmarking is the systematic process of measuring your store’s key performance indicators (KPIs) against specific internal or external standards. It provides a structured way to understand where your operations excel and where they fall short. By mastering the benchmarking fundamentals, retail leaders can move beyond anecdotal evidence and toward a strategy defined by empirical logic. This approach ensures that every operational adjustment is an informed response to verified data rather than a reaction to a “gut feel.”
In the 2026 retail environment, the focus has shifted from “Sales-Only” to “Efficiency-First” metrics. High revenue doesn’t always equal success; it can often hide operational waste or missed opportunities. For instance, top North American retailers now target a 98.5% in-stock percentage as a baseline for availability. If your store meets its sales targets but fails this benchmark, you’re likely losing potential revenue to stockouts that your current reporting doesn’t capture. Effective benchmarking retail store performance identifies these gaps by correlating what happens on the floor with what is recorded at the point of sale.
Data-driven benchmarking serves as the ultimate antidote to reactive management. Instead of responding to a slow month with panicked discounts or staffing cuts, data allows you to identify if the dip was a localized conversion issue or a broader seasonal trend. It creates a culture of accountability where success is defined by clear, measurable pillars: historical, internal, and competitive data.
Historical vs. Internal Benchmarking
Historical benchmarking compares your current performance against your own past trends and seasonal cycles. This is your most reliable baseline because it accounts for your specific location’s nuances. Internal benchmarking, however, levels the playing field between high-traffic flagship stores and smaller regional outlets. It allows you to compare conversion rates across different environments. This ensures that a store with lower total sales isn’t unfairly penalized if it’s actually converting a higher percentage of its visitors than a high-traffic flagship. It’s about measuring how well you utilize the traffic you have, regardless of the store’s size.
The Role of External Industry Standards
External benchmarking involves comparing your results against third-party data or sector averages. Research shows that North American retailers generate an average of $56.44 per transaction, though this varies by vertical. Knowing where your sector sits in terms of traffic averages and customer satisfaction provides essential context for your own growth. You must be cautious of “vanity metrics” when comparing against broad industry averages. Comparing a specialty boutique’s traffic to a big-box retailer’s average is counterproductive. Focus on finding reliable data within your specific niche to ensure your comparisons remain actionable and relevant to your unique business goals.
Internal Benchmarking: Correlating Foot Traffic with Sales Conversion
Internal benchmarking reveals the operational truth that revenue alone often obscures. While a flagship store may report impressive sales figures, those numbers are meaningless without the context of opportunity. If a location experiences massive footfall but maintains a low conversion rate, it isn’t a success; it’s a missed opportunity. This realization is a cornerstone of modernizing retail performance metrics. By focusing on conversion, you shift the focus from what you earned to how much you left on the table.
Consider two locations in your network. Store A generates $50,000 in weekly sales from 5,000 visitors. Store B generates $45,000 from 2,000 visitors. Without footfall data, Store A looks like the winner. However, Store B is significantly more efficient, converting a much higher percentage of its potential. Benchmarking retail store performance through this lens allows you to identify which managers are truly maximizing their resources and which are simply benefiting from a high-traffic location. It moves the conversation from total volume to operational excellence.
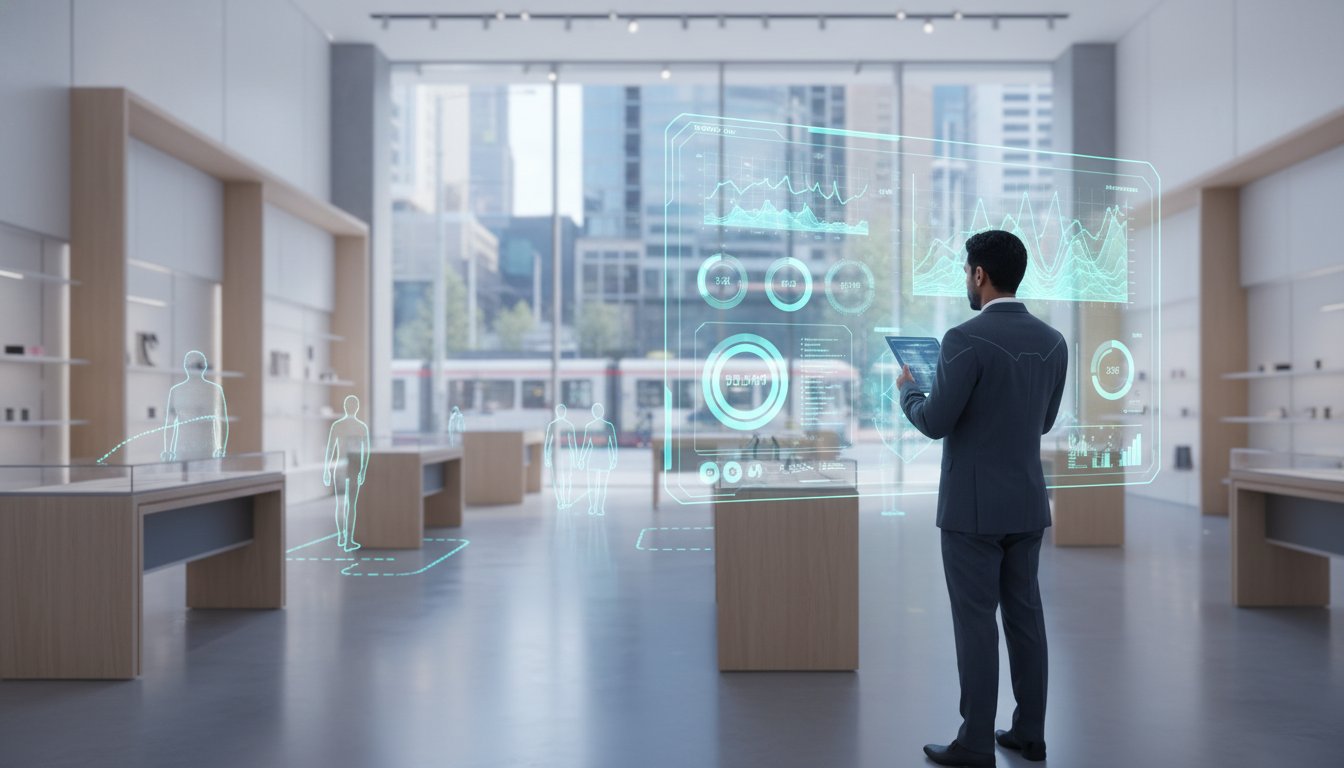
Dwell time benchmarks also allow you to test the effectiveness of store layouts or visual merchandising. If a recent floor plan change hasn’t increased the average time a customer spends in a specific zone, the adjustment hasn’t achieved its goal. This logic applies to every square meter of your retail space. By treating movement as a narrative, you can see exactly where the customer journey breaks down and where engagement peaks. These objective data points provide the clarity needed to make precise operational adjustments without relying on intuition.
Calculating and Benchmarking Conversion Rates
The formula for this metric is straightforward: (Total Transactions / Total Footfall) x 100. Conversion rate serves as the essential bridge between your marketing efforts and your floor operations. Setting targets depends on your category. A luxury jewelry store naturally expects lower conversion than a grocery outlet, where visitors usually intend to buy. Use your historical averages to set a baseline, then aim for incremental growth across your network to ensure consistent results.
Traffic-to-Staffing Ratios
Optimizing labor costs involves benchmarking your staff count against visitor volume. Aiming for a specific number of staff per 100 visitors during peak times ensures service quality doesn’t suffer when the store is busy. By implementing retail footfall analysis Australia, managers can identify precisely when traffic outpaces service capacity. This prevents “lost opportunities” where customers leave because they couldn’t find assistance. Achieving this level of insight is simpler when you integrate automated traffic data into your weekly reporting.

Competitive and Industry Benchmarking: How Do You Compare?
Measuring your own progress is essential, but true strategic advantage comes from understanding your position within the broader market. Traditional retail metrics often rely on sales per square metre to determine value. While this is a useful real estate metric, it fails to account for operational efficiency. Sales per visitor provides a more actionable insight because it measures how effectively your team converts the specific opportunity presented by your location. By shifting the focus to visitor-based metrics, benchmarking retail store performance becomes an exercise in optimizing human interaction rather than just managing floor space.
Referencing authoritative sources like U.S. retail industry data helps retailers distinguish between a localized slump and a broader economic downturn. If your sales are down 5% but national averages for your sector have dropped 12%, your store is actually gaining market share. This external context prevents knee-jerk reactions to market-wide volatility and allows you to evaluate your results against the “Gold Standard” of your specific niche. It ensures your strategic decisions are rooted in objective reality rather than isolated statistics.
The Capture Rate Benchmark
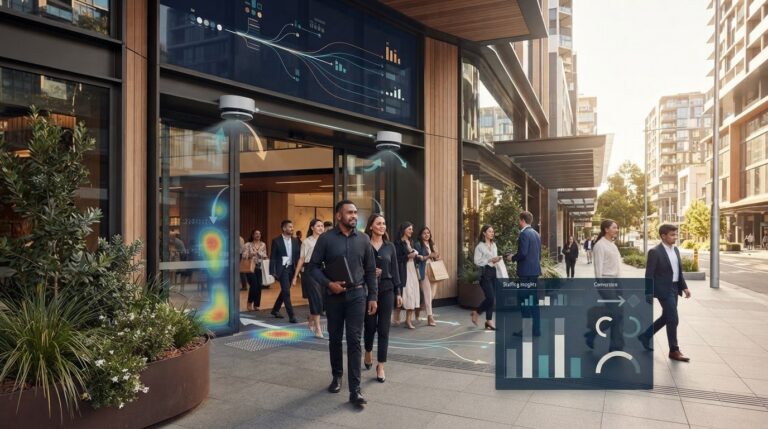
The capture rate represents the percentage of passers-by who cross your threshold. It’s the ultimate measure of your exterior branding and window display effectiveness. High street traffic is a resource you pay for through rent; the capture rate tells you how much of that resource you’re actually harvesting. Benchmarking this metric across multiple national locations reveals which storefronts successfully stop traffic and which are being ignored. Modern people counting technology makes it possible to track these street-level movements with precision, providing a clear benchmark for your marketing team’s physical impact.
Average Transaction Value (ATV) vs. Units Per Transaction (UPT)
Average Transaction Value (ATV) often fluctuates with inflation or price adjustments, making it a volatile metric for assessing true store efficiency. In contrast, Units Per Transaction (UPT) remains a stable indicator of staff performance and cross-selling success. Benchmarking UPT across your network identifies which teams excel at suggestive selling and which require additional training. When you correlate UPT with dwell time data, a complete performance picture emerges. A store with high dwell time but low UPT suggests that while the environment is engaging, the sales team isn’t effectively closing the loop. These nuances are what separate high-performing retailers from those who simply rely on high-volume footfall.
Implementing a Benchmarking Framework: A Step-by-Step Approach
Establishing a framework for benchmarking retail store performance requires a transition from passive observation to active management. It isn’t enough to simply collect data; you must structure that information so it drives specific operational changes. A robust framework ensures that every stakeholder, from the boardroom to the shop floor, understands what success looks like and how it is measured. This clarity reduces friction and aligns your team toward common efficiency goals.
The first step involves a comprehensive audit of your current data sources. You must evaluate the reliability of your POS systems, staff rosters, and existing traffic counters. Once the audit is complete, define your ‘North Star’ metrics. These are the specific KPIs that align with your organizational goals, whether that’s improving conversion rates or increasing units per transaction. Standardizing this collection process across all locations is vital to ensure ‘apples-to-apples’ comparisons. Establishing a regular reporting cadence for benchmarking retail store performance ensures that performance trends are caught early, allowing for proactive adjustments. Finally, translate these benchmarks into specific frontline actions that store managers can execute on a daily basis.
Standardizing Data Collection
Manual counting fails the benchmarking test because human error and inconsistency are inevitable. Relying on staff to click a counter or estimate crowd sizes introduces subjective bias that compromises your entire data set. To achieve high-quality results, you need a unified platform. Implementing FootfallCam V9 Software allows for automated, national reporting that eliminates these manual failures. This level of integration ensures data integrity across different time zones and accounts for regional holidays, providing a single source of truth for your entire network.
From Data to Actionable Strategy
The true value of a benchmark lies in its ability to facilitate better coaching. Rather than simply demanding higher sales, regional managers can use benchmark gaps to identify exactly where a store is struggling. If a location’s conversion rate falls below the established benchmark, the conversation shifts to specific floor tactics or staffing adjustments. Setting ‘Trigger Points’ is an effective way to automate this process. These are specific benchmark drops that require immediate management intervention, ensuring that performance dips are addressed before they impact the monthly bottom line. Transparency in benchmarking results empowers staff by showing them exactly how their actions influence store efficiency. To begin building your own framework, you can explore our automated reporting solutions to identify the right technology for your specific needs.
Leveraging AI and Footfall Analytics for Precise Performance Benchmarking
AI technology transforms the theoretical framework of benchmarking retail store performance into an automated, high-precision operation. In the 2026 retail landscape, static data is no longer sufficient. You need systems that not only count visitors but interpret their behavior in real time. AI-powered sensors remove the noise from your data sets, ensuring that every benchmark you set is based on pure customer intent rather than incidental movement. This level of technical sophistication allows you to move beyond broad averages and toward a granular understanding of your store’s efficiency.
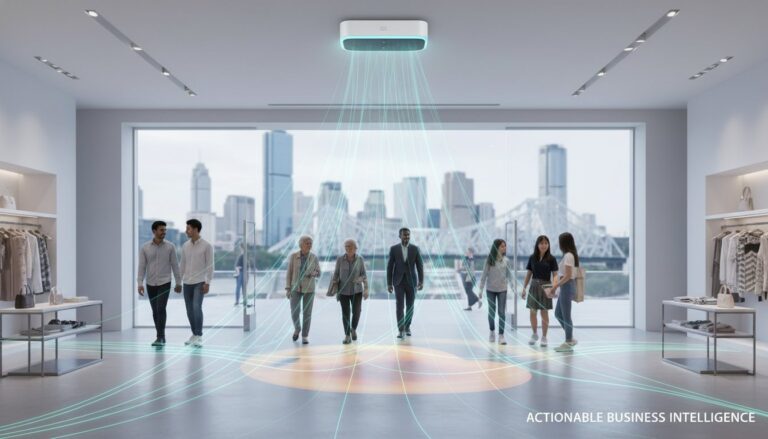
One of the most significant hurdles in traditional benchmarking is the inclusion of non-customer traffic. Staff movements, security patrols, and delivery personnel can inflate footfall numbers, leading to artificially low conversion rates. Advanced AI counters like the FootfallCam Pro2 solve this by using sophisticated algorithms to distinguish between employees and shoppers. By filtering out staff and group movements, the system provides a clean data set. This ensures that your performance benchmarks reflect actual market opportunity, allowing for a more accurate evaluation of your operational success.
Real-time benchmarking represents the next evolution in store management. Instead of waiting for weekly reports, managers can now compare live traffic against historical averages on the fly. If current footfall is significantly higher than the typical Monday afternoon benchmark, staff can be redeployed immediately to handle the surge. This proactive approach prevents service bottlenecks before they impact your conversion rate. Looking ahead through 2026, the focus is shifting toward predictive analytics. AI-driven forecasting will allow you to benchmark your performance against predicted trends, helping you stay ahead of shifting consumer behaviors.
The FootfallCam Pro2 Advantage
Achieving 99% accuracy is non-negotiable for reliable performance benchmarking. High-quality data serves as the foundation for every strategic decision you make. The FootfallCam Pro2 uses advanced AI to differentiate between adults and children, providing a clearer picture of your target demographic. When you integrate these people counting systems Australia with your existing POS data, you create a unified ecosystem that tracks the entire customer journey. This integration ensures that your benchmarking efforts are supported by technical innovation that prioritizes utility and accuracy.
Building a Future-Proof Retail Strategy
Moving from retrospective reporting to proactive performance management is essential for long-term growth. Automated benchmarking reduces the administrative burden on retail executives, freeing them to focus on high-level strategy rather than data entry. It creates a transparent environment where success is documented and repeatable across your entire network. By embracing these technological tools, you position your brand as a modern leader capable of adapting to any market condition. You can discover how Footfall Australia can transform your store performance today by implementing a data-driven framework that delivers actionable insights for the future.
Securing Your Competitive Advantage Through Data
Effective benchmarking is no longer about looking back at last month’s receipts. It’s about understanding the narrative of movement within your physical space and converting that movement into measurable success. By correlating foot traffic with sales outcomes, you gain the clarity needed to optimize staffing, refine store layouts, and justify operational investments. Mastering the art of benchmarking retail store performance ensures your organization remains agile in a shifting market.
Since 2004, we’ve helped Australian businesses replace intuition with empirical logic. Leveraging proprietary FootfallCam Pro2 AI technology and backed by national support and maintenance plans, we provide the technical foundation required for precise analytics. Optimise your retail performance with Footfall Australia’s data-driven solutions. The future of retail belongs to those who measure what matters. Take the first step toward operational excellence and lead your team with data-backed confidence.
Frequently Asked Questions
What is the most important benchmark for a new retail store?
The most important benchmark for a new retail store is the conversion rate. This metric measures operational efficiency rather than just the initial traffic surge typical of a new opening. While revenue is a primary goal, the conversion rate tells you how well your store environment and staff are performing relative to the opportunity presented by new visitors. It provides the most accurate picture of your store’s fundamental health during its first months of operation.
How often should I review my retail performance benchmarks?
You should review your performance benchmarks on a daily, weekly, and monthly basis to capture different levels of strategic insight. Daily reviews allow for immediate staffing adjustments based on current footfall. Weekly and monthly analyses help identify broader trends and the long-term effectiveness of marketing campaigns. This tiered approach ensures your strategy remains agile and responsive to shifting consumer behavior without getting lost in short-term volatility.
Can I benchmark my store performance without an automated people counter?
You can attempt to benchmark your store performance without an automated counter, but the results will likely suffer from high error rates and inconsistency. Manual tallying is subjective and often misses peak traffic surges or filters out staff movements incorrectly. Automated systems provide the objective, verified data necessary for benchmarking retail store performance with high-level accuracy. This ensures your operational decisions are based on empirical truth rather than anecdotal evidence.
What is a ‘good’ sales conversion rate for Australian retail in 2026?
A “good” sales conversion rate varies significantly by vertical. Specialty stores often target 15% to 25%, while high-intent environments like pharmacies or grocery outlets see much higher rates. In the 2026 Australian retail landscape, success is defined by exceeding your own historical averages rather than chasing a single national figure. Focus on incremental improvements within your specific category to drive sustainable growth and maximize your return on investment.
How does store layout impact my performance benchmarks?
Store layout directly impacts benchmarks like dwell time and zone-specific capture rates. An effective layout guides customers through high-margin areas and increases the time they spend interacting with products. By benchmarking movement patterns, you can identify “dead zones” and optimize your floor plan to ensure every square meter contributes to your sales objectives. Data-driven adjustments to your layout can lead to a measurable increase in units per transaction.
Is internal benchmarking more important than competitive benchmarking?
Internal benchmarking is typically more actionable for daily operations because it allows for direct comparisons within your own network. It highlights specific management or staffing successes that can be replicated across other locations. Competitive benchmarking provides essential market context, but internal data reveals the specific operational levers you can pull to improve performance. Both are necessary for a comprehensive view of your store’s health and overall market position.
How do I benchmark staffing costs against customer traffic?
Benchmarking staffing costs involves calculating the “Visitors Per Labor Hour” (VPLH) metric. This allows you to align your roster with actual traffic surges, ensuring you aren’t overstaffed during lulls or understaffed during peak power hours. By correlating labor hours with footfall data, you can optimize your ROI and ensure service levels remain consistent. This data-backed approach prevents the common mistake of staffing based on sales volume alone.
What role does AI play in retail store benchmarking?
AI automates the data collection process and filters out non-customer movements, such as staff or security patrols, to ensure pure data sets. In 2026, AI also plays a critical role in benchmarking retail store performance through predictive analytics. It allows retailers to forecast future traffic trends based on historical patterns and external factors. This moves the benchmarking process from reactive reporting to proactive strategic planning, helping you stay ahead of market shifts.