Common Retail Layout Mistakes to Avoid: A Data-Driven Guide for 2026
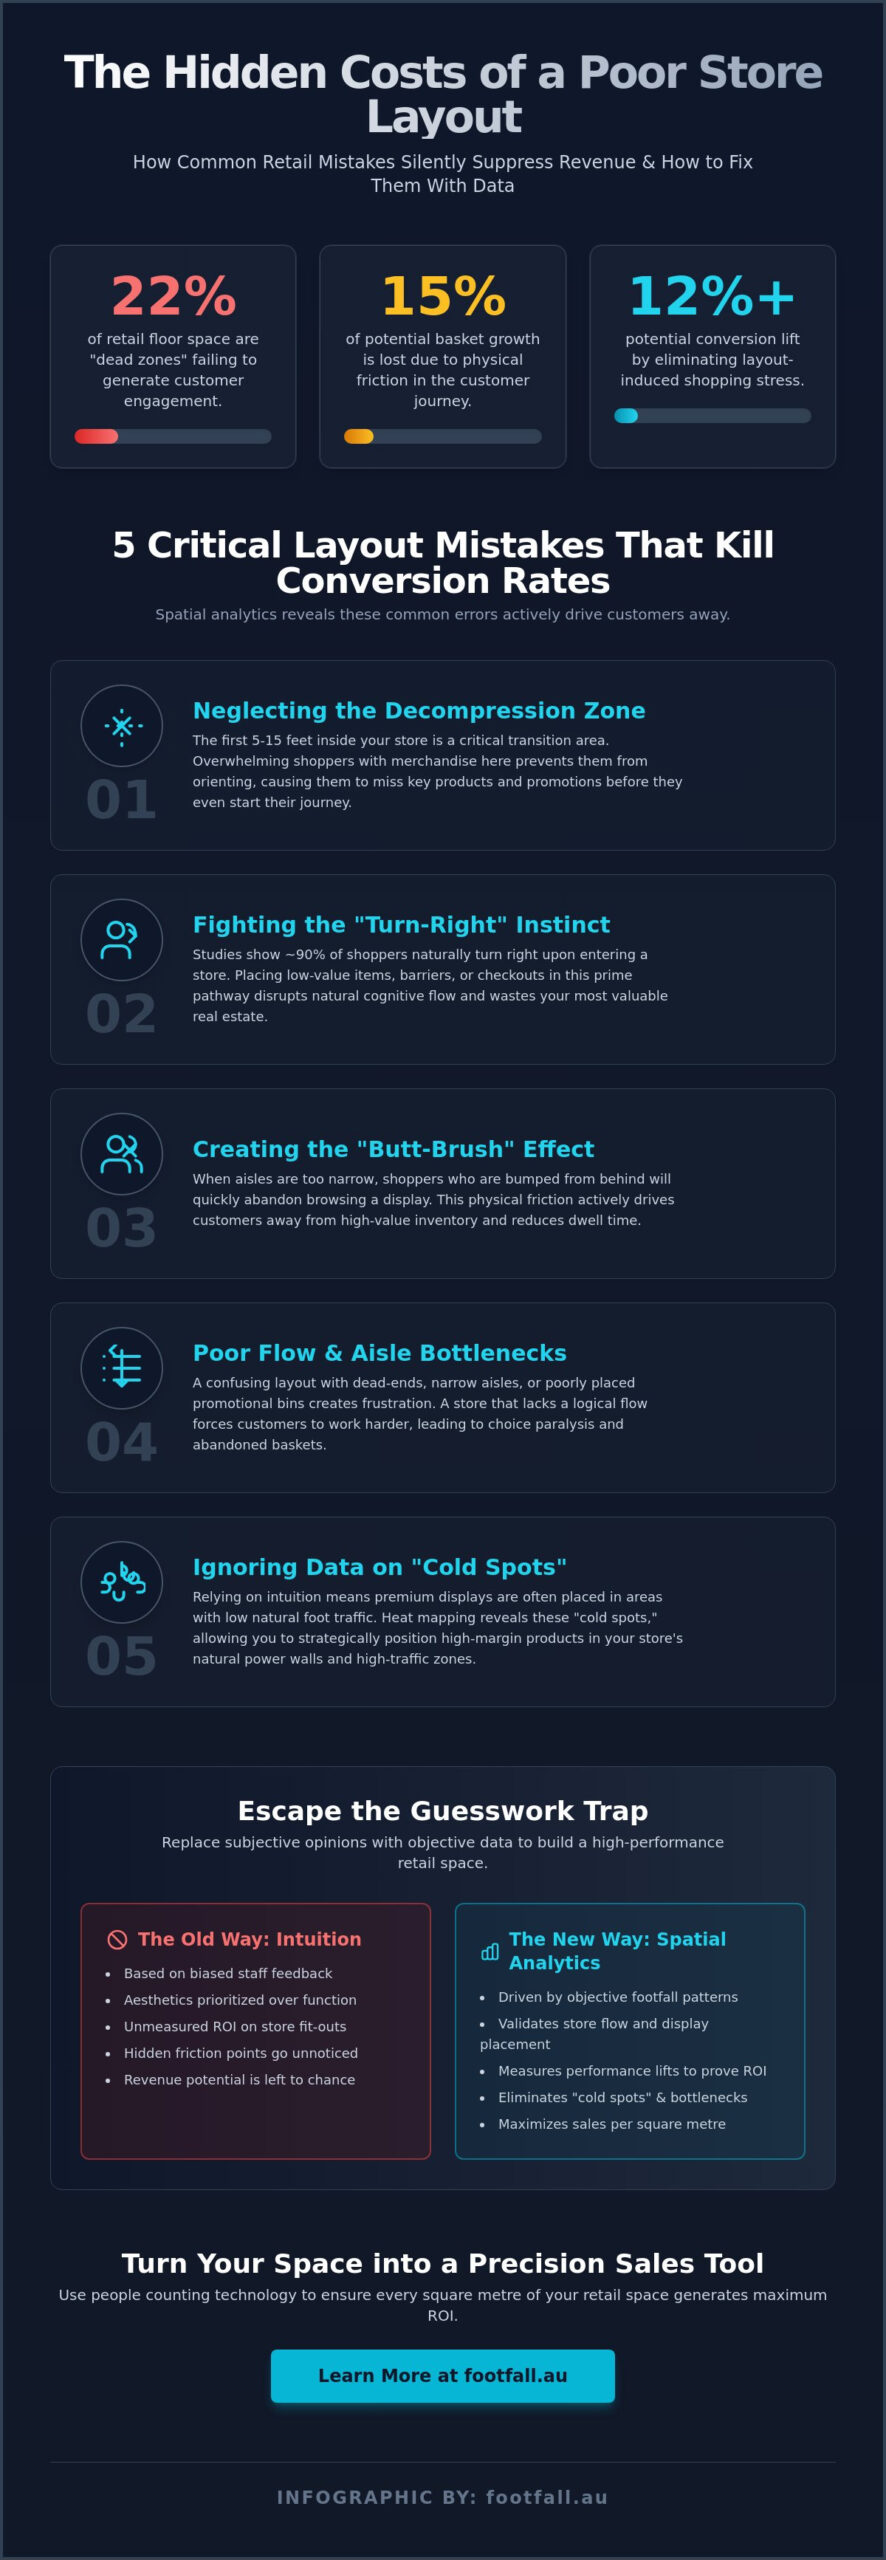
Spatial analytics studies from 2024 across the Australian market show that 22% of retail floor space often consists of “dead zones” that fail to generate engagement despite high store entry counts. You likely recognize the tension of managing a store that feels busy yet fails to meet conversion targets. It’s frustrating to witness peak-hour congestion at the checkout while your premium displays remain ignored; suggesting your floor plan might be working against your staff rather than supporting them. You don’t need to rely on intuition when data suggests that many Australian retailers lose 15% of potential basket growth simply because the visitor journey is interrupted by physical friction.
This guide identifies how to use professional footfall analytics to pinpoint and rectify the common retail layout mistakes to avoid that suppress your revenue potential. We’ll move beyond guesswork to focus on the human behavior behind the numbers. You’ll gain a data-driven framework to eliminate friction, increase dwell time, and provide the hard evidence needed to justify layout investments to stakeholders for the 2026 retail cycle. By the end of this article, you’ll have the intelligence required to transform your physical space into a high-precision sales tool.
Key Takeaways
- Quantify the “invisible cost” of poor floor plans by identifying how hidden spatial errors directly suppress your conversion rates and dwell times.
- Identify the most common retail layout mistakes to avoid, from mismanaging the vital decompression zone to fighting the natural “turn-right” instinct of Australian shoppers.
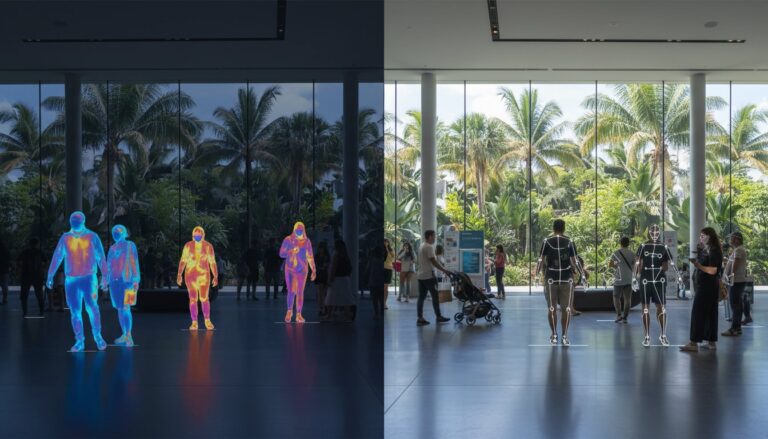
- Transition from subjective visual merchandising to evidence-based layouts by using people counting technology to validate store flow and display placement.
- Master spatial analytics through heat mapping to eliminate “cold spots” and strategically position high-margin products in your store’s natural high-traffic zones.
- Leverage precision hardware like the FootfallCam Pro2 to turn raw visitor movement into actionable insights, ensuring every square metre of your retail space generates maximum ROI.
The Impact of Poor Retail Layout on Business Performance
Retail layout represents the strategic orchestration of physical space to guide customer movement and influence purchasing decisions. It’s the silent salesperson of your store. When executed poorly, the “Invisible Cost” manifests as stagnant dwell times and abandoned baskets. Identifying common retail layout mistakes to avoid is the first step toward recovering this lost revenue. Traditional retailers often rely on “intuitive” design, but 2026 demands a shift toward spatial management backed by hard evidence. Modern tools like people counting technology now reveal the performance gaps that were previously hidden from view.
Poorly planned spaces do more than just look cluttered; they actively repel foot traffic. A store that lacks a logical flow forces customers to work harder to find what they need. This friction quickly erodes the shopping experience. By using data to map the visitor journey, businesses can transform their floorplan from a static asset into a dynamic driver of growth. Precision in spatial planning ensures that every square metre of your Australian retail footprint contributes to the bottom line.
The Relationship Between Layout and Conversion Rates
Physical friction points, such as narrow aisles or poorly placed promotional bins, create psychological barriers for shoppers. A confusing store journey leads to choice paralysis, where customers exit without buying anything. Retailers must understand that layout is a direct lever for sales. In a retail context, Conversion Rate is the percentage of total store visitors who complete a purchase during their visit. Eliminating layout-induced stress can lift this metric by 12% or more in competitive Australian shopping environments. When shoppers move through a space with ease, they’re more likely to engage with products and spend more time browsing.
Why Guesswork is the Greatest Risk to Retailers
Relying on anecdotal feedback from floor staff is a high-risk strategy for any business owner. Their observations are often limited to peak periods and lack the longitudinal depth of automated sensor data. This is one of the most common retail layout mistakes to avoid because it prioritises subjective opinion over objective reality. Sometimes, a beautiful store layout actually blocks natural traffic flow, creating bottlenecks that frustrate visitors.
- Staff feedback is often biased by recent interactions rather than total daily trends.
- Aesthetic improvements don’t always equate to functional efficiency.
- Without a baseline, you can’t measure if a renovation actually worked.
Retailers must establish a baseline measurement of current footfall patterns before making any structural changes. This ensures that every A$10,000 spent on a store fit-out translates into measurable growth rather than just visual appeal. Data provides the clarity needed to make bold decisions with confidence. It replaces “we think” with “we know,” allowing for a more resilient business model.
5 Critical Retail Layout Mistakes That Kill Conversion Rates
Designing a physical store requires a balance between aesthetics and spatial logic. Many retailers rely on intuition, yet data from 2024 suggests that even minor friction in movement can reduce sales by up to 15%. Identifying common retail layout mistakes to avoid is the first step toward reclaiming lost revenue. These errors often stem from a lack of understanding regarding how humans naturally navigate physical environments.
One frequent error involves fighting the natural “turn-right” instinct. Global studies indicate that approximately 90% of customers automatically turn right upon entering a shop. Retailers who place barriers or counter-intuitive displays in this path disrupt the shopper’s cognitive flow. This misalignment forces customers to make conscious decisions about movement rather than focusing on products, which often leads to shorter visit durations. Similarly, the “Butt-Brush” effect remains a significant deterrent. Shoppers, especially in high-end Australian boutiques, will abandon a display if they are bumped from behind. Narrow aisles don’t just feel cramped; they actively drive customers away from high-value inventory.
The Decompression Zone and the First Impression
The first three metres of your store constitute the Decompression Zone. This is where customers transition from the fast pace of the street to the deliberate pace of shopping. Placing critical signage or expensive promotional bins here is one of the most common retail layout mistakes to avoid. Shoppers typically ignore everything in this zone as their eyes adjust to the new lighting and atmosphere. Effective layouts keep this area open and clear, allowing the visitor to scan the entire floor before committing to a path. A welcoming, unobstructed threshold encourages deeper entry and increases the likelihood of a full store circuit.
Dead Zones and the “Cold Spot” Problem
Every store has areas where engagement drops significantly, often referred to as “Cold Spots.” Modern retail footfall analysis Australia shows that back corners and narrow alcoves frequently suffer from zero engagement. These dead zones represent wasted rent and lost opportunity. You can combat this by “anchoring” the rear of the store with essential items, such as fitting rooms or popular staples, to pull traffic through the entire space. Using high-contrast lighting and bold vertical signage can also signal to the customer that there is more to discover, effectively turning a cold spot into a high-dwell area.
Checkout placement also plays a vital role in conversion. If the point-of-sale is invisible, customers feel anxious; if it creates a bottleneck near the entrance, it discourages new visitors from entering. Position your counters at a natural stopping point that doesn’t obstruct the main thoroughfare. By optimising your floor plan through evidence-based adjustments, you ensure that every square metre of your Australian retail space contributes to your bottom line.
Why Visual Merchandising Fails Without Footfall Data
Visual merchandising often falls into the trap of prioritizing “the look” over “the flow.” A beautiful display that blocks a primary thoroughfare is a liability, not an asset. Retailers must move beyond subjective gut feelings about what looks good. High-performance people counting technology provides the objective evidence needed to validate these creative choices. It transforms a visual display from a static art piece into a measurable touchpoint in the customer journey. By integrating sensors, you see exactly how bodies move around your curated spaces.
One of the most critical metrics is the “Attraction Rate.” This measures the percentage of passers-by who actually stop at a display. If 1,000 people walk past a window but only 20 pause, your attraction rate is 2%. This data exposes one of the common retail layout mistakes to avoid: investing heavily in high-cost visuals that fail to break the customer’s stride. You must distinguish between a “popular” display and an “effective” one. A popular display might attract a crowd that creates a bottleneck, preventing others from entering the store. An effective display maintains a steady flow while successfully converting browsers into active shoppers.
Measuring Display Effectiveness
Dwell time is the primary indicator of engagement. If a customer lingers for more than 45 seconds without interacting with a product, the display is likely confusing rather than engaging. Use A/B testing to refine your layout. Change one variable, such as the height of a shelf or the intensity of a spotlight, and measure the resulting footfall shift. In 2024, Australian retail benchmarks showed that data-led layout adjustments can increase department-level conversion by up to 14%. Successful managers use this spatial intelligence to link display engagement directly to final purchases at the POS.
The Danger of Overcrowding Displays
Overcrowding leads to “Visual Noise.” This is the threshold where customers stop processing product information because there’s too much to take in. It creates cognitive fatigue. Spatial data helps you find the “sweet spot” for product density by monitoring how long people stay in high-density areas versus open ones. Identifying these common retail layout mistakes to avoid is easier when you understand the power of negative space. Premium brands in Sydney and Melbourne often use 30% to 40% empty space to increase the perceived value of luxury items. Negative space isn’t wasted space; it’s a strategic tool that guides the eye and reduces the stress of choice.
How to Audit and Optimise Your Store Flow Using Spatial Analytics
Retailers often rely on intuition to design their floor plans. This subjective approach leads to common retail layout mistakes to avoid, such as dead zones that swallow inventory or cramped aisles that drive customers away. Spatial analytics replaces these guesses with precision. To transform your store into a high-performing environment, follow this five-step audit process.
- Step 1: Establish a Footfall Baseline. You must understand exactly how many people enter your store and their primary entry patterns. This data serves as the control group for every layout change you make.
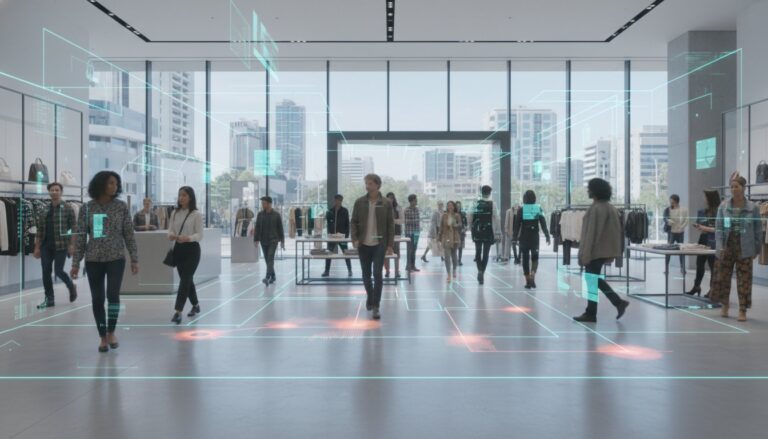
- Step 2: Implement Heat Mapping. Use AI-powered sensors to identify high-traffic “hot spots” and neglected “cold spots.” If a high-margin display is sitting in a cold spot, it’s effectively invisible to your customers.
- Step 3: Correlate Traffic with POS Data. High traffic in an aisle with low sales suggests a pricing or merchandising issue. Conversely, low traffic indicates a layout failure. This correlation reveals your true conversion rate by zone.
- Step 4: Make Incremental Adjustments. Don’t overhaul the entire store at once. Move one display or widen one aisle based on a data-backed hypothesis.
- Step 5: Monitor the “After” Data. Track the impact for at least 14 days. If the change didn’t improve dwell time or sales, revert and try a different configuration.
Spatial analytics allows you to identify and rectify common retail layout mistakes to avoid, ensuring every square metre of your floor plan generates measurable value.
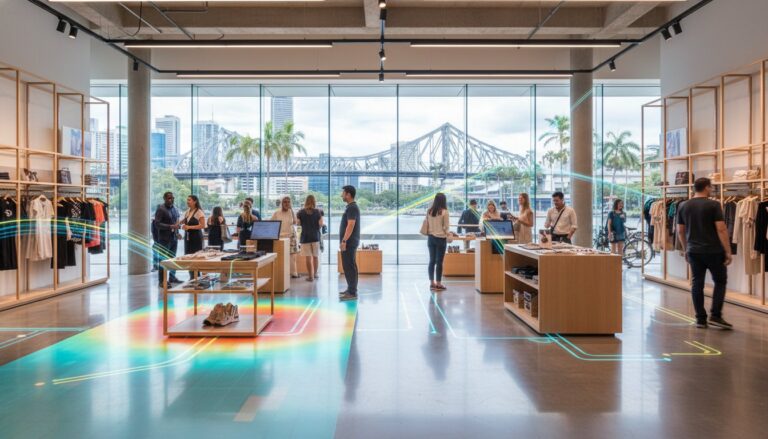
Utilising Heat Maps for Precision Layouts
AI-powered sensors generate visual representations of customer movement, highlighting where shoppers dwell and where they rush. These maps reveal bottlenecks where customers get stuck and frustrated. In a 2024 analysis of Australian apparel stores, 18% of shoppers abandoned their journey due to aisle congestion. By identifying these friction points, you can reconfigure shelving to ensure a seamless flow and place high-margin products in verified high-traffic zones.
Staffing for Your Layout, Not Just Your Hours
Layout mistakes often create service gaps in specific parts of the store. If your data shows a surge of activity in the rear-left corner at 2:00 PM on Saturdays, but your staff is concentrated at the front, you’re losing sales opportunities. Use footfall data analysis to place team members exactly where the traffic is heaviest. This ensures your checkout is appropriately staffed during real-time surges, preventing the long queues that account for a 12% drop in customer satisfaction in major Australian retail hubs.
Eliminating Guesswork with Footfall Australia’s Counting Solutions
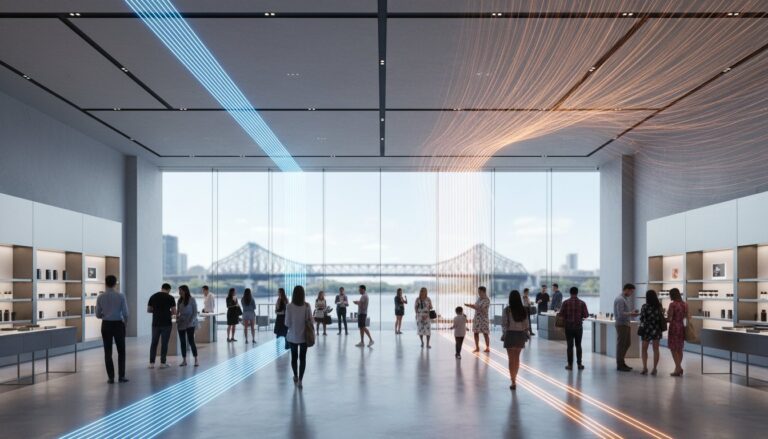
Retailers often rely on gut feeling when designing floor plans, yet intuition is rarely a substitute for evidence. This reliance on guesswork is why many businesses fall into the common retail layout mistakes to avoid that stifle growth and lower conversion rates. Footfall Australia provides the technological clarity required to see how customers actually navigate your space. The FootfallCam Pro2 has emerged as the gold standard for Australian retail analytics, delivering 99.5% accuracy in diverse environments, from high-ceiling flagship stores to compact boutique entries.
The hardware achieves its full potential through a seamless integration with the V9 analytics software. This combination allows managers to visualize dwell times, heatmaps, and zone engagement within a single, intuitive interface. This setup transforms raw foot traffic into actionable spatial intelligence. Unlike subscription-heavy competitors, Footfall Australia offers a perpetual licensing model. This means your business gains a permanent asset with no recurring software fees, supported by a local team of experts who understand the specific nuances of the Australian commercial landscape. We act as a smart strategist partner, helping you turn data into long-term operational efficiency.
Why the FootfallCam Pro2 is the Right Choice
Precision is the foundation of any successful retail strategy. The Pro2 utilizes 3D stereoscopic vision combined with AI-based person tracking to filter out non-human objects and distinguish between staff and shoppers. This ensures your conversion metrics aren’t inflated by your own team’s movements. Security is equally paramount. The device follows a “Privacy by Design” philosophy, ensuring compliance with local Australian regulations and international GDPR standards. It processes all data at the edge, meaning no personal video ever leaves the sensor. Detailed technical specifications are available in the FootfallCam Pro2 buying guide for businesses ready to invest in high-fidelity data.
Taking the First Step Toward a Data-Driven Store
Identifying common retail layout mistakes to avoid requires a baseline of reliable numbers. Footfall Australia facilitates this through professional audits of current counting systems, highlighting where legacy tech might be failing you. For businesses burdened by inaccurate infrared beams or basic CCTV counters, the “Legacy Swap Out Plan” offers a streamlined transition to modern 3D sensors. This upgrade provides the spatial intelligence needed to optimize staff scheduling and merchandise placement. To secure a competitive advantage in 2026, contact Footfall Australia for a tailored retail analysis solution and start making decisions backed by hard evidence.
Future-Proof Your Floor Plan with Precision Analytics
Winning in the 2026 retail landscape requires a shift from guesswork to evidence-based strategy. You’ve seen how poor store flow stifles conversion rates and why visual merchandising fails when it isn’t backed by hard visitor data. Identifying and correcting common retail layout mistakes to avoid is no longer a matter of intuition. It’s about leveraging high-resolution spatial analytics to decode the human narrative within your store.
Footfall Australia provides the technological eyes your business needs to thrive. Our FootfallCam Pro2 sensors deliver 99.5% accuracy even in complex, high-traffic environments. We pair this hardware with AI-driven spatial analytics to provide deep insights into the visitor journey, supported by a national network of expert installers across Australia. By transforming raw foot traffic into actionable intelligence, you can optimise every square metre of your floor plan for maximum impact.
Maximise your retail ROI with Footfall Australia’s precision counting systems
It’s time to turn your store into a high-performing asset that anticipates every customer move.
Frequently Asked Questions
What is the most common retail layout mistake for new businesses?
The most common error is neglecting the decompression zone by placing high-demand items or bulky signage too close to the entrance. Data shows that 90% of customers instinctively turn right upon entering a store, so crowding the first 3 metres creates a bottleneck that discourages natural flow. Avoiding these common retail layout mistakes to avoid ensures shoppers transition comfortably from the street, which increases the likelihood of a full store circuit.
How does store layout affect customer dwell time?
Store layout directly dictates dwell time by controlling the pace and path of the visitor journey. A 2023 industry report found that increasing dwell time by just 1% can result in a 1.3% lift in total sales. By using a loop or racetrack layout, you encourage visitors to pass more merchandise. This naturally extends their stay compared to a standard grid system that prioritises quick exits and task-oriented shopping.
Can people counters help identify dead zones in my store?
People counters equipped with spatial analytics identify dead zones by tracking the precise movement and stationary time of every visitor. If your data shows that 40% of your floor space receives less than 5% of total foot traffic, you’ve identified a cold spot. These actionable insights allow you to reposition displays or adjust lighting to reclaim underperforming areas and improve your overall revenue per square metre.
Is it expensive to install a professional people counting system in Australia?
Installing a professional people counting system in Australia is a scalable investment tailored to your specific business size. While enterprise-grade AI sensors require an initial hardware outlay, the ROI is often realised within 6 months through optimised staffing and improved conversion rates. Australian retailers typically choose between subscription-based models or outright hardware purchases, with costs varying based on the number of entrances and required data granularity.
How often should I change my retail store layout?
You should review your retail store layout every 3 to 6 months based on seasonal shifts and performance data. Analysis of 2024 retail trends shows that stores refreshing their visual merchandising at least four times a year maintain higher engagement levels. Use your footfall data to identify when heat maps start to stagnate. This indicates that regular customers have become habituated to the current path and are ignoring secondary displays.
What is the “decompression zone” in retail design?
The decompression zone is the critical space immediately inside the entrance, typically spanning the first 1.5 to 4.5 metres of the store. This area allows shoppers to adjust to the lighting, temperature, and atmosphere of your brand. Failing to respect this space is one of the common retail layout mistakes to avoid, as customers usually overlook anything in this zone while they mentally transition into shopping mode.
How do I calculate my store’s sales conversion rate accurately?
Calculate your store’s sales conversion rate by dividing the total number of transactions by the total footfall recorded by your people counter during the same period. If 1,000 people enter your store and 250 make a purchase, your conversion rate is 25%. Accurate data is vital because relying on transaction counts alone ignores the 75% of visitors who left without buying, which represents your biggest growth opportunity.
Will a people counter work in a store with very high ceilings?
Modern AI-driven people counters work effectively in stores with high ceilings, with industrial-grade sensors maintaining 98% accuracy at heights up to 12 metres. These devices use advanced 3D stereoscopic technology or Time-of-Flight sensors to distinguish between humans and objects regardless of the mounting height. This ensures that large-format Australian retailers or showrooms with vaulted ceilings still receive precise, reliable data to inform their spatial analytics strategy.