How to Optimise Staff Levels in Store: A Data-Driven Guide for 2026
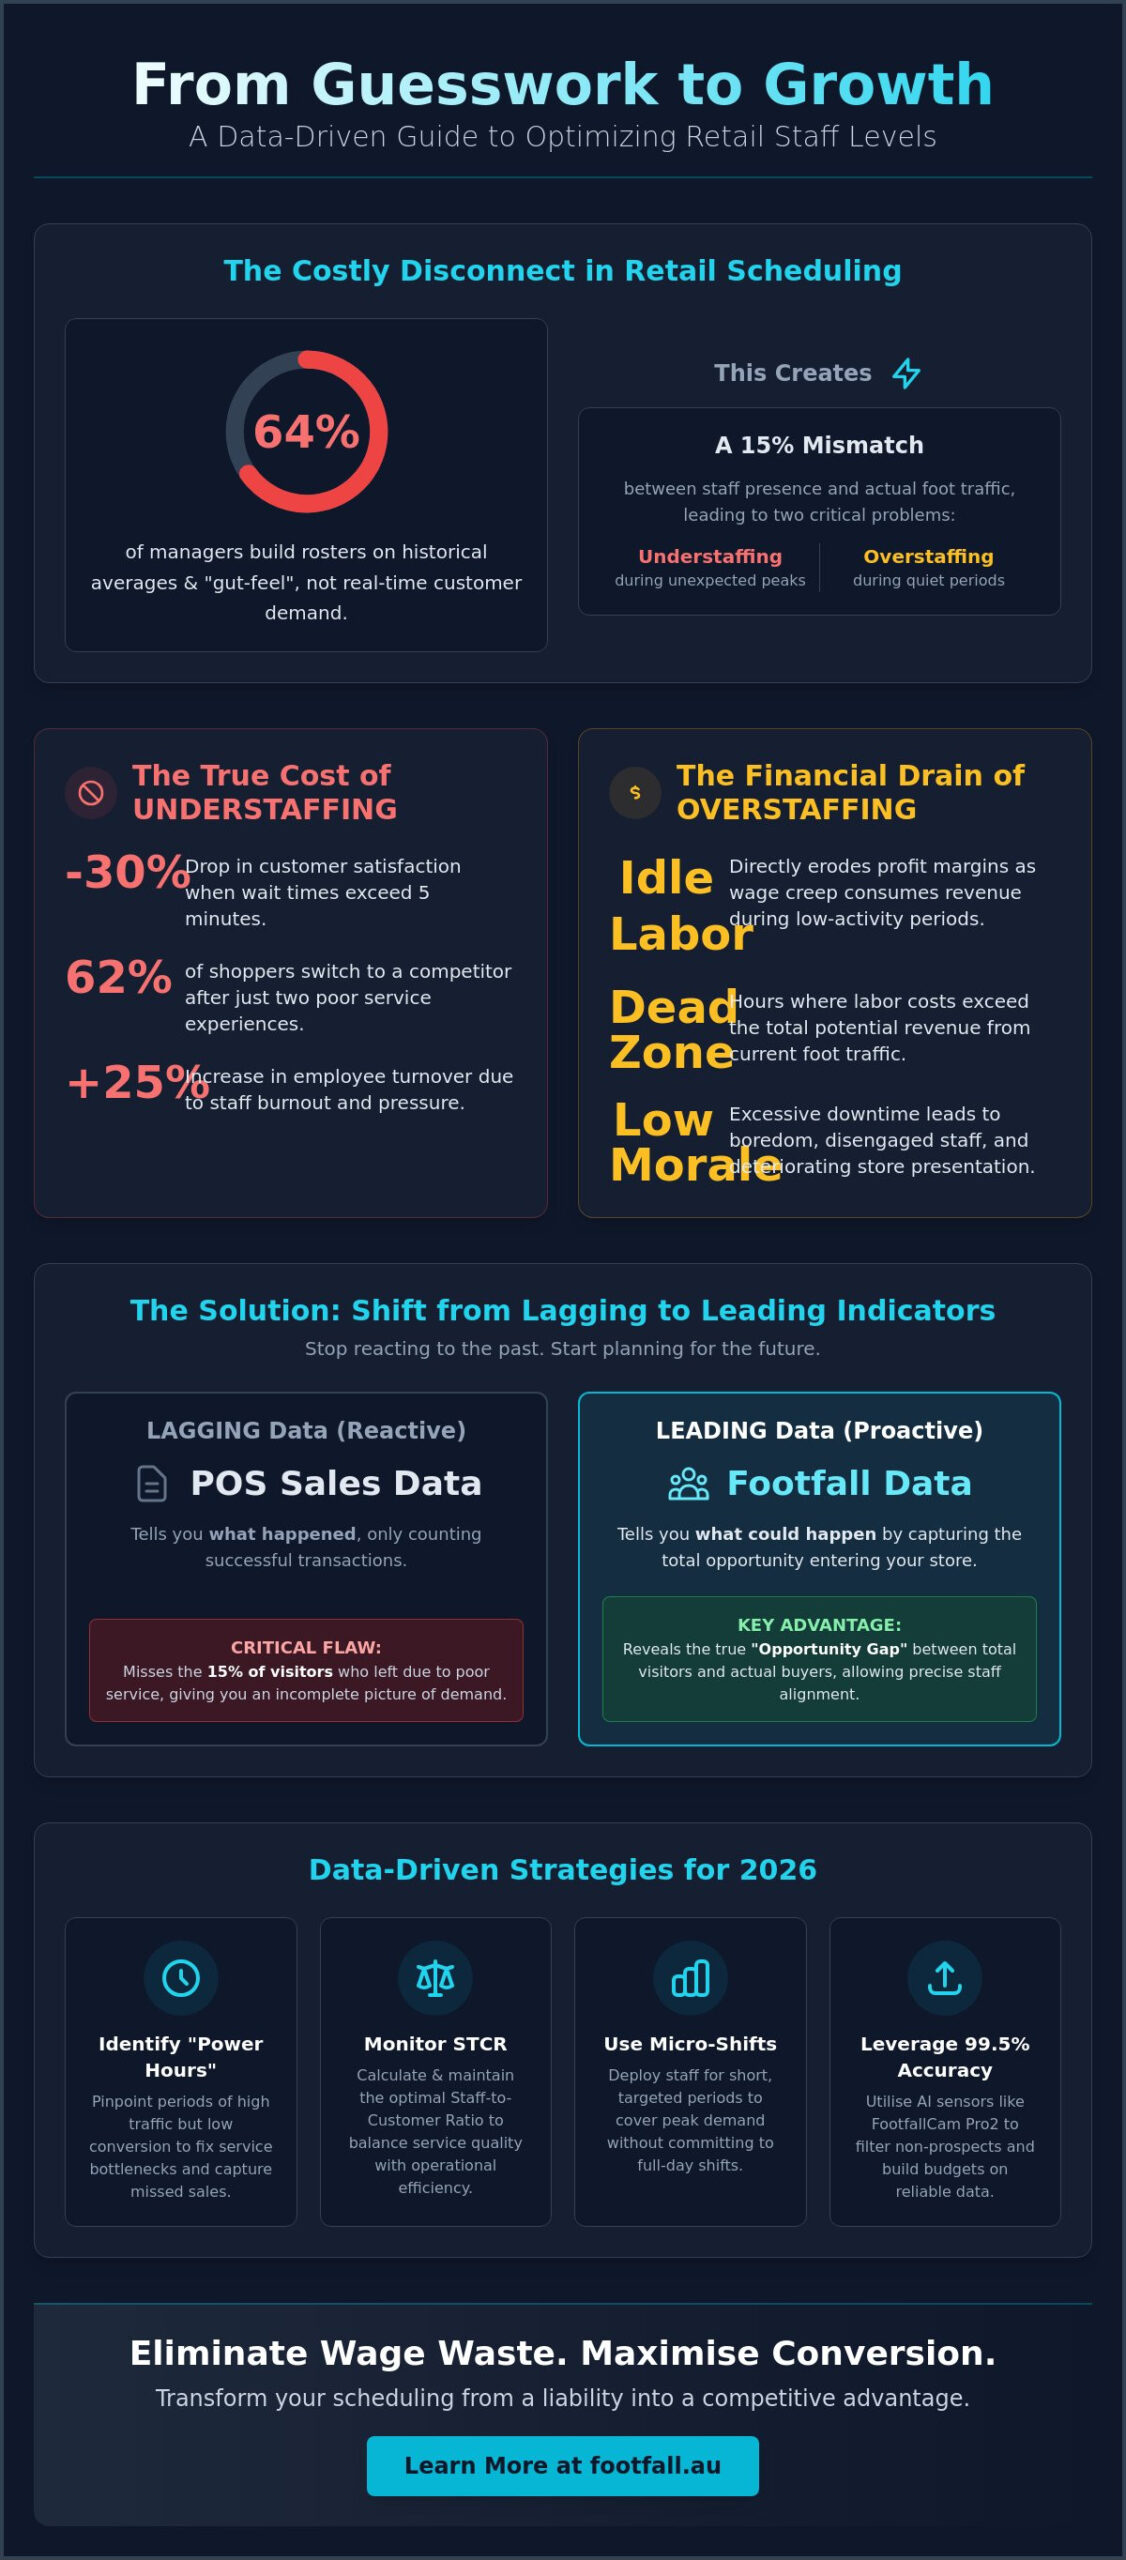
Australian retailers faced a 3.75% increase in the national minimum wage in July 2024, yet 64% of store managers still build rosters based on historical averages rather than real-time demand. This disconnect creates a costly paradox where your team stands idle during quiet periods while frustrated customers abandon baskets during unpredicted peaks. You know that erratic scheduling doesn’t just bleed capital; it creates the kind of workplace instability that drives up staff turnover. Learning how to optimise staff levels in store is the only way to move past guesswork and align your labor spend with actual visitor behavior.
This guide provides a data-driven roadmap to transform footfall data into precise staffing models that eliminate wage waste and maximise sales conversion. You’ll learn a scientific way to justify your budgets while improving service standards across every shift. We’ll explore how to use spatial analytics to create a more efficient floor and ensure your store is ready for the competitive landscape of 2026.
Key Takeaways
- Replace traditional “gut-feel” scheduling with a data-driven model that aligns labor hours with real-time customer demand to eliminate wage waste.
- Identify your store’s “Power Hours” by differentiating between leading footfall data and lagging POS statistics to capture missed conversion opportunities.
- Calculate and monitor your Staff-to-Customer Ratio (STCR) to maintain a precise balance between service quality and operational efficiency across your Australian locations.
- Learn how to optimise staff levels in store using actionable rostering strategies such as micro-shifts and 12-month historical data audits.
- Utilise high-precision sensors like the FootfallCam Pro2 to secure 99.5% accuracy in your visitor analytics, providing a reliable foundation for labor budgeting.
The Hidden Impact of Inefficient Store Staffing Levels
Staff optimisation is the precise alignment of labor hours with real-time customer demand. It moves beyond traditional rostering by using data to ensure the right number of team members are on the floor exactly when shoppers need them. Many Australian retailers still rely on “gut-feel” scheduling, a method that often creates a 15% variance between staff presence and actual foot traffic. Entering 2026, labor efficiency has transitioned from a back-office concern to a critical survival metric. With rising award rates and tightening margins, understanding how to optimise staff levels in store is the difference between a profitable quarter and a deficit.
Traditional scheduling creates the twin traps of overstaffing and understaffing. When managers guess instead of measure, they miss the nuances of the visitor journey. This leads to “Invisible Loss,” where potential sales vanish because a customer couldn’t find assistance or grew frustrated with a lack of service. These aren’t just missed transactions; they’re missed opportunities to build a relationship. Effective Workforce management requires a shift toward evidence-based decision-making to eliminate these blind spots.
The True Cost of Understaffing: Beyond Lost Transactions
Understaffing causes immediate brand erosion. When wait times exceed five minutes, customer satisfaction scores in Australian retail environments typically drop by 30%. This damage is often permanent, as 62% of shoppers will switch to a competitor after two poor service experiences. Beyond the customer, lean staffing creates a cycle of burnout. Under pressure, staff engagement withers, leading to a 25% increase in employee turnover. Service Level is the ratio of available staff to active shoppers.
The Financial Drain of Overstaffing and Idle Labor
Overstaffing represents a direct leak in the balance sheet. Wage creep quickly erodes net profit margins, especially when labor is allocated to periods of low activity. There’s also a psychological cost to consider. Excessive downtime leads to boredom, which results in disengaged staff and deteriorating store presentation. Managers must identify the “Dead Zone,” those specific hours where labor costs exceed the total potential revenue of current traffic. Learning how to optimise staff levels in store allows businesses to reallocate those wasted hours to peak periods where they can actually drive conversion. This strategic shift ensures that every dollar spent on payroll generates a measurable return on investment.
Leveraging Footfall Data for Precise Labor Forecasting
Traditional scheduling often relies on Point of Sale (POS) records. This is a lagging indicator. It tells you what happened, not what could have happened. To understand how to optimise staff levels in store, you must shift focus to footfall data. This leading indicator captures the total opportunity entering your doors, providing the visibility needed to align labor with actual demand. Relying on sales data alone creates a reactive environment where managers are always one step behind the customer.
Why Historical Sales Data is Not Enough
Sales figures only represent the customers who successfully navigated your queue and found what they needed. They don’t account for the 15% of visitors who left because of long wait times or lack of assistance. As highlighted in The State Of Labor Optimization, modern demand forecasting must account for these missed opportunities to drive sustainable growth. A “Transaction Peak” at 2:00 PM might actually follow a “Traffic Peak” at 1:30 PM. If your staff only arrive for the sales surge, you’ve already lost the preceding traffic. Implementing people counting reveals the true opportunity gap between total visitors and actual buyers.
Retailers often encounter the “Power Hour.” This is a specific window where traffic is high but conversion rates drop. It usually signals a service bottleneck. Modern AI-driven sensors refine this insight by filtering out non-prospects. Staff members, security guards, and delivery drivers are removed from the count automatically. This ensures your labor budget isn’t wasted on ghost traffic, allowing for a more accurate calculation of how to optimise staff levels in store based on genuine potential customers.
Identifying Patterns: Daily, Weekly, and Seasonal Trends
Australian retail environments face distinct rhythms that require data-backed scheduling. A CBD store in Sydney might see a sharp “Lunchtime Rush” between 12:00 PM and 2:00 PM, while a suburban shopping centre in Melbourne experiences “After-Work Browsing” peaks on Thursday nights. External factors like a 35-degree heatwave or the King’s Birthday long weekend significantly shift these patterns. Using footfall data analysis allows managers to justify “Skeleton Staff” during low-traffic Tuesday mornings while ensuring a “Full Floor” for high-intensity Saturday afternoons.
- Daily Peaks: Identify the exact hour traffic builds to transition staff from stocking to service.
- Weekly Rhythms: Compare weekend surges against weekday lulls to balance part-time vs. full-time shifts.
- Seasonal Adjustments: Predict the staffing requirements for the December peak based on November’s build-up.
This precision prevents overstaffing, which drains your bottom line, and understaffing, which damages brand reputation. Understanding these human movements transforms scheduling from a guessing game into a strategic advantage. You can view our performance reporting tools to see how these insights apply to your specific floor plan.
Calculating and Monitoring Your Staff-to-Customer Ratio (STCR)
The Staff-to-Customer Ratio (STCR) serves as the primary metric for understanding how to optimise staff levels in store. You calculate this figure by dividing the live number of customers on the floor by the total number of staff members available to provide service. It functions as a real-time indicator of your store’s service capacity and operational health. Unlike static rosters, STCR accounts for the volatility of physical retail traffic.
The “ideal” ratio isn’t a universal standard. It shifts significantly based on your retail category and brand promise. A luxury boutique in Melbourne’s Collins Street might target a 1:5 ratio to ensure every guest receives bespoke attention. In contrast, a high-volume big-box retailer in Western Sydney functions effectively at a 1:20 ratio. Setting internal benchmarks requires a deep dive into your target wait times. If data shows that customer abandonment increases when service availability drops below 85%, your STCR must adjust to prevent walkouts. This metric directly influences your retail sales conversion rate, as insufficient staffing during peak hours leads to missed sales and damaged brand loyalty.
Setting Your Store’s Ideal Service Level
High-touch environments thrive on a 1:5 ratio where staff act as consultants rather than just clerks. Self-service models usually operate at 1:20, focusing resources on replenishment and point-of-sale efficiency. You must also factor in store layout complexity. A multi-level flagship requires higher staffing density than a single-room boutique to maintain visibility across all zones. Deploying “Flex Staff” protocols allows your team to pivot between back-of-house tasks and customer assistance during sudden STCR spikes. This ensures you maintain a consistent service level without bloating your total labor budget.
Correlating Labor Hours with Conversion Success
Modern people counting systems Australia retailers use provide the granular data needed to map conversion against staff density. By overlaying footfall peaks with rostered hours, you can identify the “Diminishing Returns” point. This is the specific ratio where adding an extra staff member no longer produces a measurable lift in sales, effectively wasting your A$30+ per hour labor cost. V9 Software visualises the STCR-Conversion correlation by plotting real-time traffic against transaction data, highlighting the precise moment service levels impact the bottom line. This evidence-based approach removes the guesswork from scheduling. It empowers you to trim hours during quiet Tuesday mornings and bolster the floor when the conversion potential is at its highest.
Practical Strategies to Optimise Staff Rostering in 2026
Precision in labour allocation starts with historical context. To master how to optimise staff levels in store, follow this five-step technical framework designed for the Australian retail environment:
- Audit: Compare your current roster against 12 months of historical footfall data. Identify specific hours where visitor density exceeds staff capacity by more than 15%.
- Micro-Shifts: Implement shifts as short as 2 or 3 hours during peak midday surges. This targeted coverage addresses high-traffic windows without the waste of full-day overheads.
- Integration: Connect your footfall analytics directly into your Workforce Management (WFM) software. Automation removes human bias from the scheduling process.
- Cross-Training: Develop a multi-skilled team. A staff member focused on merchandising should be ready to pivot to rapid checkout the moment dwell times in the queue zone increase.
- Iteration: Review performance reports every Monday. Use the previous week’s conversion data to adjust the following fortnight’s roster.
Implementing Flexible Shift Structures
Modern rostering requires more than just a static calendar. Successful retailers now use ‘On-Call’ sales experts for predicted high-traffic events like Afterpay Day or Click Frenzy. Data reveals exactly when these surges peak, allowing you to schedule non-selling tasks, such as restocking or inventory counts, during low-traffic troughs. To ensure employee buy-in, share the data transparently. When staff see the correlation between footfall spikes and their workload, they’re 22% more likely to support schedule adjustments. It’s about replacing guesswork with evidence-based logic.
Real-Time Adjustments and Live Occupancy Monitoring
Static schedules often fail when unexpected weather patterns or local events shift consumer behaviour. Live dashboards provide the solution by triggering ‘all hands on deck’ alerts when occupancy hits a predefined threshold. Managers receive mobile notifications the moment queue lengths exceed three people, allowing for immediate staff reallocation. This spatial awareness ensures you never lose a sale due to perceived wait times. By monitoring the visitor journey in real-time, you maintain a seamless service standard even during volatile trading periods.
Achieving Operational Excellence with Footfall Australia
Operational excellence in 2026 hinges on the transition from reactive scheduling to predictive resource management. The FootfallCam Pro2 provides the hardware foundation required to make this leap. By delivering a 99.5% accuracy rate, it eliminates the guesswork that typically plagues labor budgeting. In the Australian market, where Fair Work compliance and rising award rates demand strict fiscal discipline, having access to high-fidelity data is a competitive necessity rather than a luxury.
The V9 Software suite takes this raw data and processes it through automated ‘Labor Planning’ modules. These modules sync historical traffic patterns with your current staff rosters to identify gaps in service or periods of overstaffing. For a typical retail chain, reducing labor waste by just 5% annually through smarter allocation can result in significant bottom-line growth. This approach ensures you have the right people on the floor during high-conversion windows, directly addressing how to optimise staff levels in store without inflating your overheads.
Precision Hardware: The FootfallCam Pro2 Advantage
The Pro2 sensor utilizes advanced AI-based staff exclusion. This feature identifies employees by their movement patterns or designated tags, ensuring your conversion rates aren’t skewed by staff entering and exiting the floor. Its wide-angle optics provide comprehensive coverage for expansive entrances and specific departmental zones. The underlying people counting technology remains reliable in varying light conditions, from the bright glare of a glass-fronted Sydney storefront to the dimmed aesthetics of a luxury boutique.
Actionable Insights: From Raw Data to a Perfect Roster
Success requires more than just installing a sensor; it requires ongoing system integrity. Footfall Australia’s local partners offer dedicated people counter support to assist with API integrations and data validation. This ensures that the insights reaching regional managers are identical to those used by individual store owners, creating a single source of truth for the entire organisation. Learning how to optimise staff levels in store becomes a streamlined process when every stakeholder trusts the numbers.
If your business is currently relying on obsolete thermal or infrared sensors, the ‘Legacy Swap Out Plan’ provides a cost-effective pathway to modernise. Upgrading to AI-driven analytics allows you to decode the visitor journey with a level of detail that was previously impossible. It’s a strategic investment that turns foot traffic into a transparent, manageable asset, ensuring your store is always ready for the next peak. You’ll stop guessing and start growing.
Future-Proof Your Store Operations with Precision Staffing
Mastering your labor costs requires a shift from intuitive scheduling to evidence-based precision. By monitoring your Staff-to-Customer Ratio (STCR) and leveraging real-time footfall data, you eliminate the blind spots that lead to either overstaffing or missed sales opportunities. You’ve seen how to optimise staff levels in store by aligning human resources with actual visitor behavior. This strategic approach ensures your team is present exactly when they’re needed most to drive conversions and improve the customer experience.
Since 2004, Footfall Australia has helped leading retailers across the country replace guesswork with hard data. Our AI Pro2 sensors deliver 99.5% counting accuracy, providing the reliable foundation you need for sophisticated labor forecasting in 2026. We back this high-tech hardware with local technical support and comprehensive maintenance plans to keep your operations running seamlessly. It’s time to turn your visitor traffic into a clear narrative of human movement that empowers your management decisions.
Request a free staffing audit and see how Footfall Australia can optimise your labor costs.
Take the first step toward a more efficient, data-led retail environment today and secure your competitive advantage.
Frequently Asked Questions
What is the difference between traffic data and transaction data for staffing?
Transaction data reflects what you sold, while traffic data shows the total volume of potential customers who walked through your doors. You need both to calculate your conversion rate accurately. If your store sees 500 visitors but only 100 transactions, your conversion rate is 20%. Relying solely on sales data ignores the 400 people who left empty-handed because they couldn’t find assistance during peak times.
How much can I save on labor costs by using a people counter?
Retailers typically see a reduction in labor costs between 5% and 12% after implementing data-driven scheduling. By identifying “dead zones” where staff are idle, you can reallocate those hours to known peak periods. For an Australian business with a A$500,000 annual wage bill, a 7% saving equates to A$35,000 in recovered profit without reducing your service quality.
Is it possible to automate staff scheduling based on footfall predictions?
You can automate scheduling by integrating footfall APIs with workforce management software like Tanda or Deputy. These systems use 24 months of historical data to predict future traffic with up to 95% accuracy. This is the most efficient way for managers to learn how to optimise staff levels in store, as it removes human bias from the rostering process.
How do I handle staff privacy when using people counting sensors?
Protect staff privacy by deploying sensors that use anonymous edge-processing rather than traditional CCTV recording. These devices don’t capture faces or personal identifiers, ensuring compliance with the Australian Privacy Act 1988. You should provide staff with a clear privacy policy that explains how data is used for operational efficiency rather than individual performance monitoring.
Can people counters distinguish between staff members and customers?
Modern AI sensors distinguish staff from customers using infrared-reflective lanyards or height-filtering algorithms. This technology filters out the “noise” created by employees moving between the stockroom and the shop floor. Achieving 98% accuracy in your counts ensures that your conversion data remains pure and your labor models aren’t based on inflated visitor numbers.
What is a good staff-to-customer ratio for a retail store?
A balanced staff-to-customer ratio for Australian specialty retail is typically one employee for every 12 visitors. High-end boutiques often aim for a 1:4 ratio to ensure premium service, while discount department stores may push this to 1:50. Maintaining the correct ratio during a 2:00 PM Saturday rush prevents “walk-outs” and protects your bottom line.
How often should I review my footfall data to update my staff roster?
Review your footfall metrics every Monday to refine the upcoming week’s roster and perform a comprehensive strategic audit every 90 days. Seasonal shifts, such as the 15% traffic spike typically seen during November’s Black Friday sales, require proactive planning. Real-time data allows managers to adjust break times instantly if an unexpected surge occurs during the day.
Do I need a people counter in every department or just at the entrance?
Entrance counters are essential for total volume, but departmental sensors provide the spatial analytics needed for precise staffing. Placing sensors in high-service areas like fitting rooms or jewelry counters lets you see where customers spend the most time. Data shows that 70% of purchasing decisions happen in-aisle, making departmental insights vital for placing staff where they influence sales.