The Strategic Benefits of Footfall Data: A 2026 Guide for Australian Businesses
Why do some Australian retailers consistently hit their targets while others, despite high street traffic, struggle to explain a 12% dip in quarterly conversion rates? You’ve likely felt the frustration of a busy store floor that doesn’t translate to the till, or the sting of high labor costs during a quiet Tuesday afternoon. It’s a common challenge in a local market where every A$1 spent on overhead must justify itself through performance. To solve this, savvy leaders are leveraging the benefits of footfall data to eliminate the expensive blind spots that often drain a physical business’s bottom line. For those interested in how high-precision Australian manufacturing supports the retail landscape, check out Australian Made Vision.
This 2026 guide reveals how sophisticated analytics transform raw visitor numbers into actionable intelligence that drives revenue and operational efficiency. We’ll provide a clear framework for calculating ROI, improving conversion rates, and streamlining your operations based on factual peak hour data. You’ll learn exactly how to synchronize your staffing levels with real world demand to ensure your team is always positioned for success. It’s time to stop guessing and start growing with precision by decoding the human movement within your space.
Key Takeaways
- Transform raw visitor numbers into high-precision intelligence using AI-driven technology to decode the narrative of human movement within your space.
- Discover the strategic benefits of footfall data by using traffic as the essential denominator for calculating true retail conversion rates and identifying high-revenue “power hours.”
- Eliminate operational guesswork by aligning staffing levels and facility maintenance with actual visitor demand to drive cost efficiency across your Australian locations.
- Close the marketing attribution loop and enhance store layouts by measuring the draw rate of displays and using heatmaps to understand visitor dwell times.
- Learn how to implement a seamless data-to-decision pipeline using industry-standard hardware and software to turn spatial analytics into actionable growth strategies.
Understanding Footfall Data: Beyond Simple Headcounts
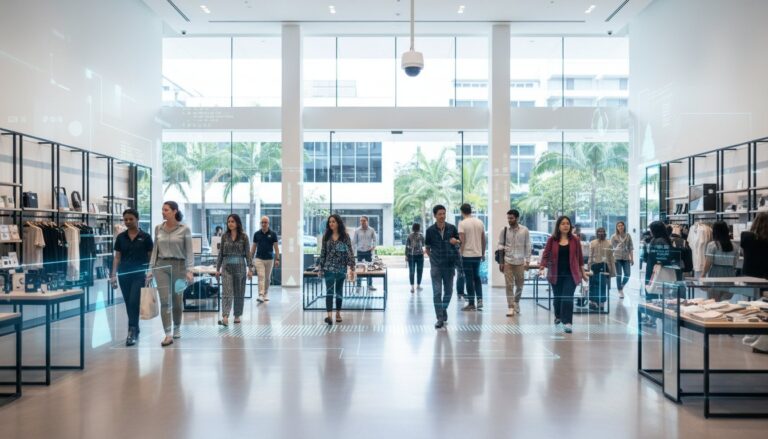
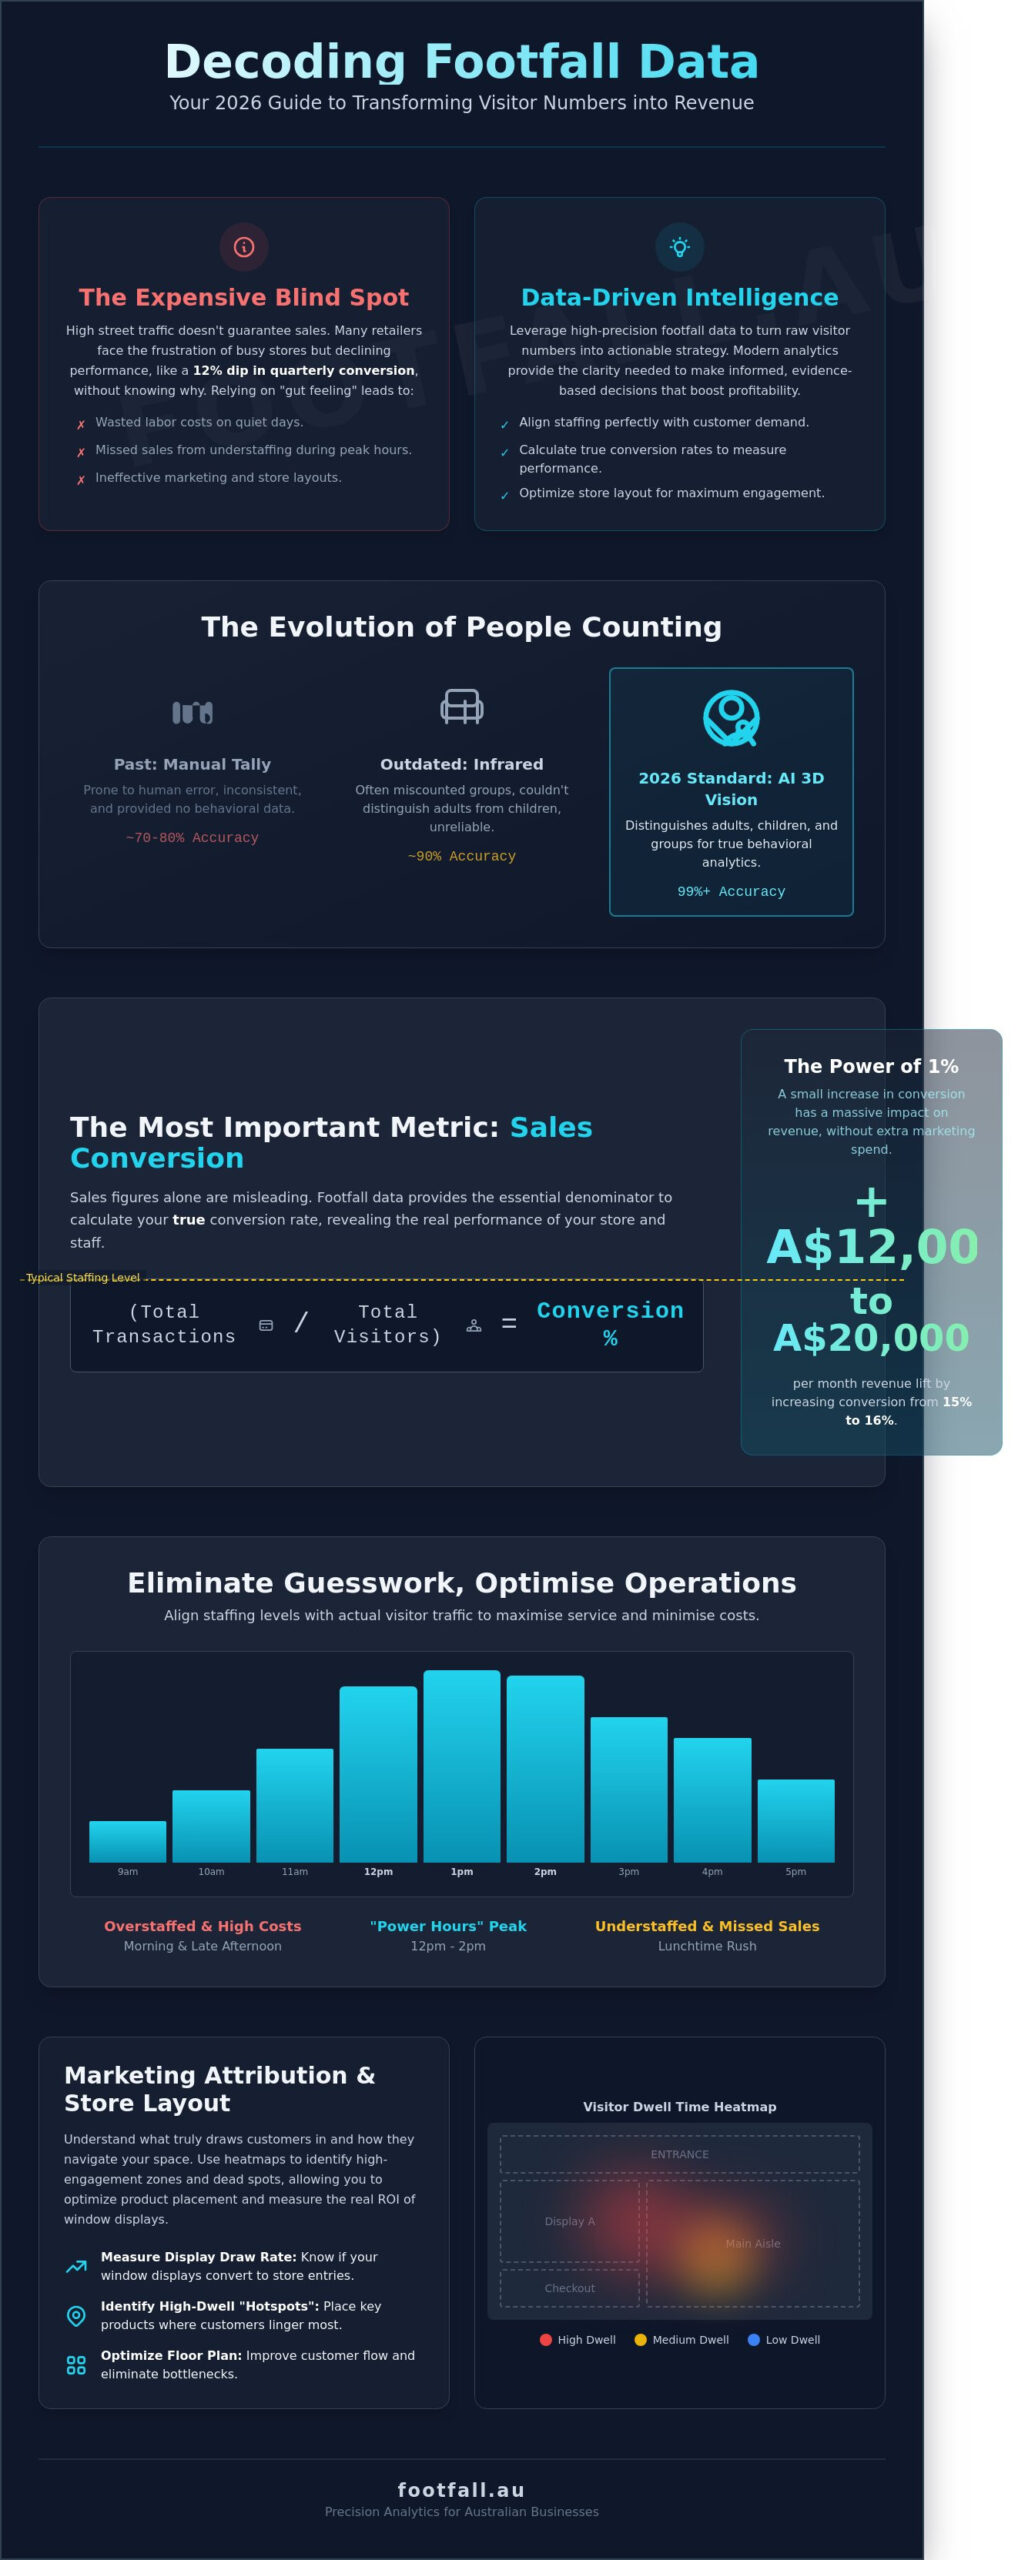
Footfall data represents the high-precision measurement of human movement and behavior within a physical environment. It has moved far beyond the era of staff members standing at entrances with manual tally counters. Modern Australian retailers and facility managers now leverage AI-driven people counting technology to capture granular insights that were previously invisible. One of the primary benefits of footfall data is its ability to transform raw volume into actionable intelligence. This shift allows businesses to move from reactive guessing to proactive strategy.
Numbers alone don’t tell the full story. For a data set to be truly useful, it must be contextualized against external variables. A sudden 15% dip in traffic at a Melbourne shopping centre might seem alarming until the data is layered with local weather reports showing a severe storm. High-integrity systems now deliver 99% accuracy or higher. This precision ensures that multi-million dollar leasing or staffing decisions rest on hard evidence. When accuracy drops even to 90%, the resulting data gaps can lead to thousands of dollars in wasted labor costs or missed sales opportunities.
What is Footfall Data in 2026?
In 2026, footfall data encompasses a multi-dimensional view of the physical space. It tracks entries and exits while identifying return visitors through sophisticated pattern recognition. We’ve moved past outdated infrared sensors that frequently miscounted groups as single units. Instead, 3D stereoscopic vision provides the depth perception required to distinguish between adults, children, and even shopping trolleys. This precision allows for a clear distinction between simple traffic volume and high-value behavioral analytics that define modern retail success.
From Observation to Intelligence
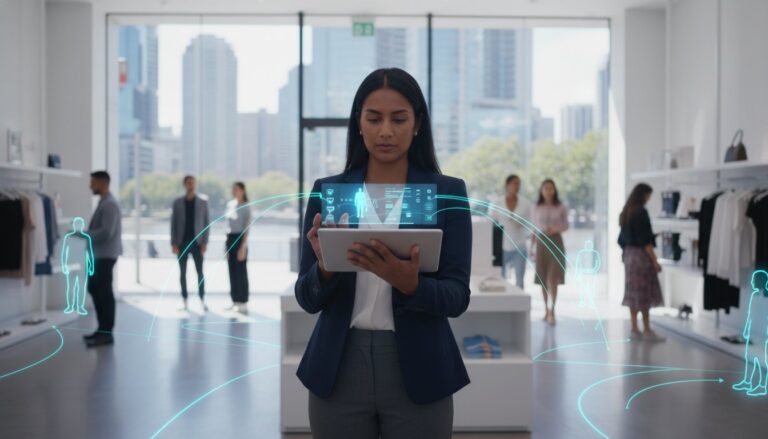
Smart management requires moving away from the “gut feeling” that has historically dominated retail operations. Real-time data access allows managers to make immediate adjustments. You can open new registers when queues peak or reallocate security during unexpected surges. Understanding the benefits of footfall data allows for a deeper analysis of the visitor journey. This treats movement not just as a statistic, but as a narrative. By decoding how people move from the storefront to the back aisles, businesses can optimize floor plans for maximum engagement. Evidence-based planning ensures every square metre of a facility serves a specific strategic purpose.
Quantifying Success: Conversion Rates and Performance Benchmarking
Sales figures alone tell a partial story. They represent the final result but ignore the scale of missed opportunities. One of the primary benefits of footfall data is its role as the essential denominator in calculating true retail sales conversion. Without knowing how many people walked through the door, you cannot accurately measure the effectiveness of your floor staff or your visual merchandising.
The Power of Sales Conversion Rates
The formula for conversion is simple: Total Transactions divided by Total Footfall. While many businesses focus on driving more traffic, the most cost-effective growth often comes from optimizing the visitors you already have. Increasing your conversion rate from 15% to 16% in a high-traffic Sydney or Melbourne flagship can result in a revenue lift of A$12,000 to A$20,000 per month without spending an extra cent on digital marketing. It’s about efficiency, not just volume.
- Identify Friction: High traffic paired with low conversion often points to long queues or poor stock availability.
- Optimise Staffing: Aligning staff levels with “power hours” ensures that high-intent shoppers receive immediate attention.
- Measure Marketing: Validate if a specific window display actually drew people into the store or just encouraged window shopping.
National Benchmarking and KPIs
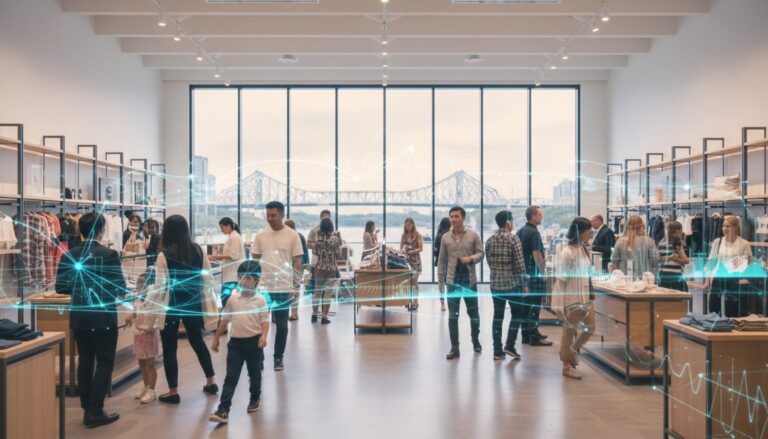
Australian retailers managing multiple locations require a standardized way to measure success. National benchmarking allows you to compare a boutique in Brisbane’s James Street against a site in Perth’s Murray Street Mall using objective data. This creates a level playing field where store managers are judged on their ability to convert the specific traffic they receive, rather than just their total sales volume. Utilizing Retail Footfall Analysis in Australia helps brands set realistic, data-backed growth targets for every location in their portfolio.
This data also serves as a powerful tool for property management. If foot traffic in a specific shopping centre has declined by 12% over the last two years, you have the hard evidence needed to negotiate more favourable lease renewals. It moves the conversation from gut feeling to financial logic.
Distinguishing between “lookers” and “buyers” is the next step in refining your customer service. By analyzing dwell time alongside transaction data, you can identify segments of the day where visitors stay long but buy little. This insight allows you to refine sales training, ensuring your team knows exactly when to step in and close a sale. You can start identifying these patterns today by viewing your real-time analytics dashboard to see where the gaps in your current visitor journey exist.
Operational Excellence: Optimising Staffing and Costs
Precision in operations separates market leaders from those struggling with escalating overheads. One of the primary benefits of footfall data is the ability to synchronise your most expensive asset, your people, with actual visitor demand. Australian retailers often lose up to 15% of potential revenue due to understaffing during peak periods or waste thousands in A$ on overstaffing during quiet Tuesday mornings. By analysing historical traffic patterns, businesses can transition from rigid, fixed rosters to dynamic, demand-based scheduling.
Data-Driven Staffing Models
Flexible scheduling ensures the right staff-to-customer ratio is maintained during high-stakes events like Afterpay Day sales or the December peak. This isn’t just about sales conversion; it’s about employee wellbeing. When you use spatial analytics to predict surges, you prevent staff burnout and reduce turnover costs. Recruitment and training for a new retail staff member in Australia can average A$5,000, making retention a financial priority. Predictive queue management also allows managers to open service desks before a bottleneck forms, keeping wait times below the critical three-minute threshold where customer satisfaction typically drops.
Facility and Resource Management
Operational efficiency extends beyond the shop floor to the very infrastructure of the building. Footfall sensors provide the intelligence needed to shift from time-based to usage-based maintenance. Instead of cleaning restrooms on a fixed hourly schedule, facilities teams can deploy staff after a specific threshold of 200 entries is met. This targeted approach can reduce cleaning supply costs by 12% annually while ensuring high standards during busy periods.
For large-scale public spaces like the State Library of Victoria or regional museums, these insights are indispensable. They provide the evidence-based success metrics required to justify government funding and annual grants. Smart buildings also leverage occupancy data to automate HVAC and lighting systems. Heating a 2,000-square-metre floor that’s only at 10% capacity is a significant drain on resources. By integrating real-time foot traffic insights with building management systems, businesses can achieve the following results:
- Energy Reduction: Lowering HVAC output in low-traffic zones can reduce energy bills by up to 22%.
- Maintenance Longevity: Reducing wear and tear on lifts and escalators by adjusting operation modes based on flow.
- Optimised Security: Deploying security personnel to zones with the highest density of people.
These benefits of footfall data create a leaner, more responsive operational model. It moves the business away from guesswork and toward a strategy that prioritises both the bottom line and the visitor experience through hard evidence. For industrial-scale energy optimisation and decarbonisation strategies that complement these spatial insights, check out Super Smart Energy.
The Strategic Edge: Marketing Attribution and Layout Optimisation
Traditional marketing often leaves a gap between the digital click and the physical threshold. One of the primary benefits of footfall data is its ability to bridge this divide through precision attribution. By monitoring the ‘draw rate,’ which measures the percentage of passersby who enter a store, businesses can finally quantify the impact of a window display or a localised social media campaign. It’s no longer about guessing if a billboard worked; it’s about seeing the physical spike in arrivals within hours of a campaign launch.
Closing the Loop on Marketing ROI
In 2026, Australian retailers are moving beyond simple counts. They’re calculating the Cost Per Visit (CPV) for national initiatives with the same rigour as digital CPC. If a A$10,000 campaign generates 2,000 incremental visits, the CPV is exactly A$5.00. This granular insight allows managers to pivot budgets in real-time, focusing spend on the regions where the ‘draw rate’ is highest. You’ll find deeper implementation strategies in our Footfall Data Analysis: A Strategic Guide. Differentiating between new and returning visitors ensures that loyalty programmes are actually driving retention rather than just subsidising existing habits.
Science-Based Layout and Merchandising
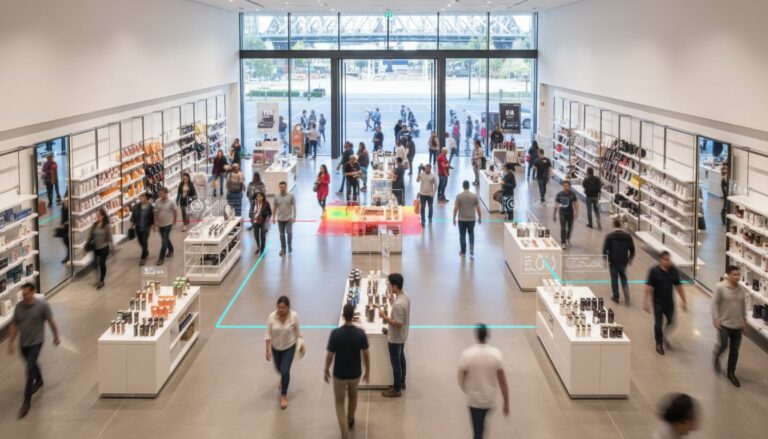
Spatial analytics transform the floor plan from a static map into a dynamic revenue engine. Heatmaps reveal exactly where customers linger and where they accelerate, allowing brands to identify ‘dead zones’ that currently return zero value. By repositioning high-margin items along the ‘golden path,’ which is the natural flow 65% of visitors take through a store, retailers frequently see a 12% lift in impulse purchases. This isn’t guesswork; it’s the application of human behavioural physics to retail environments.
Dwell time data acts as a proxy for interest levels. If customers spend an average of 210 seconds in the premium electronics section but only 45 seconds near the accessories wall, the data signals a clear need for better merchandising or increased staffing in the latter. Physical A/B testing allows for low-risk experimentation. You can test a new signage height in a Melbourne flagship for 14 days, compare the conversion data against a Sydney control store, and roll out the winner nationwide based on hard evidence.
Data removes the ego from store design. It replaces ‘I think’ with ‘we know,’ ensuring every square metre of your lease works as hard as possible. This objective approach is one of the most sustainable benefits of footfall data for businesses facing rising commercial rents. It ensures that every operational change is backed by a narrative of human movement that has been accurately decoded.
Implementation Strategy: Leveraging FootfallCam for Actionable Insights
Turning raw numbers into a competitive advantage requires a structured approach to technology deployment. For Australian retailers and facility managers, the journey begins with hardware that eliminates guesswork. The FootfallCam Pro2 has emerged as the industry standard because it solves the “dirty data” problem at the source. By processing data at the edge, it ensures that your strategic planning is built on a foundation of 99.5% accuracy.
Why Hardware Precision Matters
Low-quality sensors often fail to distinguish between a potential customer and a shopping trolley. This leads to inflated metrics that skew conversion rates. The Pro2 uses advanced AI to filter out children, staff members, and non-human objects. It maintains strict compliance with the Australian Privacy Principles (APP) by using anonymous edge-processing. This means no personal video data ever leaves the device; only the numerical insights reach your dashboard. Relying on precise hardware is one of the primary benefits of footfall data, as it prevents costly misallocations of staff based on ghost traffic.
Businesses with existing security infrastructure can utilize the FootfallCam Centroid. This module connects to your current CCTV system, transforming standard video feeds into smart sensors. It’s a cost-effective way to scale spatial analytics across large venues without replacing entire hardware fleets. This integration flows directly into the FootfallCam V9 Software, a centralized platform that handles the heavy lifting of data synthesis.
Integrating Analytics into Everyday Decisions
Data loses its value if it sits idle in a database. The V9 software automates the delivery of insights. Regional managers receive scheduled reports that highlight performance gaps across multiple sites. You can use the mobile app for real-time occupancy monitoring, which is essential for managing safety limits in busy Australian shopping centres. Creating a data-driven culture means empowering floor staff to see how their service levels impact dwell times and sales directly.
Securing a long-term return on investment involves more than just installation. It requires people counter support to maintain system health. Regular audits ensure that your sensors remain calibrated as store layouts change. In 2026, the businesses that thrive will be those that view footfall analytics not as a one-time setup, but as a continuous pipeline of intelligence. Maximising the benefits of footfall data requires this blend of high-precision hardware and proactive technical management to ensure every A$ invested translates into operational growth.
Mastering the Narrative of Physical Space
The benefits of footfall data transform how Australian retailers and property managers view their physical assets. By moving past basic metrics, you gain the power to optimize floor layouts and align staffing schedules with actual visitor demand. This level of precision eliminates the guesswork that often leads to wasted A$ resources and missed sales opportunities. It’s about converting every entry into a measurable data point that informs your long-term growth strategy. Precision is no longer a luxury; it’s a requirement for the 2026 retail environment.
Partnering with Footfall gives you access to over 20 years of experience in the Australian market. Our AI-powered sensors achieve 99%+ counting accuracy, providing a solid foundation for your most critical business decisions. We back this technology with comprehensive local support and maintenance plans to ensure your insights remain uninterrupted. You’ve seen the potential for operational excellence. Now it’s time to implement the tools that make it a reality. Our team is ready to help you decode your visitor journey and build a more resilient, data-driven future.
Request a Consultation with our Australian Data Strategists
The path to a smarter, more efficient business starts with the right evidence.
Frequently Asked Questions
What is the primary benefit of footfall data for a small retail store?
The primary benefit is the ability to align your staff rosters with actual visitor peaks to prevent missed sales opportunities. Small retailers often overstaff during quiet periods or understaff during surges; data eliminates this guesswork. By identifying that 40% of your traffic occurs between 4:00 PM and 6:00 PM on Thursdays, you can ensure your best sales team is on the floor. This precision helps small businesses maximize limited resources.
How accurate is modern footfall data compared to manual counting?
Modern AI-powered sensors achieve an accuracy rate of 98% or higher, whereas manual counting typically suffers from a 15% error margin due to human distraction. Manual tallies often miss groups or fail to distinguish between staff and customers. High-precision 3D sensors use spatial analytics to filter out non-human objects and children. This level of reliability ensures your strategic decisions are based on objective evidence rather than anecdotal observations.
Can footfall data help me reduce my store’s electricity and HVAC costs?
You can reduce HVAC and lighting costs by up to 20% by integrating real-time occupancy data with your Building Management System (BMS). When sensors detect that a specific zone has zero visitors for more than 15 minutes, the system can automatically dim lights or adjust temperature settings. This creates a sustainable operational model that responds to actual human presence. It’s a direct way to lower overheads in high-cost energy markets like Australia.
Is footfall data collection compliant with Australian privacy laws?
Footfall data collection is fully compliant with the Australian Privacy Act 1988 and the Privacy Amendment (Notifiable Data Breaches) Act 2017. Our technology uses privacy by design principles, meaning it processes data at the edge and never stores personally identifiable information (PII). It tracks movement patterns as anonymous mathematical vectors rather than video footage. This ensures your business gains the benefits of footfall data while maintaining 100% compliance with local surveillance regulations.
What is the difference between footfall counting and sales conversion tracking?
Footfall counting measures the total volume of opportunities entering your space, while sales conversion tracking measures how many of those visitors made a purchase. If you have 1,000 visitors but only 100 sales, your conversion rate is 10%. Without the footfall data, you’d only see the 100 sales and miss the 90% of people who left empty-handed. This distinction is critical for identifying whether you have a traffic problem or a merchandising problem.
How does footfall data help in optimizing store layouts?
Data helps optimize layouts by revealing dead zones where 0% of customers linger and hot spots with high dwell times. If 70% of your visitors turn left upon entry but your high-margin items are on the right, your layout is costing you revenue. By repositioning fixtures based on these movement patterns, retailers have seen sales increases of 15% or more. It transforms the store into a high-performance environment designed around actual customer behavior.
Do I need new cameras, or can I use my existing CCTV for footfall data?
While some basic analytics can be extracted from existing CCTV, we recommend dedicated 3D LiDAR or stereoscopic sensors for 98% accuracy. Standard CCTV cameras often have blind spots or low angles that result in a 20% undercount during busy periods. Specialized sensors are designed to work in varied lighting conditions and can distinguish between staff and shoppers. This investment ensures the benefits of footfall data aren’t compromised by poor-quality hardware.
How quickly can I expect to see an ROI after installing a people counting system?
Most Australian retailers see a full return on investment within 3 to 6 months of implementation. By reducing labor costs through optimized scheduling and increasing conversion rates by just 2%, the system pays for itself quickly. For a store generating A$1,000,000 in annual revenue, a 1% improvement in conversion can result in an extra A$10,000 in monthly sales. The financial impact is immediate and measurable once you start making data-backed changes.