Measuring Marketing Campaign Effectiveness in Retail: A Data-Driven Guide
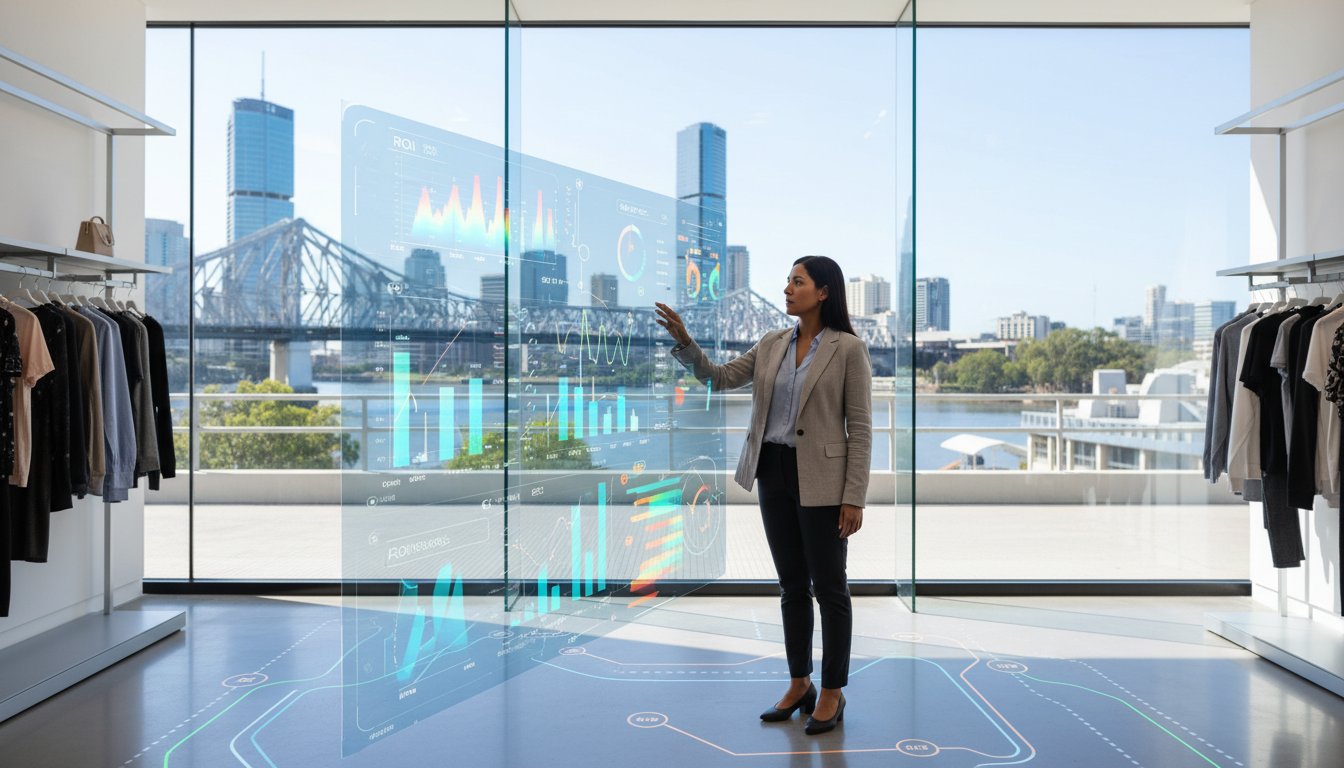
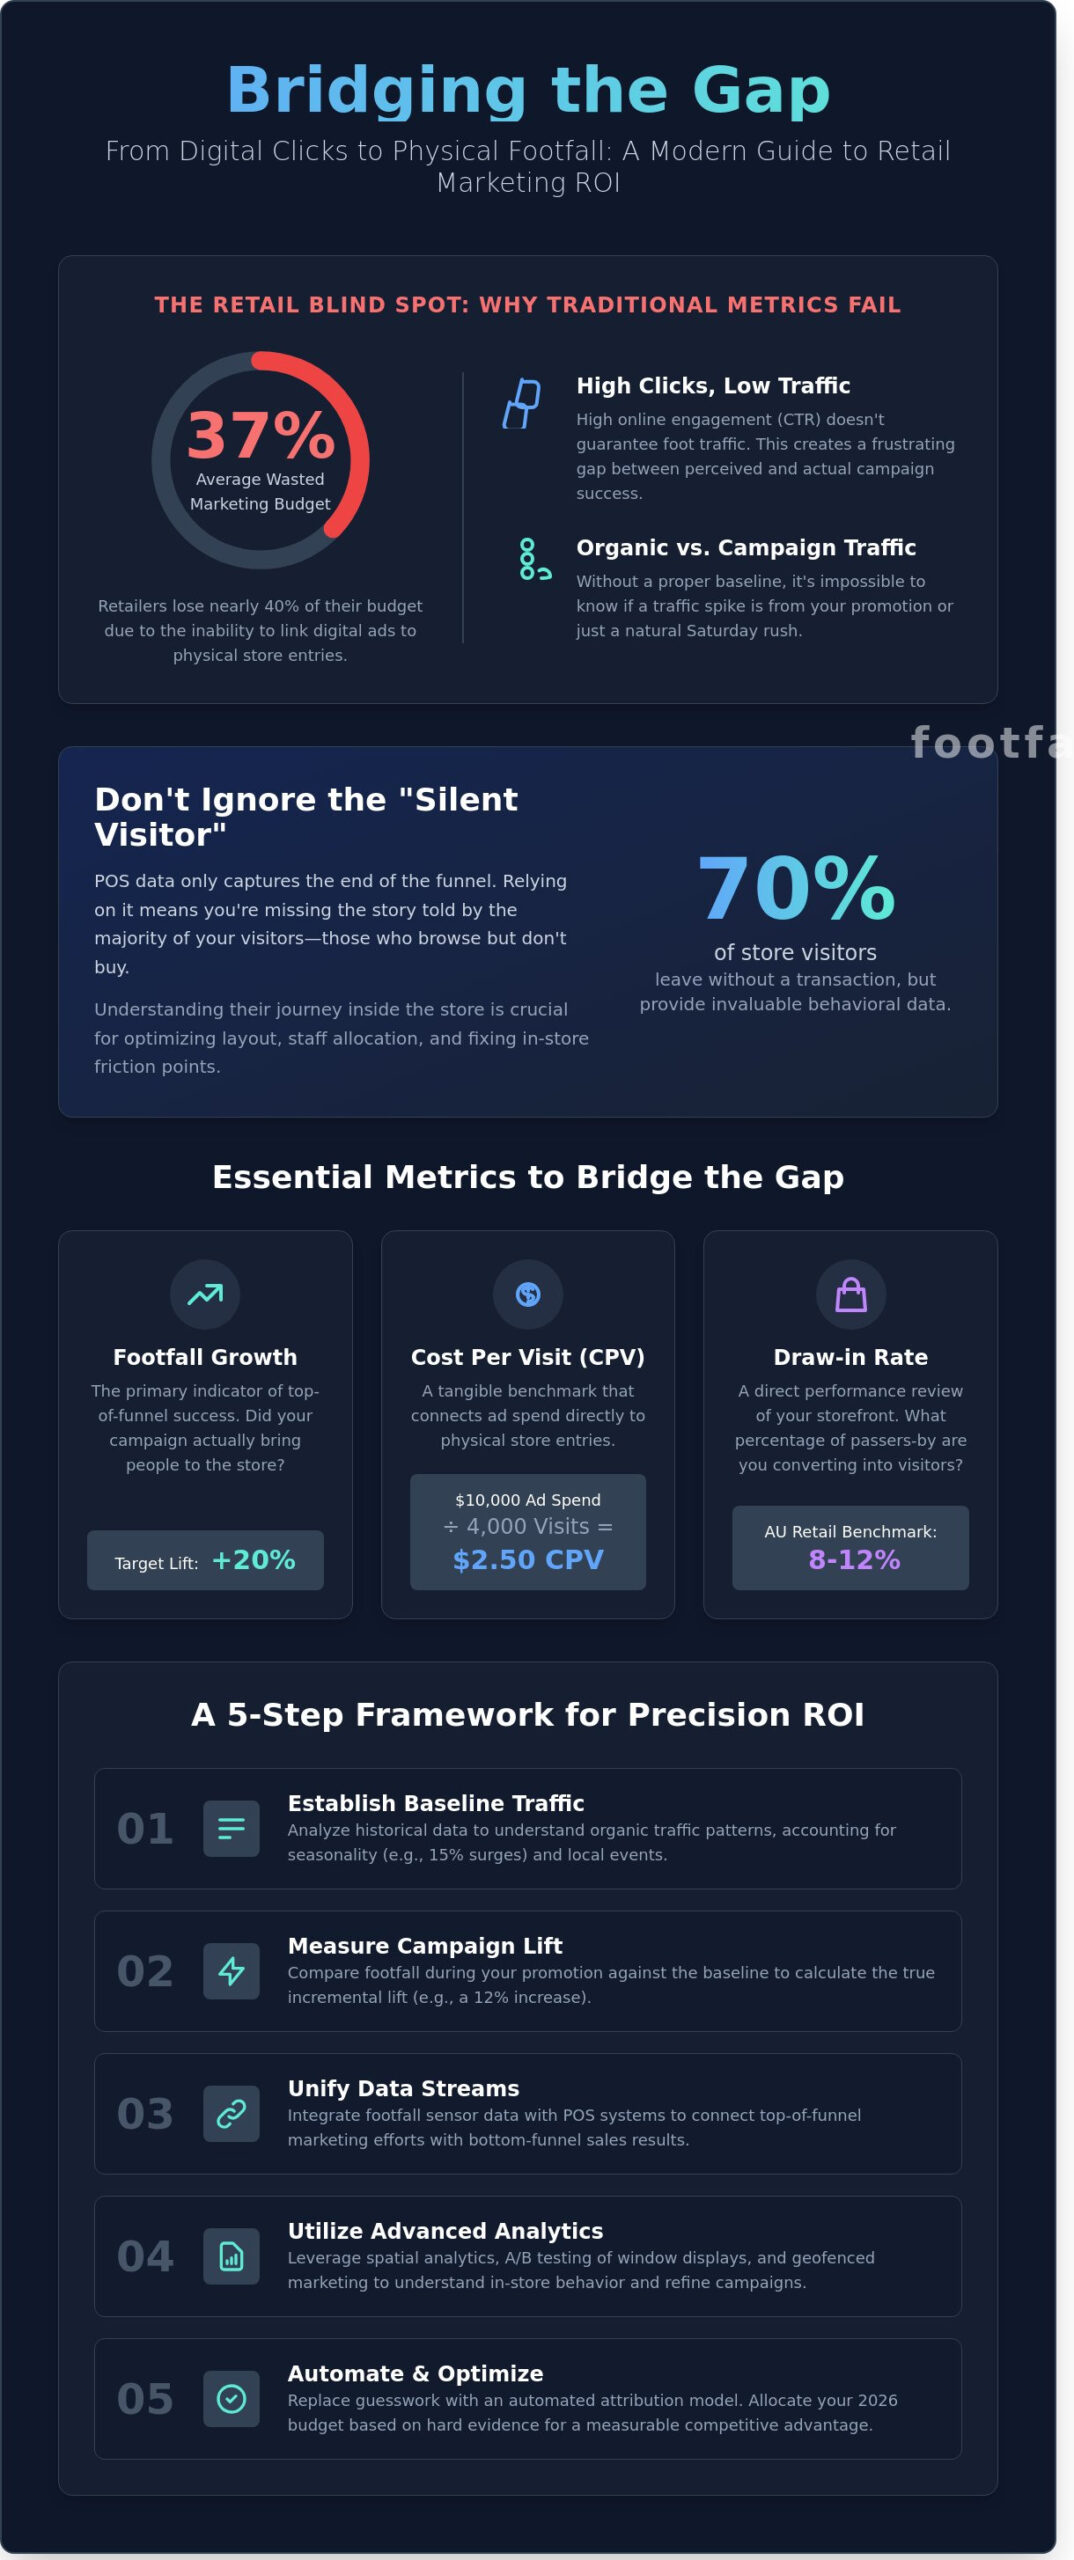
According to 2024 industry data, retailers lose an average of 37% of their marketing budget because they cannot accurately link digital ad spend to physical store entries. This lack of visibility makes measuring marketing campaign effectiveness in retail feel like an exercise in guesswork rather than a strategic operation. You’ve likely felt the frustration of seeing high click-through rates online while store managers report stagnant foot traffic; it’s a gap that makes it nearly impossible to distinguish between organic shoppers and those driven by your latest promotion.
It’s time to replace those blind spots with precision and logic. This guide provides the technical framework to bridge the gap between marketing spend and store performance, using precise footfall analytics and conversion metrics to decode the visitor journey. We’ll outline a clear attribution model that empowers you to allocate your 2026 budget based on hard evidence, turning your data into a measurable competitive advantage.
Key Takeaways
- Identify the “Silent Visitor” by moving beyond transactional data to capture the significant portion of campaign impact that often remains invisible.
- Master a data-driven approach to measuring marketing campaign effectiveness in retail by tracking footfall growth and draw-in rates during promotional periods.
- Implement a structured 5-step ROI framework that integrates footfall sensors with POS systems to unify marketing spend with actual store performance.
- Utilize geofenced marketing and A/B testing to measure how specific window displays and local campaigns influence real-time consumer behavior.
- Leverage high-precision spatial analytics to automate attribution reporting, replacing guesswork with a clear, actionable narrative of the visitor journey.
The Retail Blind Spot: Why Sales Data Alone Fails Marketing Analysis
Relying solely on Point-of-Sale (POS) systems creates a dangerous vacuum in your strategy. POS data measures the end of the funnel, but it ignores the 70% of potential customers who enter your store, interact with displays, and leave without a receipt. These “Silent Visitors” represent a massive gap in traditional marketing effectiveness metrics. You can’t optimize what you don’t see. When measuring marketing campaign effectiveness in retail, focusing only on transactions leads to skewed budget allocation. You might pull funding from a campaign that generates massive foot traffic simply because the in-store conversion didn’t happen, missing the opportunity to fix the physical friction point instead.
Footfall serves as the primary KPI for top-of-funnel awareness. It validates whether your creative messaging actually moved a human body from their home to your aisle. Without this data, you’re guessing. High-performing retailers now use sensors to bridge this gap, treating every entry as a data point regardless of the final transaction status. This approach distinguishes between transactional success and true marketing reach, providing a clearer picture of brand resonance.
The Gap Between Digital Clicks and Physical Visits
High Click-Through Rates (CTR) often mask a disconnect at the storefront. A 2024 retail study showed that digital engagement doesn’t guarantee foot traffic; in fact, “showrooming” allows 33% of visitors to browse in-person before buying from a competitor online. Modern marketing attribution in 2026 is defined as the multi-dimensional mapping of digital triggers to physical presence and subsequent spatial behavior across a unified commerce ecosystem. Without connecting these dots, you risk overvaluing digital metrics that don’t result in physical store entries.
Identifying Organic vs. Campaign-Driven Traffic
Isolate your wins by establishing a “Baseline Traffic” model. This involves scrubbing historical data from the same period in previous years to account for 15% seasonal surges or local weather disruptions. By comparing this baseline to current foot traffic, you calculate the true incremental lift. This precision is essential for measuring marketing campaign effectiveness in retail accurately. It ensures you aren’t taking credit for a natural Saturday rush, but rather the specific 12% increase driven by your targeted promotion. Historical data acts as your control group, allowing you to prove the ROI of every marketing dollar spent.
Essential Retail Marketing Metrics for Physical Stores
Measuring marketing campaign effectiveness in retail requires a shift from digital clicks to physical movements. Footfall growth serves as the primary indicator, tracking the absolute volume of visitors during a promotional window. For instance, a successful seasonal launch should yield at least a 20% increase in store entries compared to the previous month’s baseline. However, volume alone lacks context. Smart retailers now prioritize Cost Per Visit (CPV) over traditional digital metrics. If a $10,000 localized ad spend generates 4,000 unique store visits, your CPV is $2.50. This figure provides a tangible benchmark that outshines the abstract nature of digital impressions or reach.
Understanding the Draw-in Rate
The draw-in rate acts as a direct performance review for your storefront and window strategy. By using high-precision outside traffic sensors, you can calculate the exact percentage of passers-by who cross the threshold. In the Australian retail market, a healthy draw-in rate typically fluctuates between 8% and 12% depending on the specific category. If your latest window display isn’t hitting these targets within the first 72 hours, the data allows you to pivot creative assets immediately. This agility is essential to optimize your next campaign and ensure your physical presence works as hard as your digital ads.
Conversion Rate as a Quality Metric
High traffic doesn’t always translate to high success. When measuring marketing campaign effectiveness in retail, a 2% drop in conversion rate during a massive footfall surge isn’t necessarily a failure. It often indicates that your top-of-funnel marketing is reaching a broader, curious audience rather than just your core “high-intent” shoppers. Analyzing the alignment between marketing and sales helps identify if your messaging is attracting the right demographic or merely driving curiosity. Dwell time provides the necessary depth to this analysis. Data shows that a 15% increase in dwell time typically results in a 10% rise in average transaction value. Longer engagement suggests that the in-store experience successfully validates the marketing promise. Retailers can refine these journeys by using intelligent spatial data to identify which zones drive the most actual value.
How to Measure Retail Marketing ROI: A 5-Step Framework
Measuring marketing campaign effectiveness in retail requires a shift from gut feeling to granular evidence. Success depends on a structured approach that connects digital triggers to physical actions. Follow this 5-step framework to quantify your impact with precision.
- Step 1: Set clear, measurable traffic objectives. Define success before the first ad runs. Aim for specific targets, such as a 14% increase in new visitor frequency or a 10% boost in dwell time during peak hours.
- Step 2: Integrate footfall sensors with your POS system. Raw traffic numbers mean little without context. Linking entrance data to transaction logs allows you to see exactly how many visitors converted into customers.
- Step 3: Calculate the Incremental Lift. Isolate the campaign’s impact by comparing current performance against baseline periods or non-participating control stores.
- Step 4: Assign a dollar value to Non-Converting Visitors. Not every visit ends in a sale today. Use historical data to value these prospects based on a projected 3% future conversion rate and their long-term value (LTV).
- Step 5: Compare total spend against gross margin. True ROI isn’t based on revenue alone. Measure your total campaign investment against the gross margin of attributed sales to ensure the campaign was actually profitable.
Integrating Footfall and POS Data
In 2026, technical requirements for data synchronization demand real-time precision. Modern retailers utilize robust API integrations to feed LiDAR sensor data directly into cloud-based POS environments. This creates a single source of truth that eliminates data silos. You can learn more about how to integrate footfall and sales data to achieve 99% accuracy in your conversion reporting. This seamless connection ensures that every person who crosses the threshold is accounted for in your performance metrics.
Calculating the Incremental Lift
To isolate campaign-specific traffic, subtract your average baseline traffic from your campaign period traffic. Divide this by the baseline to find your lift percentage. Using control stores is a vital strategy for using analytics to boost marketing campaigns across a national network. If a test store sees a 20% lift while a control store stays flat, you’ve proven the marketing’s effectiveness. Ensure you adjust these figures for multi-channel attribution, specifically accounting for click-and-collect orders that drive physical visits via digital prompts. This rigorous approach is essential for accurately measuring marketing campaign effectiveness in retail environments.
Advanced Strategies: A/B Testing and Trend Analysis
Precision is the cornerstone of modern retail strategy. Sophisticated retailers now use “Geofenced” marketing tests to isolate the impact of digital spend on physical locations. In a 2023 pilot study, a regional apparel brand targeted mobile users within a 400-meter radius of their flagship store, resulting in a 12% lift in immediate store visits compared to non-fenced control zones. This granular approach provides the evidence required for measuring marketing campaign effectiveness in retail without relying on high-level estimates.
A/B testing extends to the physical storefront through window display analysis. By alternating two different visual merchandising themes over 14-day cycles, you can measure real-time changes in the “draw-in rate.” If Display A converts 3.8% of street traffic while Display B converts 6.2%, the data provides a clear mandate for the wider rollout. Heatmaps further validate these findings by showing which marketing-promoted zones actually attract visitors. If a heatmap reveals that 45% of shoppers bypass a high-cost end-cap, the placement requires immediate strategic adjustment.
In-Store Path Analysis
Path analysis decodes the narrative of human movement from the entrance to the promoted aisle. You can identify specific “Dead Zones” where 30% or more of your traffic loses interest and turns back. By tracking these journeys, managers optimise store layouts to ensure campaign-driven traffic flows toward high-margin zones. This process turns spatial analytics into a tool for reducing friction and increasing the probability of purchase.
The Halo Effect and Brand Recall
Long-term trend analysis reveals the sustained impact of a campaign after the final discount expires. Data shows that successful promotions often trigger a 7% increase in baseline footfall that persists for up to 25 days. The Halo Effect in retail ROI is the measurable surge in baseline traffic and secondary product sales that continues once a specific promotional period expires. Using this data-driven logic helps marketing teams justify brand awareness spend to stakeholders by proving that a single campaign builds long-term momentum. To turn these observations into a competitive advantage, you must optimise your store’s spatial performance through continuous measurement.
Implementing Precision: Leveraging FootfallCam Technology
Marketing attribution in physical spaces often fails because of “dirty” data. The FootfallCam Pro2: The Ultimate People Counter solves this by providing a 99.5% accuracy rate, turning foot traffic into a verifiable metric. This level of precision is vital for high-stakes budget decisions. When a campaign costs $50,000, relying on 80% accuracy leaves $10,000 of spend unverified. FootfallCam ensures every dollar is accounted for by capturing every visitor with surgical precision.
Management teams save roughly 15 hours per month through the FootfallCam V9 Software. It automates reporting by syncing directly with POS systems and external marketing calendars. This integration creates a seamless bridge between marketing spend and actual store entries. It replaces manual spreadsheets with automated, actionable intelligence that highlights exactly which promotions drove the highest ROI.
AI-Driven Insights for Marketers
Modern retail demands more than just raw numbers. The Pro2 uses AI to filter out staff and recurring visitors, ensuring your data reflects genuine new prospects attracted by your latest promotion. This is critical for measuring marketing campaign effectiveness in retail accurately. Marketers use real-time dashboards to adjust digital ad spend while campaigns are still live. If a specific store shows a 20% surge in traffic but low conversion, you can pivot your messaging instantly to address price objections or stock issues.
Scalable Solutions for National Retailers
Managing a network of 50 or 500 stores requires a unified view. Footfall Australia provides national support to ensure data flows without regional silos, allowing head office to compare performance across different states. For brands stuck with outdated hardware, the Legacy Swap Out Plan offers a structured path to upgrade old tech to modern standards. This program allows retailers to transition to sophisticated spatial analytics without disrupting daily operations.
You can enquire about a custom analytics solution for your retail network to begin auditing your current infrastructure. This strategic approach ensures that measuring marketing campaign effectiveness in retail becomes a standardized, automated process across your entire footprint. By removing the guesswork, you gain the quiet confidence that your marketing strategy is backed by hard evidence.
Transform Your Retail Insights into Strategic Growth
Moving from guesswork to precision changes how you view your storefront. Sales figures only tell part of the story; they ignore the shoppers who walk out without making a purchase. Integrate footfall data with your marketing calendar to gain a transparent view of how specific promotions drive physical traffic. Mastering the art of measuring marketing campaign effectiveness in retail requires this shift toward spatial analytics and real-time visitor behavior.
Footfall has served Australian retailers nationally since 2004, providing the technical eyes needed to decode the visitor journey. Leverage our AI-driven sensors to achieve 99.5% counting accuracy, ensuring your strategic decisions rest on a foundation of hard evidence. Connect these insights through our seamless V9 Analytics Software to turn raw numbers into actionable growth strategies. Don’t let your marketing budget disappear into a data blind spot.
Optimise your marketing ROI with FootfallCam analytics today and start leading your market with evidence-based confidence.
Frequently Asked Questions
How do I calculate the ROI of a marketing campaign for a physical store?
Calculate ROI by subtracting the total campaign cost from the incremental profit generated during the promotional period, then dividing by the cost. For instance, if a $5,000 campaign drives $15,000 in additional gross profit, your ROI is 200%. Accurate measuring marketing campaign effectiveness in retail requires isolating these sales figures from your baseline seasonal trends. This ensures the data remains untainted by external variables that could skew your final performance analysis.
Can people counters distinguish between staff and customers for more accurate marketing data?
Modern stereoscopic sensors use AI to distinguish between staff and customers with 98.5% accuracy. Advanced systems utilize staff exclusion tags or height-based filtering to remove employees from the final count. This precision ensures your conversion rates reflect true shopper intent rather than internal movement. By filtering out staff, retailers avoid diluting their performance metrics and can make staffing decisions based on actual visitor demand and historical patterns.
What is a good draw-in rate for an Australian retail store?
A healthy draw-in rate for Australian retail typically ranges between 8% and 12% for high-street locations. Shopping center storefronts often see higher benchmarks, sometimes reaching 25% depending on the anchor tenant proximity. If your current rate sits below the 2024 industry average of 7%, it indicates that your window displays aren’t resonating with the 5,000 plus pedestrians passing your storefront daily. Improving this metric by just 2% can significantly boost revenue.
How does footfall data help in A/B testing retail marketing strategies?
Footfall data allows you to run split tests on storefront displays by measuring the capture rate of two different creative executions over set periods. You might test a digital screen against a traditional mannequin display for 14 days each. By analyzing the delta in visitor volume and dwell time, you identify which strategy successfully converts passersby into entrants. This evidence-based approach removes subjectivity from visual merchandising and marketing decisions.
Is it possible to integrate footfall data with my existing POS system?
You can integrate footfall data with your existing POS system via a secure API or automated CSV export. This connection is vital for calculating your true conversion rate, which is the percentage of visitors who make a purchase. Combining these two data streams allows you to see that while a campaign might increase traffic by 20%, the actual sales value per visitor might fluctuate. This insight helps you pivot your sales floor strategy immediately.
How long does it take to see actionable insights after installing a people counter?
Actionable insights are available within 24 hours for immediate metrics like occupancy, but a full 14 day cycle is required to establish a reliable baseline. This two week window accounts for weekday and weekend fluctuations in consumer behavior. Once this initial period concludes, you’ll have the intelligence needed to optimize labor hours and refine your measuring marketing campaign effectiveness in retail strategy to match peak traffic periods and staff availability.
What are the most important retail marketing metrics to track in 2026?
The most critical metrics to track in 2026 include the draw-in rate, sales conversion percentage, and average dwell time. In a post-2025 landscape, retailers also prioritize cost per visitor, which calculates the efficiency of marketing spend against physical traffic. Tracking these figures allows you to move beyond simple sales totals. You’ll understand the specific human behaviors that drive your bottom line and identify exactly where shoppers drop out of the funnel.
Can I measure the effectiveness of outdoor advertising (OOH) using footfall sensors?
You can measure OOH effectiveness by correlating the timing and location of outdoor placements with localized footfall spikes. If a billboard is installed within 500 meters of your entrance on June 1st, your sensors will track the subsequent increase in new versus returning visitors. By comparing this data to a control period, you can quantify the direct impact of physical advertising on store visits. This provides a clear link between offline ads and store traffic.