
Store Traffic KPIs: How to Measure Conversion and Review Performance
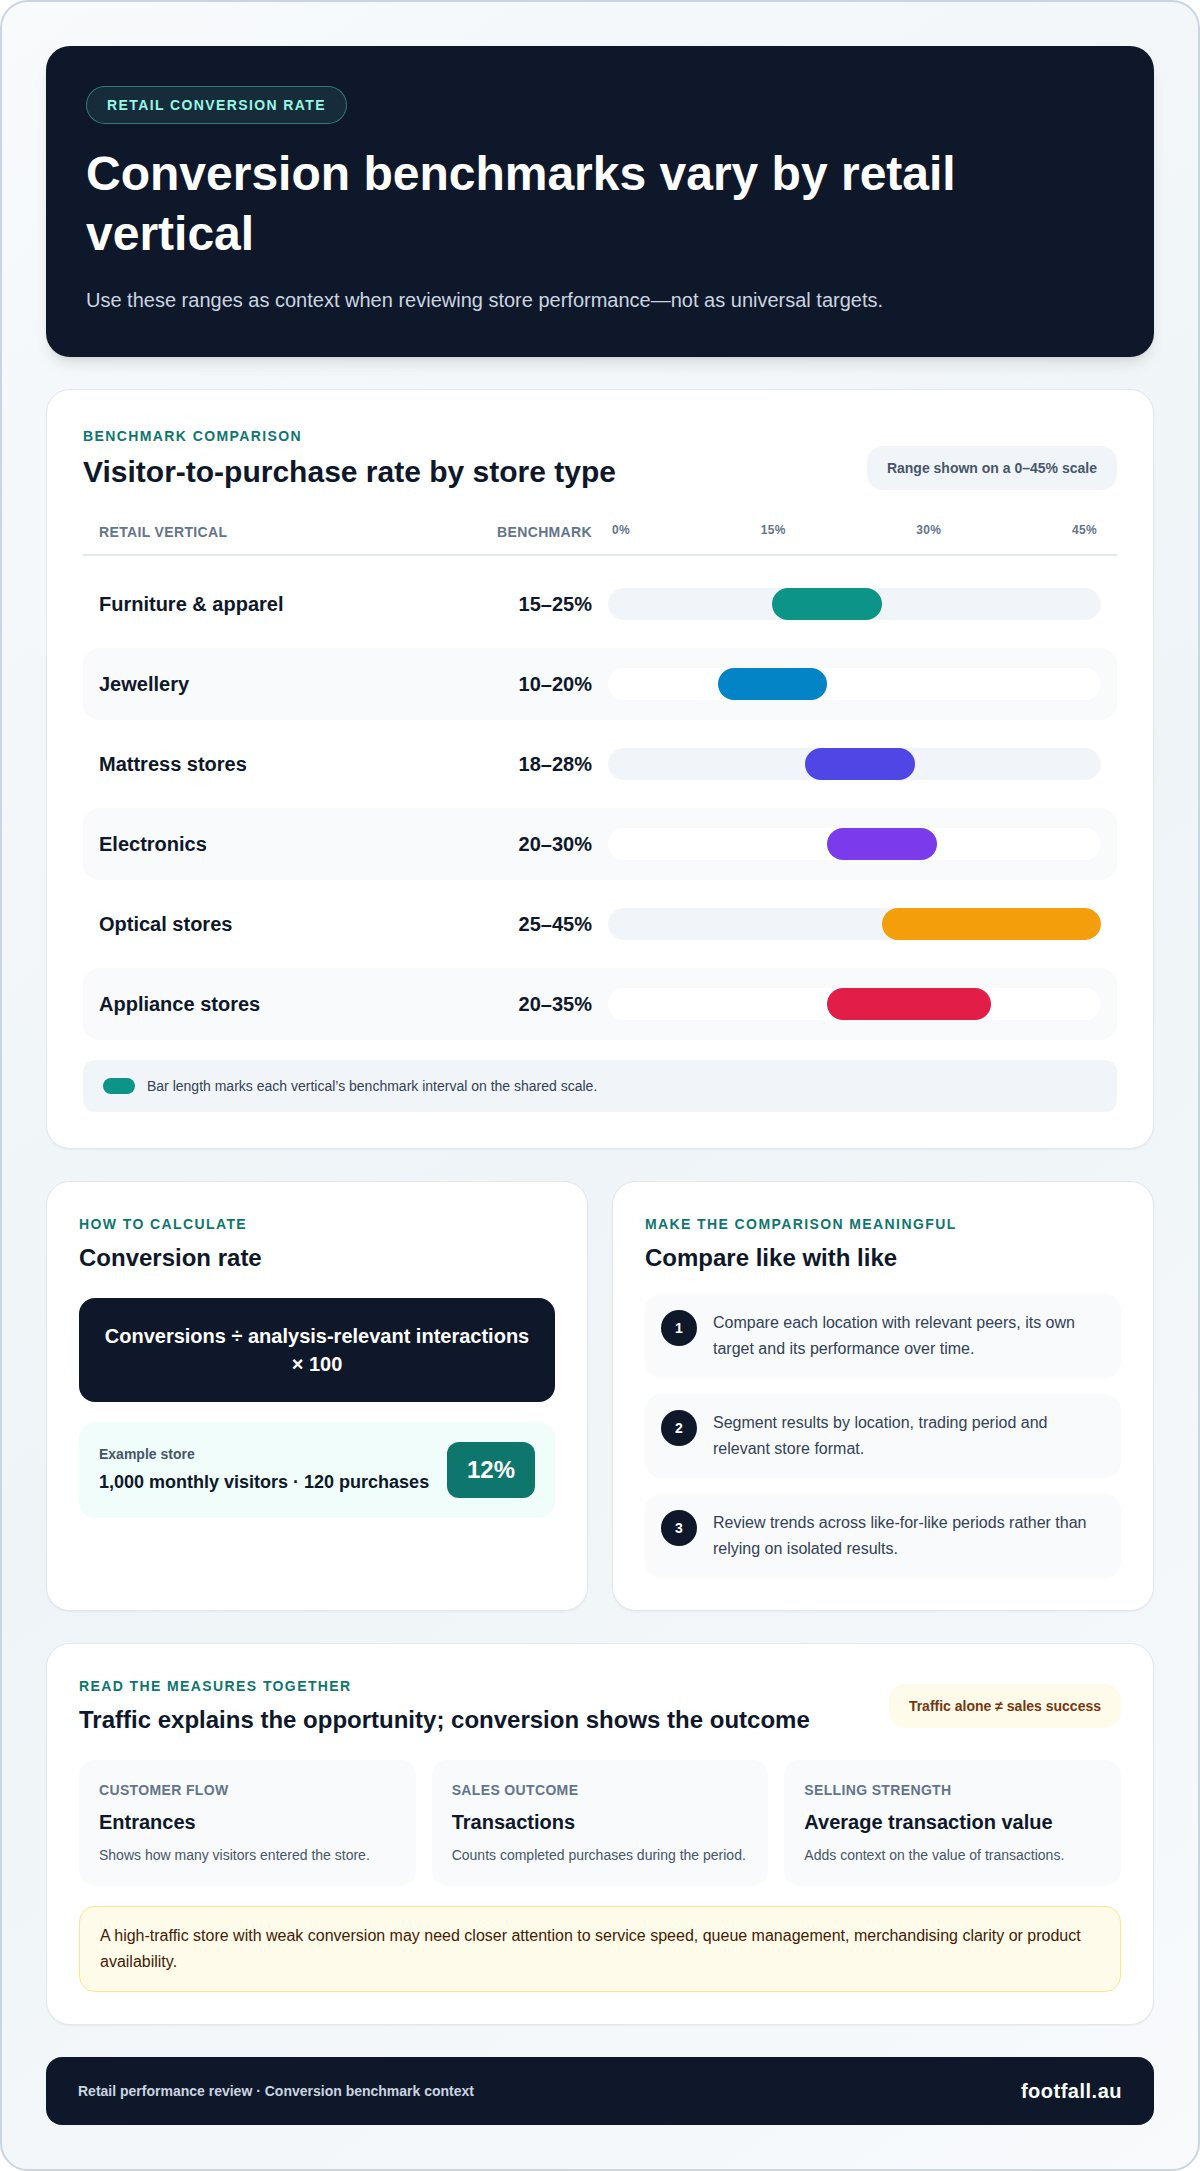
Store traffic KPIs for retail performance reviews connect visitor numbers with sales outcomes. Calculate retail conversion rate by dividing total conversions by analysis-relevant interactions, then multiplying by 100. For example, a store with 1,000 monthly visitors and 120 purchases has a monthly conversion rate of 12%.
Traffic alone can’t show whether a store is turning visits into purchases, while conversion alone can’t explain what shaped the result. Reviewing both alongside clear targets helps managers distinguish a traffic change from an issue with service, queues, merchandising or product availability. This article explains why conversion matters, which data tools support reliable KPI tracking, and how technology can make store performance easier to monitor. You’ll also see how to connect the numbers to practical review actions, so each measure can inform decisions rather than sit unused in a dashboard.
Key Takeaways
- Set a focused group of store KPIs and give each measure a target, an actual result, a variance and a next action.
- Pair sales data from a POS system with footfall data from a people counter to build a clearer view of store performance.
- Use sales per square foot to assess how effectively a store’s selling space contributes to revenue.
- Combine outcome measures, such as sales and conversion, with indicators of customer flow to guide more useful performance reviews.
1. Why measure your retail conversion rate?
Conversion rate shows how effectively a store turns visits into purchases. Calculate it by dividing conversions by analysis-relevant interactions, then multiplying by 100. A store visitor-to-purchase rate helps interpret traffic alongside sales, rather than treating busy trading periods as success by themselves.
Benchmarks vary by retail vertical: furniture and apparel stores sit at 15-25%, jewellery at 10-20%, mattress stores at 18-28%, electronics at 20-30%, optical stores at 25-45%, and appliance stores at 20-35%. Treat these as context, not universal targets. Compare each location with relevant peers, its own target and its performance over time.
Segment store traffic KPIs by location, trading period and relevant store format. Compare like-for-like periods and review trends rather than isolated results, so seasonal changes don’t distort performance reviews. Useful measures include entrances, in-store conversion, transactions and average transaction value. Together, they help show whether results reflect more visitors or stronger selling.
For Australian visitor analytics, applicable privacy obligations depend on whether identifiable information is collected and how it is handled. Aggregate entrance counts focus measurement on movement rather than individual identities.
Where the counting setup allows, separate customer entrances from employee movement. Treat repeat visits as visits, not unique shoppers, and check unusual counts against trading conditions and counter performance before drawing conclusions. A high-traffic store with weak conversion may need closer attention to service speed, queue management, merchandising clarity or product availability.
Use traffic and conversion patterns by time of day to align employee coverage with customer demand. Compare marketing periods with baseline performance, then investigate whether changes in traffic or conversion explain the result. Relate layout changes to traffic patterns and sales outcomes, considering average transaction value and sales per square metre to assess commercial impact.
2. What tools do you need to track retail KPIs?
Reliable KPI tracking pairs transaction data with store-entry counts. A point-of-sale system records sales and transactions; a people counter measures store traffic. Together, these tools help distinguish shifts in visitor volume from changes in sales performance. Before comparing results, make sure the data covers the same stores and periods.
Choose a focused set of metrics across sales, customers, inventory and profitability. Most store managers can focus on 8 to 10 core KPIs rather than dozens. Useful sales measures include average transaction value, calculated as transaction sales divided by the distinct transaction count, and sales per square foot, calculated by dividing net sales by sales area.
To assess staffing productivity, divide total sales by total labour hours. This sales-per-labour-hour measure helps compare trading periods with different staffing levels. Read it alongside customer experience and store conditions, since the metric alone doesn’t explain what influenced sales or service.
Inventory and profitability measures add context. Inventory turnover divides the cost of inventory sold by average inventory cost; gross margin return on inventory investment divides gross profit by average inventory cost. Customer retention also matters, but calculating it requires customer counts at the start and end of a period, along with the number of new customers.
Make sales versus target actionable with a scorecard showing each KPI’s target, actual result, variance and next action. Compare trends across consistent periods and relevant stores, then assign follow-up actions to the measures furthest from target. For clearer visitor-count inputs, explore retail footfall measurement as part of your KPI setup.
3. Using technology to monitor retail KPIs
Technology can help connect store activity with sales outcomes. A people counter records store entrances, while digital analytics measure website sessions; these represent different visitor behaviours. Pair entrance counts with transaction data for the same location and period to see whether revenue changes reflect visitor volume, conversion or selling performance. A dashboard built around store traffic KPIs for retail performance reviews can make these relationships easier to interpret.
A useful dashboard separates lag KPIs from lead KPIs. Lag measures show outcomes, such as sales and conversion; lead measures track conditions that can influence future results, such as customer flow. Add sales per square metre and revenue per visitor to explore how store traffic relates to commercial results. Keep definitions consistent across locations so comparisons are meaningful.
Set a review rhythm that turns actual results into decisions. Daily flash reports can show the previous day’s conversion and revenue per guest. Weekly trend analysis can compare the last 4 weeks, while monthly reviews help identify persistent differences between stores. If visitor numbers rise but transactions do not, investigate service coverage, queues, product availability or merchandising before changing strategy. Use store traffic KPIs for retail performance reviews to connect each finding with a practical follow-up action.
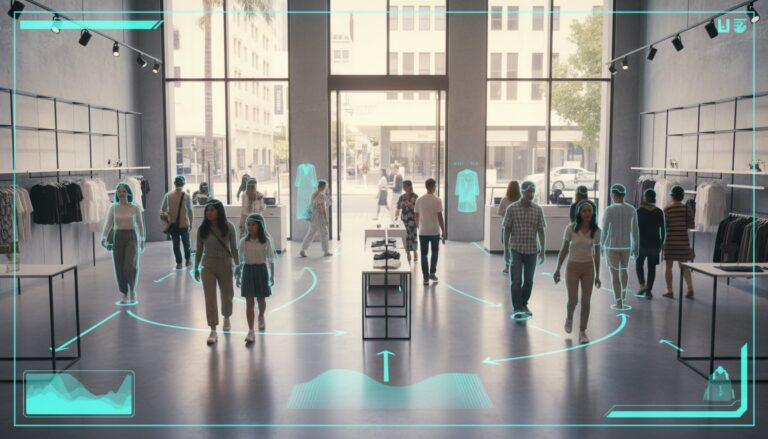
Use traffic patterns to examine where and when visitors move, not just how many enter. Counters and CCTV analytics can help measure customer flow; transaction and sales data add the outcome. Together, these tools help teams connect a trading result to possible operational causes, then assign a follow-up action. To strengthen visitor measurement in your KPI process, explore retail footfall analytics.
Footfall Australia
Footfall Australia helps retailers build a clearer view of store traffic and customer movement for performance reviews. When visitor counts are difficult to connect with trading patterns, FootfallCam Pro2 People Counters and FootfallCam Pro1 IP Cameras support the measurement of in-store activity. FootfallCam Centroid and FootfallCam V9 Software are also available within its offering.
Footfall Australia’s fully managed People Counting and AI Analytic Solutions help retailers measure visitor activity and interpret it alongside sales information. The service is useful when comparing store performance, investigating traffic trends or seeking a consistent view of visitor activity across locations. It uses existing CCTV infrastructure, with data masked at the source and no personally identifiable information collected or stored.
For a discussion about your store traffic measurement needs, contact Footfall Australia.
Turn measurement into your next retail decision
Use your next review to identify one gap worth investigating, assign an owner and choose a follow-up measure. A consistent approach to store traffic KPIs for retail performance reviews keeps measurement connected to operational decisions rather than treating a dashboard as the end product. As patterns emerge, refine which signals deserve attention and how results are discussed across locations. This creates a practical cycle: observe store activity, act on the findings, then assess whether the response addressed the issue.
Footfall Australia can help retailers consider people-counting and camera options for monitoring store activity. If you’re ready to discuss how visitor measurement could support your performance reviews, contact Footfall Australia today. Start with the question your team needs answered, and shape the next step around it.
Frequently Asked Questions
What are Retail Performance Management and KPIs?
Retail Performance Management involves setting KPI targets, comparing actual results with those targets, investigating differences and assigning follow-up actions. For example, a manager might investigate why a store missed its sales target, identify a contributing factor and assign a response. KPIs make reviews more focused by showing which outcomes and operating conditions need attention.
How do you calculate in-store conversion rate?
Divide the number of in-store conversions by analysis-relevant interactions, then multiply by 100. For a meaningful result, define what counts as a conversion and which visits belong in the denominator. Use transaction and entrance data from the same store and period. Apply the same definitions consistently so comparisons reflect performance rather than changed counting rules.
Retail KPI examples: which metrics should you focus on?
Choose measures that explain different parts of store performance. Traffic and conversion show how visits relate to purchases; average transaction value describes transaction size. Inventory turnover and gross margin return on inventory investment show how stock contributes to trading results. Select metrics based on the decisions managers need to make, then set a clear target and follow-up action for each.
What are the most important KPIs for retail stores?
The most useful KPIs depend on a store’s goals and current challenges. A manager addressing falling sales might review traffic, conversion and average transaction value together. If stock performance is the concern, inventory turnover and sell-through can add context. Consider measures together, since one result rarely explains the cause of another.
What is a KPI in retail?
A retail KPI, or key performance indicator, measures progress towards a business or store objective. Sales can be a KPI when tracked against a target; a raw figure becomes more useful when managers compare it with expectations and decide what action to take. A well-chosen KPI supports a specific decision, not just reporting.