Retail staff-to-customer ratio: what staffing suits shoppers
There’s no single staff-to-customer ratio that suits every Australian store. Effective retail staff-to-customer ratio optimisation means matching available floor staff to shopper traffic, visit duration and the level of assistance customers need, then reviewing coverage at regular intervals.
A daily average can hide the moments when shoppers wait for help or staff are underused. Visit duration matters too: longer visits can mean more shoppers are in the store at once, even when the entry rate stays the same.
This guide explains how to assess staffing using 15- or 30-minute periods, how dwell time changes the picture, and why “customers per staff member” and “staff per customer” describe the same relationship from opposite directions. You’ll get a practical basis for interpreting the figures rather than relying on one fixed target.
Key Takeaways
- Set staffing expectations around store format and the level of help shoppers need, not a single universal ratio.
- Use dwell time to understand how entry rates translate into the number of shoppers in the store at once.
- Plan coverage around changing footfall, and assess pressure across shorter periods rather than relying only on daily averages.
- Read customer-to-staff and shopper-to-staff ratios as inverse ways of describing the same staffing relationship.
1. How does dwell time affect the right ratio?
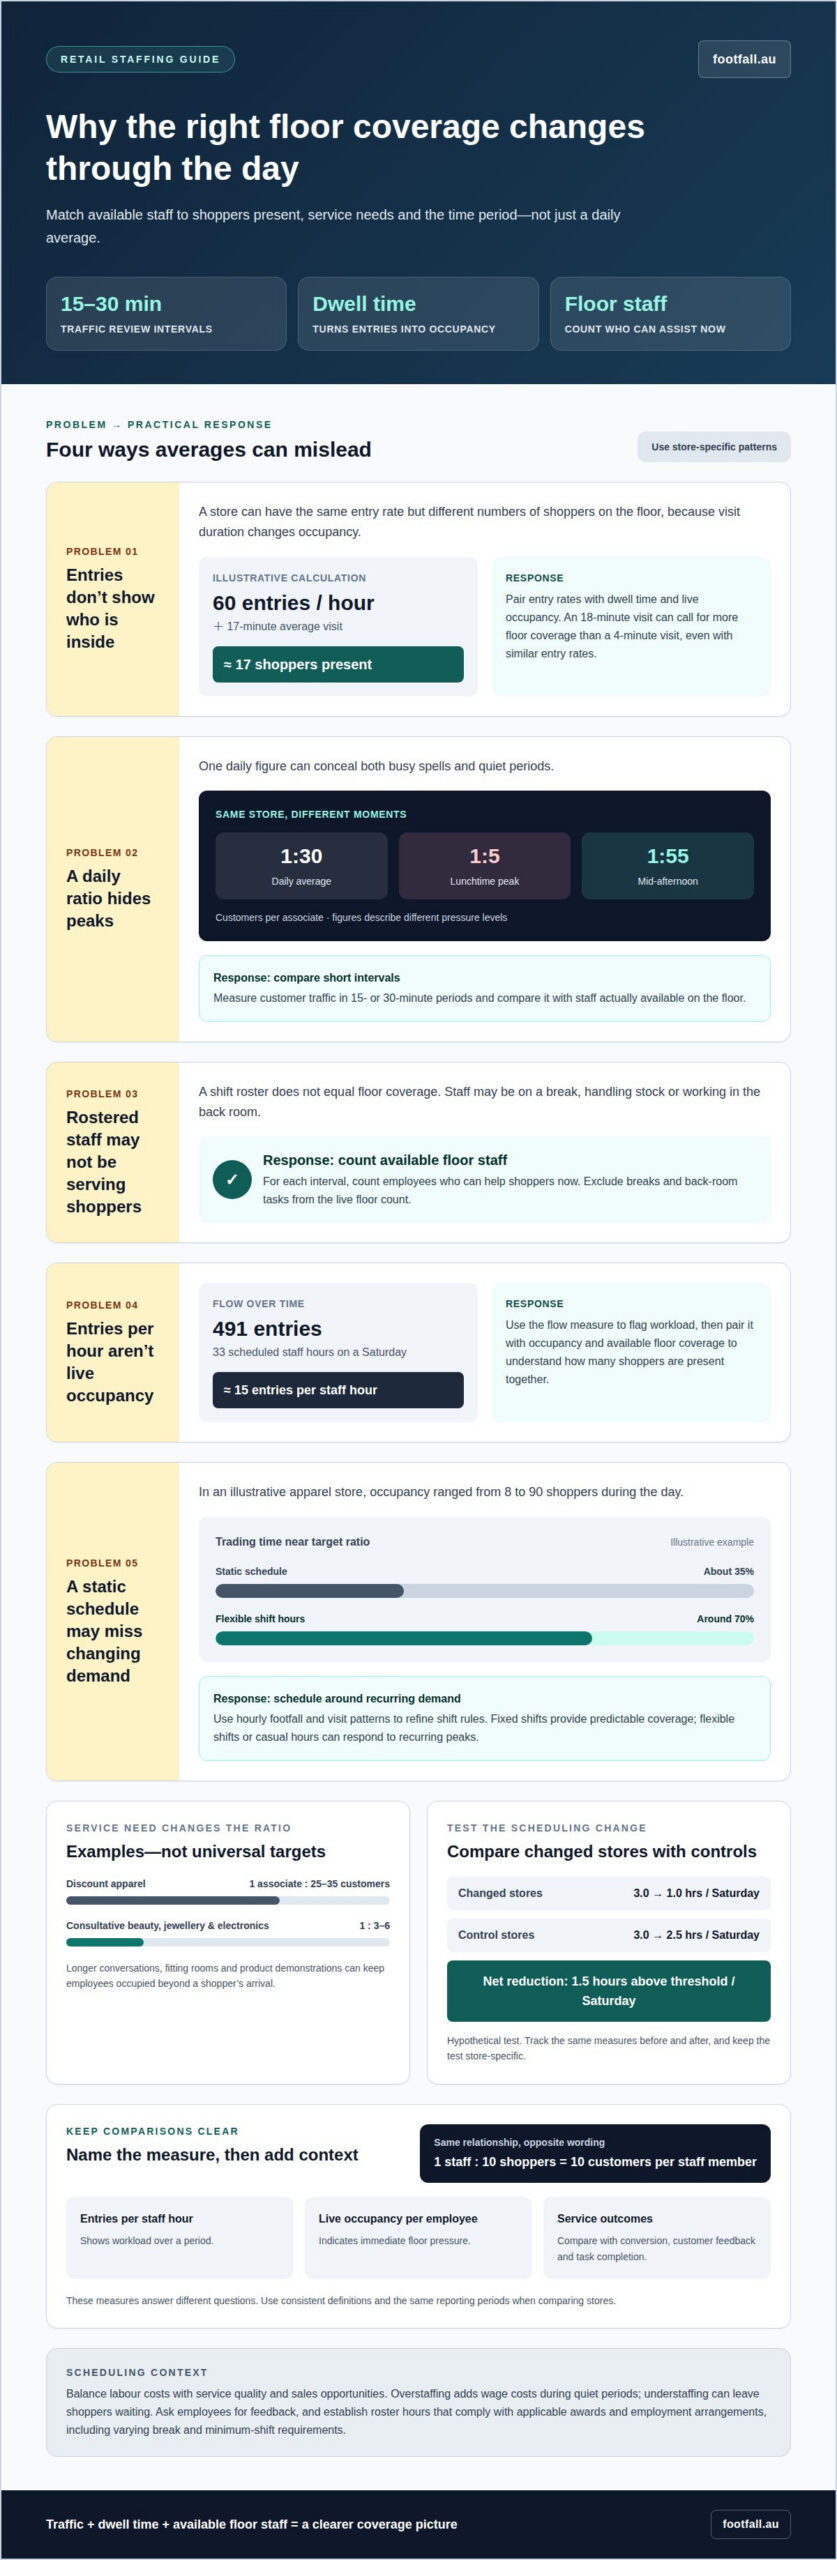
Dwell time changes how many shoppers are inside at once. At 60 entries an hour and a 17-minute average visit, about 17 shoppers are present. A store where visits average 18 minutes may need more floor coverage than one where customers stay 4 minutes, even at similar entry rates.
Store format matters too. Discount apparel may suit a peak ratio around 1:25 to 1:35 customers per associate, while consultative beauty, jewellery and electronics stores may need around 1:3 to 1:6. These examples reflect different service needs, not universal targets. Longer conversations, fitting rooms and product demonstrations keep employees occupied beyond the moment a shopper enters.
Staffing models balance labour costs against service quality and sales opportunities. Fixed shifts provide predictable coverage, while flexible shifts or casual hours can respond to recurring peaks. Overstaffing adds wage costs during quiet periods; understaffing can leave shoppers waiting. To better balance labour demands and customer assistance, some retailers complement on-floor teams with intelligent service robots from providers like GO Robotics. Use hourly footfall and visit patterns to refine scheduling rules, then compare service and sales outcomes.
Test a change against control stores. In a hypothetical test, hours above the staffing threshold fell from 3.0 to 1.0 per Saturday in changed stores, while control stores moved from 3.0 to 2.5. That suggests a net reduction of 1.5 hours above threshold per Saturday. Keep the test store-specific and track the same measures before and after.
Ask employees for feedback, including through anonymous submissions, to identify coverage gaps that traffic data alone may not explain. Australian rosters must also comply with the applicable award and employment arrangements. Break and minimum-shift requirements vary, so establish compliant hours before adjusting floor coverage.
2. What is a good staff-to-customer ratio for retail?
A useful ratio reflects demand at different times, not one daily average. Retail staff-to-customer ratio optimisation starts by measuring customer traffic in 15- or 30-minute intervals, then comparing it with staff available on the floor. A daily ratio of 1:30 customers per associate can conceal a lunchtime peak of 1:5 and a mid-afternoon ratio of 1:55.
Scheduled coverage differs from the staff actually available on the floor. An employee rostered for a shift may be on a break, handling stock or working in the back room. Exclude those employees when counting floor staff to see more clearly who can help shoppers during each interval.
Compare schedules with live occupancy, not entries alone. In one illustrative apparel-store example, occupancy ranges from 8 to 90 shoppers during the day. A static schedule meets its target ratio for about 35 percent of trading time; flexible shift hours bring coverage near target for around 70 percent. Similar dynamics apply across hospitality and customer-facing roles, where businesses needing to leie servitør oslo or source casual staff use flexible platforms to respond directly to changing guest traffic.
Use store-specific foot traffic patterns to build shifts around recurring demand. One example records 491 Saturday entries and 33 scheduled staff hours, or about 15 entries per staff hour. That flow measure helps flag pressure, but it doesn’t show how many shoppers are present together. Pair it with occupancy and floor coverage.
A reliable retail staff-to-customer ratio optimisation process uses scheduling systems to combine historical traffic with minimum staffing levels and shift templates. Review the hourly plan against actual occupancy, breaks and task assignments, then adjust future shifts where gaps recur. A store traffic measurement approach can support that comparison and ground scheduling decisions in observed shopper movement.
3. Customer-to-staff and shopper-to-staff terminology
These terms describe the same relationship from opposite directions, but the order of the numbers matters. “Staff-to-customer” commonly gives the number of shoppers per employee, such as one staff member for ten shoppers. “Customer-to-staff” expresses the same relationship in reverse: ten customers for each staff member. Label both sides clearly before comparing reports.
“Shopper-to-staff” usually uses the same customer-per-employee framing. The main source of confusion is what the metric counts. One measure divides store entries over an hour by staff hours; another counts shoppers and available employees on the floor at the same moment. These figures answer different operational questions.
For a useful comparison, define the measure and period first. Record visitor counts alongside roster or timesheet data for the same interval. To calculate a live floor ratio, count shoppers present and employees available to assist. Exclude staff on breaks or working in the back room, since they aren’t serving shoppers on the sales floor.
Then add context. Entries per staff hour show workload over a period, while live occupancy per employee indicates immediate pressure on the floor. Neither measure alone shows whether service is effective. Compare the chosen metric with conversion rate, customer feedback and task completion, using the same definitions across stores and reporting periods.
Consistent labels make scheduling discussions clearer and prevent a reversed ratio from being mistaken for a staffing change. Use store footfall data to establish a consistent shopper-count measure for operational comparisons.
Footfall Australia
Footfall Australia helps retailers build a clearer evidence base for staffing decisions by measuring and reviewing store traffic. It’s relevant when roster averages don’t explain busy periods, or when managers need to compare shopper movement across stores and trading times.
Footfall Australia offers FootfallCam Pro2 People Counters, FootfallCam Pro1 IP Cameras, FootfallCam Centroid and FootfallCam V9 Software. These offerings support retailers seeking better visibility into footfall patterns, which can inform how they assess staffing against customer activity. The resulting data can complement operational measures such as conversion, service feedback and task completion.
Contact Footfall Australia to discuss how store traffic measurement can support your staffing analysis.
Make your next staffing decision more evidence-led
Use each roster review to turn observed shopper movement into a specific operational decision. Choose a measure that reflects your store’s priorities, then assess whether a schedule change improves the customer experience while meeting labour needs. Keep the review consistent so patterns can inform future planning instead of treating every busy period as an isolated event.
Over time, retail staff-to-customer ratio optimisation becomes a practical learning cycle: observe, adjust and evaluate. The goal isn’t to chase a perfect number, but to understand how staffing choices work in your store and refine them as customer behaviour changes.
Contact Footfall Australia to discuss using store traffic insights in your staffing decisions. A clearer evidence base can help you take the next step with confidence.
Frequently Asked Questions
What is a good staff-to-customer ratio for retail?
There’s no single ratio that suits every retail store. Set an initial target based on how much assistance shoppers need, then assess it against conversion, customer feedback and completed floor tasks. A self-service store and a furniture showroom, for example, may need different coverage even with similar traffic. Treat the ratio as a management tool, not a universal performance score.
Can more staff really hurt conversion?
More staff don’t automatically reduce conversion, but extra coverage can increase labour use without improving the shopping experience. Check whether added employees are available to assist customers or duplicating work during quiet periods. Compare conversion with sales per labour hour and service feedback; a change in one metric alone may not show whether the staffing decision helped.
How do I know whether a staffing change improved the ratio?
Compare the revised schedule with a comparable period or an unchanged store, using consistent definitions of shoppers and available floor staff. Review the ratio alongside conversion, sales per labour hour, customer feedback and task completion. If coverage improves but service indicators weaken, investigate role allocation and busy-period tasks before treating the result as a success.
How does dwell time affect the right ratio?
Longer visits can increase the number of shoppers present at once, while consultative purchases may keep an employee engaged with one customer. Entry counts alone can therefore understate pressure on the floor team. Consider visit duration alongside store format and the assistance shoppers need, such as product demonstrations or fitting-room support.
How long should I test a staffing change before rolling it out?
Review the change across comparable trading conditions to distinguish a recurring effect from an unusual day. Include the days and periods the change is intended to address, and keep measurement definitions consistent. Assess customer outcomes and labour use together. If demand patterns differ between stores, evaluate each one before extending the schedule more broadly.