How to Calculate Store Capture Rate: A 2026 Guide for Australian Retailers
Did you know that 73% of Australians still prefer to shop in physical stores, a rate significantly higher than the global average of 59%? While this suggests a massive opportunity, many retailers are still flying blind because they don’t know how to calculate store capture rate or why thousands of people walk past their doors without ever stepping inside. You’ve likely felt the frustration of watching a busy high street full of potential customers, only to see your daily sales figures fail to reflect that energy. It’s a common struggle to prove the ROI of a window display or justify staffing levels when your only data points are manual counts that lack precision.
This guide provides a definitive look at mastering this metric using modern, automated methods that replace guesswork with empirical evidence. We’ll explore the core formula, the hardware like the FootfallCam Pro2 required for accuracy, and the strategic changes you can implement to turn passing traffic into measurable revenue. By the end of this article, you’ll have a clear, repeatable framework to manage the “gating” metric of retail and ensure your store remains a destination rather than just a backdrop.
Key Takeaways
- Understand why capture rate is the critical “gating” metric that determines the success of every subsequent step in your retail sales funnel.
- Master the precise formula for how to calculate store capture rate while learning to solve the common challenge of accurately measuring passing foot traffic.
- Compare the accuracy and long-term cost-efficiency of different data collection methods, ranging from manual counting to automated AI sensors like the FootfallCam Pro2.
- Learn how to benchmark your store’s performance against Australian industry standards to determine if your visual merchandising is effectively capturing attention.
- Discover how centralized platforms like FootfallCam V9 Software allow national retailers to synchronize data across multiple locations for more informed strategic decisions.
What is Store Capture Rate and Why is it the Gating Metric of Retail?
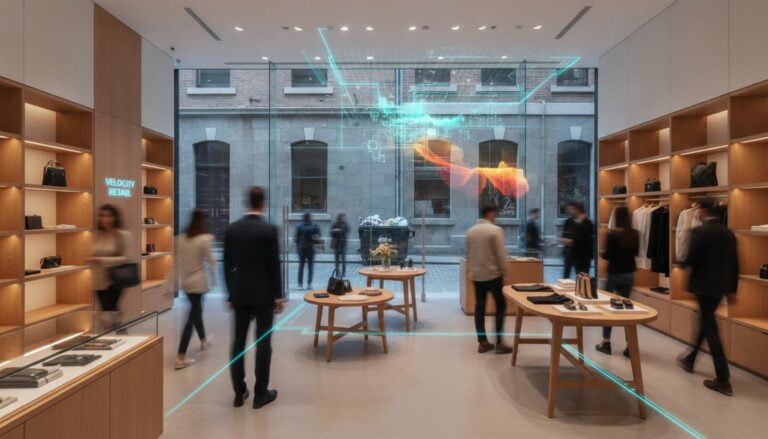
Store capture rate represents the percentage of people walking past your storefront who choose to cross the threshold. It serves as the most critical filter in the retail sales funnel, acting as the primary link between external foot traffic and internal sales activity. While many managers focus strictly on internal performance data, understanding how to calculate store capture rate allows you to quantify the missed opportunities occurring just outside your door. It’s the difference between seeing a crowd and seeing a sequence of potential transactions.
This metric highlights the distinction between total footfall and intentional entry. Total footfall counts everyone in the vicinity, but capture rate measures the effectiveness of your physical presence. When a pedestrian stops and enters, a psychological shift occurs. They transition from being a passive mover in a public space to an active, engaged prospect. Without this initial “capture,” all other performance metrics inside the store become irrelevant. It’s the gatekeeper of your revenue.
Capture Rate vs. Conversion Rate: Knowing the Difference
It’s vital to distinguish between these two fundamental metrics to diagnose store performance accurately. While a retail conversion rate tracks the percentage of visitors who make a purchase once they’re already inside, capture rate measures the efficiency of your storefront in attracting those visitors in the first place. You might have a stellar conversion rate, but if your capture rate is low, your total volume remains capped. High conversion often masks poor capture; this leads retailers to optimize sales techniques when they should actually be refining their window displays or storefront signage. Using both metrics together provides a complete view of the customer journey from the pavement to the point of sale.
The Strategic Value of Capture Rate for Australian Businesses
The Capture Rate Formula: Solving the Denominator Challenge
To understand how to calculate store capture rate, you must first master the mathematical relationship between the street and your store. The standard formula is straightforward: (Number of Entries ÷ Total Pass-by Traffic) × 100. While the numerator (entries) is easily tracked by standard counters, the denominator (pass-by traffic) represents the true analytical hurdle. Without an accurate measure of how many people had the opportunity to enter, your capture rate remains a guess. This calculation relies on absolute time-frame consistency. You must ensure both variables are measured within the exact same window; comparing a week of entries against a single day of pass-by traffic will yield useless results.
Consider a practical example. If a flagship store in a Melbourne shopping centre sees 5,000 people walk past its storefront in a four-hour window and 400 of those individuals enter, the calculation is (400 ÷ 5,000) × 100. This results in an 8% capture rate. By checking this against current Australian retail trade data, managers can determine if their store is over or underperforming relative to broader market activity. This empirical approach replaces intuition with a defensive statistic that can be tracked daily.
Defining Your Pass-by Zone
Accuracy depends on where you draw the line. A “passer-by” isn’t just anyone on the street; they must be within a specific distance from your window to be considered a viable prospect. Modern AI sensors allow you to set a virtual perimeter that accounts for street width and traffic flow patterns. This technology is sophisticated enough to filter out “non-prospects,” such as security guards on patrol or delivery drivers. By defining this zone precisely, you ensure the denominator reflects genuine potential customers. Implementing a solution like FootfallCam V9 Software can help automate these complex exclusions, providing a cleaner data set for analysis.
Handling Multiple Entrances and Edge Cases
Multi-entrance stores require a more nuanced data aggregation strategy. Side entrances often show a higher capture rate because they serve specific demographics or offer quicker access, even if their total volume is lower than the main door. You must aggregate entries across all points while ensuring the pass-by traffic is only counted once to avoid inflating the denominator. In high-flow environments, AI-driven tracking prevents double-counting individuals who might pace back and forth in front of your displays. This level of precision is what separates high-level retail strategy from basic foot traffic monitoring.
Data Collection Methods: From Manual Tallying to AI Sensors
Selecting the right hardware is the most significant decision in your data strategy. While the math behind how to calculate store capture rate is simple, the integrity of your results depends entirely on the accuracy of your sensors. Legacy methods often fail because they cannot distinguish between a customer entering and a pedestrian merely crossing the storefront’s field of view. To build a reliable dataset, you must move beyond anecdotal evidence and manual tallies.
Manual counting remains a common pitfall for retailers. It’s labor-intensive and prone to significant human error; staff often forget to log entries during peak periods, which is exactly when data is most valuable. Similarly, infrared beam counters are insufficient for modern requirements. They only detect a break in a light beam, meaning they cannot provide a denominator of passers-by. Wi-Fi and Bluetooth tracking once offered promise, but modern smartphone privacy updates and randomized MAC addresses have rendered signal-based detection inaccurate. AI-powered video analytics has emerged as the definitive standard for 2026, offering the precision required for high-stakes commercial decisions.
How AI People Counters Automate the Calculation
Modern sensors like the FootfallCam Pro2 eliminate the need for manual oversight by using 3D stereoscopic vision. These devices distinguish path direction with high precision, allowing them to count entries and passers-by simultaneously. Wide Dynamic Range (WDR) technology is particularly vital for Australian storefronts, as it manages the intense glare and deep shadows common in our high-street environments. This ensures that data remains accurate regardless of lighting conditions. Once captured, this information streams in real-time to your analytics dashboard, providing instant updates to your KPIs and allowing for immediate operational adjustments.
Privacy and Compliance in Australia
Data collection must always balance utility with responsibility. In Australia, all retail analytics must align with the Privacy Act 1988 to protect consumer rights. High-quality AI sensors prioritize Video Content Analysis (VCA), which processes movement patterns anonymously without ever recording personal identifiers or using facial recognition. This approach ensures compliance while building customer trust. By focusing on the narrative of movement rather than individual identity, you gain the strategic insights needed for growth without compromising the ethical standards expected in the Australian market.

Benchmarking and Improving Your Capture Rate
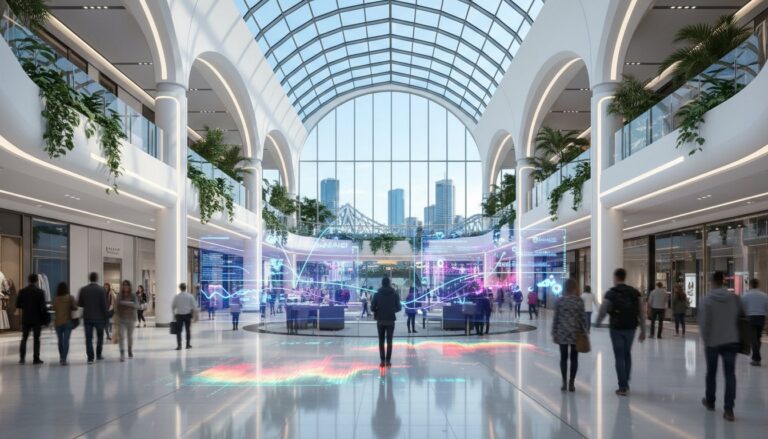
Once you’ve established how to calculate store capture rate, the next phase involves contextualizing those figures against industry standards. A “good” capture rate is never a static number; it’s deeply dependent on your specific retail environment and sector. High-street locations across Australia often target benchmarks between 8% and 12%, as pedestrians in these areas usually exhibit higher shopping intent. Conversely, stores within major shopping centres might see capture rates between 2% and 5%. While these mall figures appear lower, they’re often balanced by a much larger denominator of total foot traffic.
Improving this metric requires a clinical focus on the “Stop and Stare” effect. Your storefront must act as a visual disruptor that breaks the steady rhythm of pedestrian movement. During major retail events like Christmas or EOFY sales, the denominator of passers-by surges significantly. If your capture rate declines during these periods, it indicates that your storefront isn’t effectively competing for attention amidst the seasonal noise. Using A/B testing for window displays allows you to isolate variables, such as lighting or specific product placements, to see which drives a measurable lift in entries.
Factors That Influence the Decision to Enter
The physical entrance creates a psychological barrier known as “threshold resistance.” High resistance occurs when a storefront feels uninviting, cluttered, or overly enclosed. Open-door psychology suggests that a transparent, unobstructed view into the store reduces this friction and encourages entry. Additionally, data suggests that dynamic digital signage often yields a higher capture rate than static displays because movement naturally draws the human eye. Minimizing these barriers ensures that your storefront translates passing interest into physical presence.
Integrating Capture Rate with Staffing Levels
Capture rate serves as an essential lead indicator for operational planning. By analyzing the flow of pass-by traffic, managers can predict “power hours” before they actually manifest as sales. If historical data shows that a surge in street traffic at 2:00 PM consistently leads to a spike in entries, you can align your retail staff optimisation strategy accordingly. This data-driven approach ensures you’re never understaffed during peak capture moments. To see how these insights can transform your store performance, view our full suite of retail analytics tools.
Implementing a National Strategy with Footfall Australia
Managing a single storefront requires attention to detail, but overseeing a national retail network demands a unified analytical framework. While individual store managers may understand how to calculate store capture rate for their specific location, executive leadership requires a consolidated view to identify systemic trends. Siloed data often leads to fragmented decision-making; a high capture rate in a Perth suburb may be driven by factors that could be replicated in a Sydney flagship if the data were visible on a single plane. Adopting a centralized platform ensures that every stakeholder, from regional managers to operations directors, relies on the same empirical evidence rather than local intuition.
FootfallCam V9 Software provides this necessary transparency. It allows for sophisticated cross-store benchmarking, enabling you to rank locations not just by total sales volume, but by their efficiency in capturing available street traffic. This high-level visibility reveals which storefronts are underperforming relative to their specific local environment, allowing for targeted interventions in visual merchandising or staffing. Professional support from a specialized partner ensures that your data remains accurate across every node in the network, maintaining the integrity of your national KPIs through consistent calibration and monitoring.
The Footfall Australia Advantage
Achieving consistent data quality across a geographically dispersed network requires local expertise and robust infrastructure. Footfall Australia provides comprehensive national coverage for the installation and maintenance of high-precision sensors, ensuring that your hardware remains operational in every territory. For retailers burdened by outdated or inaccurate infrastructure, the Legacy Swap Out Plan offers a structured path to modernize aging systems without disrupting daily operations. This local presence is essential for maintaining the sophisticated people counting technology required to accurately distinguish between passers-by and genuine entries across diverse storefront designs.
Future-Proofing Your Retail Analytics
The transition from raw numbers to actionable business intelligence is a journey of scaling. As your business grows, your analytics must scale with it, moving beyond the fundamental question of how to calculate store capture rate toward deeper operational integrations. Modern systems allow you to merge footfall data with existing ERP systems to create a holistic view of the customer journey. This integration transforms captured traffic into a predictable pipeline for revenue growth, allowing you to justify expansion and investment based on hard evidence. By future-proofing your analytics today, you ensure that your physical environments remain resilient against shifting behavioral trends. To begin optimizing your storefront performance with a data-driven strategy, enquire about a FootfallCam solution for your business today.
Transform Your Storefront into a Data-Driven Growth Engine
Mastering the capture rate is the first step toward reclaiming the thousands of missed opportunities passing your storefront daily. You’ve seen that moving beyond manual counting and understanding how to calculate store capture rate with precision AI sensors transforms your physical threshold from a blind spot into a measurable asset. The right technology and benchmarking reveal the true ROI of your merchandising and staffing investments, providing the clarity needed for long-term success.
Footfall Australia brings over 20 years of experience to the local market, providing proprietary AI hardware that delivers 99.5% accuracy. With our national support and maintenance plans, your data remains reliable across every location in your network. It’s time to stop relying on intuition and start making decisions backed by empirical evidence. Optimise your store performance with Footfall Australia and ensure your retail environment is prepared for the shifting trends of 2026. The path to sustained growth begins with the data you capture today.
Frequently Asked Questions
What is a typical capture rate for a retail store in Australia?
Typical capture rates in Australia vary based on the specific retail environment. High-street locations generally target benchmarks between 8% and 12% because pedestrians in these areas often exhibit higher shopping intent. In contrast, major shopping centres typically record capture rates between 2% and 5%. While mall percentages appear lower, they are usually supported by a significantly higher volume of total foot traffic, balancing the overall entry count.
Can I calculate capture rate without specialized hardware?
You can attempt to calculate this metric manually using tally counters, but the process is prone to significant human error. It requires staff to monitor both the street and the entrance simultaneously; this is labor-intensive and often inaccurate during peak periods. Understanding how to calculate store capture rate accurately requires automated sensors to ensure the empirical evidence used for your strategy is reliable, unbiased, and continuous.
How does weather affect store capture rates?
Weather impacts both the denominator of passers-by and the final capture rate. In Australian high-street environments, heavy rain typically reduces the total number of pedestrians, though it may temporarily increase the capture rate as people seek shelter inside. Conversely, extreme heat often drives traffic toward air-conditioned shopping centres. Monitoring these fluctuations helps you distinguish between a change in consumer behavior and a genuine shift in your storefront’s appeal.
Is capture rate more important than conversion rate?
Neither metric is more important; they measure different stages of the retail funnel. Capture rate is the gatekeeper that determines how many prospects enter your space, while conversion rate measures the sales team’s efficiency once they’re inside. Learning how to calculate store capture rate allows you to diagnose if a sales slump is caused by poor storefront attraction or internal service issues. Both metrics must be analyzed together for a complete performance overview.
How accurate are AI people counters for measuring street traffic?
Modern AI people counters, such as the FootfallCam Pro2, achieve accuracy levels of approximately 99.5%. These devices use 3D stereoscopic vision to distinguish between adults, children, and objects like strollers. They accurately track path direction, which is essential for separating pedestrians who stay on the sidewalk from those who cross the threshold. This precision ensures that the data used for your calculations is a true reflection of human behavior.
Does capture rate include people who enter but don’t buy anything?
Yes, capture rate includes every individual who enters the store, regardless of whether they make a purchase. This metric focuses strictly on the effectiveness of your physical storefront and its ability to attract interest from the street. It is the primary indicator of your “stop and stare” appeal. Once a visitor is captured, the responsibility for the transaction shifts to your floor staff and product assortment, which is then measured by your conversion rate.
How often should I review my store’s capture rate data?
You should review capture rate data on multiple levels to maintain operational efficiency. Daily reviews help managers align staffing with immediate traffic surges, while weekly and monthly analysis is necessary for evaluating the success of window displays or marketing campaigns. Consistent monitoring allows you to identify seasonal patterns and the long-term ROI of visual merchandising. Real-time dashboards make it possible to adjust storefront tactics quickly if you notice a sudden dip.
What is the difference between capture rate and attraction rate?
In most retail analytics contexts, these terms are used interchangeably. Both refer to the percentage of passers-by who enter a physical location. However, capture rate is the more common industry-standard term used in technical reporting and software dashboards. Some consultants use attraction rate to specifically describe the effectiveness of a window display’s ability to make people stop and look, even if they don’t immediately cross the threshold into the store.