What is Customer Flow Analysis? A Strategic Guide to Physical Space Analytics
What if you could see exactly why visitors bypass your most expensive displays without a second glance? Most managers recognize that certain areas of their physical space underperform, yet they lack the empirical evidence to justify a layout change. Relying on intuition often results in persistent dead zones and inefficient staffing during peak periods. To solve these challenges, you must first define what is customer flow analysis and understand how it serves as the strategic bridge between raw movement and actionable insight.
You’re likely looking for ways to turn foot traffic into measurable growth. This guide demonstrates how customer flow analysis transforms raw movement data into actionable strategies to optimise your layout, staffing, and revenue. We’ll explore how modern 3D vision systems, which now achieve accuracy rates over 98 percent, provide the clarity needed to enhance visitor experiences and reduce friction. By the end of this article, you’ll understand how to bridge the gap between counting how many people enter and understanding exactly how they move to improve sales conversion rates and operational efficiency.
Key Takeaways
- Understand what is customer flow analysis and how it moves beyond simple footfall volume to map the actual behavioral sequences of your visitors.
- Learn how AI-driven 3D sensors accurately distinguish between different visitor types and objects to ensure your data is clean and reliable.
- Identify high-traffic paths and dwell zones to strategically place high-margin products where they’re most likely to be seen and purchased.
- Align your staffing levels with the precise movement patterns of your facility to reduce operational waste and improve the visitor experience.
- Discover how an integrated ecosystem of hardware and software provides a scalable solution for managing multi-site analytics across Australia.
Defining Customer Flow Analysis for Physical Spaces
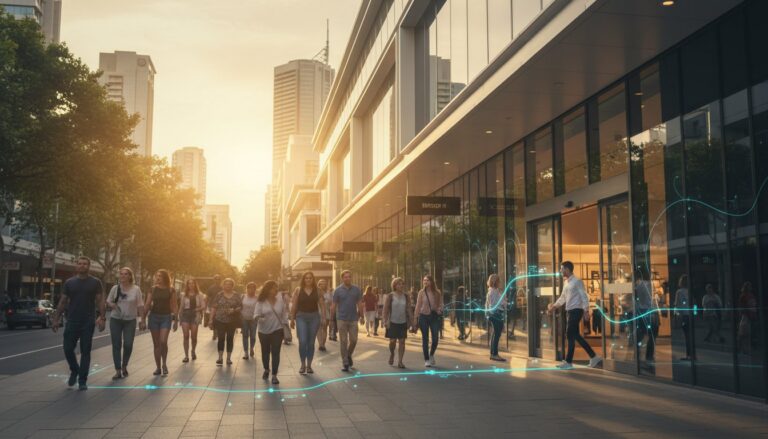
Understanding the nuances of visitor behavior requires moving beyond simple entry totals. To answer what is customer flow analysis, one must look at it as the systematic tracking and interpretation of visitor movement patterns within a physical environment. While traditional people counting provides the “how many,” flow analysis provides the “how” and the “why.” It treats physical presence as a sequence of human actions rather than just a static statistic, allowing managers to see the narrative of movement throughout their space.
This methodology effectively serves as Google Analytics for the real world. Just as a digital marketer tracks a user’s path through a website, facility managers use flow data to visualize the journey from the entrance to the point of transaction. This transition from intuitive, “gut-feeling” management to an evidence-based spatial strategy allows for precise, logical adjustments. Much of this analytical foundation is built upon Crowd simulation technology, which helps interpret how groups move and interact within confined spaces to predict future behavioral trends.
The Core Objectives of Flow Analysis
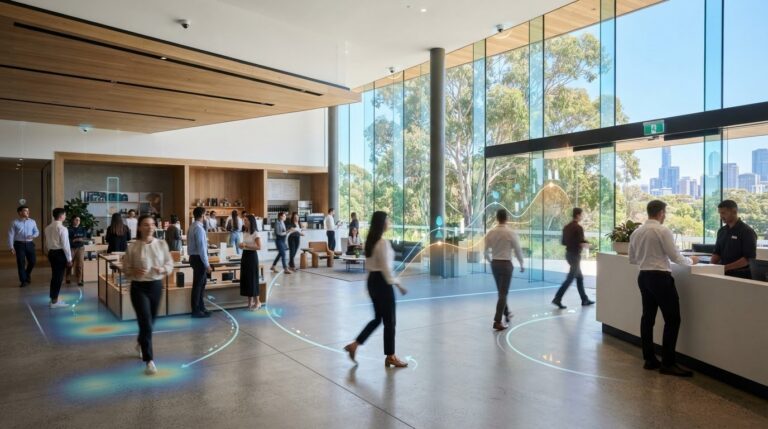
Strategic experts use these metrics to achieve three primary goals. First, they identify high-traffic “hot zones” where engagement is naturally high, alongside underutilised “dead zones” that fail to attract attention. Second, they map the typical customer journey to find where visitors hesitate, stall, or lose interest. Finally, this data measures the direct impact of spatial marketing. If a high-visibility sign doesn’t change the pathing of your visitors, the data provides the empirical evidence needed to pivot your strategy without relying on guesswork.
Digital vs. Physical Flow: A Critical Comparison
While the logic remains consistent between online and offline environments, the metrics adapt to the physical world. A digital “bounce rate” translates to an “entrance rate” or “turn-in rate” in a physical store; this measures the percentage of people who walk past versus those who cross the threshold. Friction also manifests differently. Digital friction might be a broken link or a confusing menu; physical friction is a bottlenecked aisle or a poorly placed checkout counter. Because humans don’t move in linear clicks, accurately capturing these nuances requires specialized people counting technology. These systems use 3D vision to filter out non-customer movements, ensuring the data you use to make decisions is both accurate and actionable.
The Technology Behind Movement Tracking
Tracking movement has evolved significantly from the days of simple infrared beams. While those older systems could detect a break in a light path, they couldn’t distinguish between a group of people or a single person carrying a large object. Modern technology has moved toward sophisticated 3D stereoscopic vision. This shift is fundamental to understanding what is customer flow analysis in a modern context, as it allows for the granular data collection required for complex behavioral mapping. It’s no longer about simple tallies; it’s about interpreting the human narrative within a space.
Today’s AI-driven sensors do more than count; they interpret. By utilizing dual lenses to mimic human depth perception, these systems distinguish between adults, children, and inanimate objects like shopping trolleys or strollers. This level of detail prevents the inflation of footfall numbers and ensures that the data reflects actual purchasing potential. Crucially, this is achieved through privacy-by-design. These sensors process movement paths locally without capturing personally identifiable information (PII). This ensures compliance with the Australian Privacy Principles while maintaining operational transparency and visitor trust.
3D Stereoscopic Vision and AI
Dual-lens systems are the backbone of high-accuracy tracking. By calculating depth, these sensors achieve accuracy rates exceeding 98 percent, even in challenging environments. AI algorithms play a vital role here by filtering out “non-customer” movements. For instance, staff members or security personnel can be excluded from the data based on height or specific movement patterns, ensuring the analytics focus solely on visitor behavior. This precision makes 3D sensors essential for facilities with high ceilings or wide-span entrances where traditional sensors often fail. If you’re looking to upgrade your current monitoring, you can explore our full range of hardware solutions to find the right configuration for your space.
FootfallCam Pro2: The Industry Standard
The FootfallCam Pro2 has emerged as a primary tool for dedicated flow analysis. It combines Power over Ethernet (PoE) connectivity with wide-angle coverage, allowing for seamless installation and comprehensive area monitoring. Because it utilizes edge computing, the device processes data on the unit itself before sending it to the cloud-based FootfallCam V9 software. This reduces bandwidth usage and enhances data security. For businesses with existing analog or IP infrastructure, the FootfallCam Centroid acts as an integration hub, turning standard camera feeds into intelligent movement sensors without requiring a complete hardware overhaul.
Key Metrics in Customer Flow Analysis
Data is only valuable if it leads to specific, positive changes in operations. To truly understand what is customer flow analysis, you must look at the specific metrics that translate human movement into strategic intelligence. These metrics provide the empirical evidence needed to move beyond guesswork and start making decisions based on how people actually interact with your environment. By measuring these sequences of actions, you can identify exactly where your space succeeds and where it creates friction.
- Dwell Time: This measures the duration of engagement in specific zones. It helps you distinguish between a customer who is simply passing through and one who is actively considering a purchase.
- Pathing: Visualising the most common routes taken through a facility reveals whether your layout effectively guides visitors toward high-margin items or creates unintentional bottlenecks.
- Entrance Rate (Capture Rate): This is the ratio of passers-by to actual visitors. It’s a critical KPI for evaluating the effectiveness of your location and outward-facing branding.
- Turn-in Rate: While similar to the capture rate, this specifically evaluates the draw-power of window displays or seasonal signage. It tells you exactly which visual cues successfully pull people inside.
- Cross-Shopping: Analysing the flow between different departments allows you to understand product affinity. If visitors frequently move between two distant sections, you might consider repositioning them to improve convenience.
In niche retail sectors like golf clubhouses, this analysis helps determine if members are engaging with high-margin custom goods. To see examples of products that drive this type of interaction, explore Personalised Golf Ball Markers and consider how their strategic placement can influence the member journey.
The Power of Heat Mapping
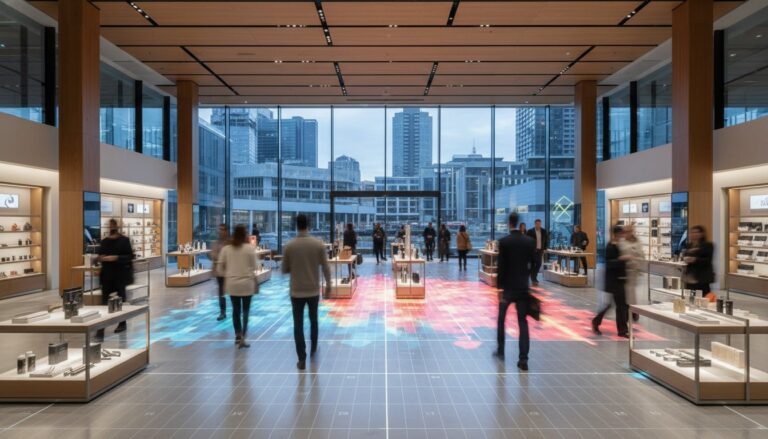
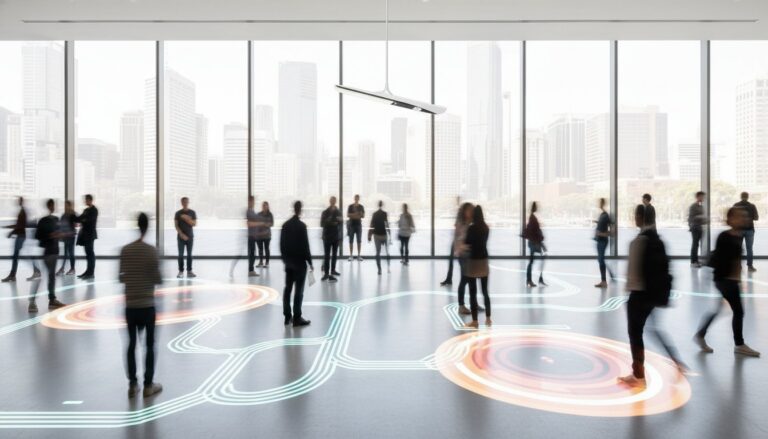
Heat mapping provides a visual representation of traffic density. It’s an essential tool for identifying neglected areas that aren’t generating a return on their square footage. By comparing real-time data against historical trends, managers can validate “prime real estate” within a store. If a high-rent end-cap display shows low heat on the map, it’s a clear signal that the placement or the product isn’t resonating. This visual evidence allows for rapid, seasonal adjustments to floor plans without waiting for end-of-month sales reports to identify a problem.
Analysing Queue Behaviour
Queueing is often the final friction point in a visitor’s journey. By measuring queue length and average wait times, you can identify the “abandonment point.” This is the specific moment a customer decides to leave the queue without completing their transaction. Modern flow analysis uses predictive data to forecast these surges. Instead of reacting to a long line after it has already formed, you can optimise checkout staffing based on the number of people currently moving through high-intent zones. This proactive approach reduces walk-aways and ensures the experience remains fluid until the moment they exit.

Turning Insights into Operational ROI
Data serves little purpose if it remains static on a dashboard. The transition from observation to optimization is where businesses realize a tangible return on investment. When stakeholders ask what is customer flow analysis, the most compelling answer is that it’s a mechanism for reducing operational waste and maximizing revenue per square meter. By aligning physical space with actual human behavior, management moves from a reactive stance to a proactive strategy. This is essential in a landscape where retail sales are expected to grow by 4.4 percent in 2026; capturing that growth requires absolute efficiency.
Marketing validation becomes a precise science through flow-through metrics. Instead of guessing the success of an in-store activation, you can measure exactly how many visitors the event pulled into specific departments. If a promotional display increases entry volume but fails to push traffic toward high-margin zones, the data allows for immediate correction. Similarly, safety and compliance are streamlined. Managing occupancy limits in real-time and identifying potential bottlenecks near emergency exits ensures you meet regulatory standards without relying on manual headcounts or guesswork.
Staff Optimisation and Labour Costs
Staffing levels should mirror the rhythm of your visitors. By using historical flow data, managers can create predictive schedules that align labor hours with peak traffic periods. This approach reduces labor waste during “dead zones” without compromising service quality. It also allows you to identify your “Power Hour,” those specific windows where conversion opportunities are at their highest. Ensuring your most experienced staff are on the floor during these high-intensity peaks directly correlates to improved sales performance and a more fluid visitor experience.
Data-Driven Store Layouts
Physical environments are not static; they should evolve based on how people use them. You can test “A/B” layouts by monitoring changes in customer pathing after moving a display or changing an aisle configuration. This ensures that destination items, such as milk or bread in a grocery setting, effectively pull traffic through the entire space to expose visitors to more products. Applying retail footfall analysis allows you to maximize the value of every square metre, ensuring no part of your facility is underutilized. With global AI spending forecasted to exceed $2 trillion in 2026, the tools to achieve this level of precision are more accessible and powerful than ever before.
If you are ready to transition from intuition to evidence-based management, you can request a consultation with our strategy team to discuss a tailored analytics framework for your facility.
Implementing a Flow Analysis Strategy with Footfall Australia
Execution requires more than just high-end sensors. It requires a partner capable of managing complex, multi-site deployments across the country. Footfall Australia provides this infrastructure, ensuring that once you understand what is customer flow analysis, you have the technical means to apply it consistently. Our integrated ecosystem combines FootfallCam Pro2 hardware with the V9 software suite, creating a seamless pipeline from the ceiling-mounted sensor to the executive dashboard. This unified approach eliminates the friction often found when trying to stitch together disparate hardware and software solutions.
Maintaining data integrity over the long term is a critical component of any analytics strategy. We offer structured Basic and Premium Support Plans to ensure that your devices remain calibrated and your reporting remains accurate. This ongoing commitment to system health means that your strategic decisions are always based on reliable, current information. In an era where data privacy is paramount, our systems are designed to be transparent and compliant with Australian regulations, giving you the confidence to scale your analytics without compromising visitor trust.
Scalable Solutions for Every Industry
Every physical environment has unique constraints. A boutique store in Melbourne faces different challenges than a major transport hub or a national museum. We customize dashboards to align with specific organisational KPIs, ensuring that the information you see is directly relevant to your operational goals. By leveraging local expertise, we support large-scale national rollouts, maintaining data integrity across hundreds of locations simultaneously. This scalability ensures that as your organization grows, your ability to interpret what is customer flow analysis grows with it.
The FootfallCam V9 Analytics Advantage
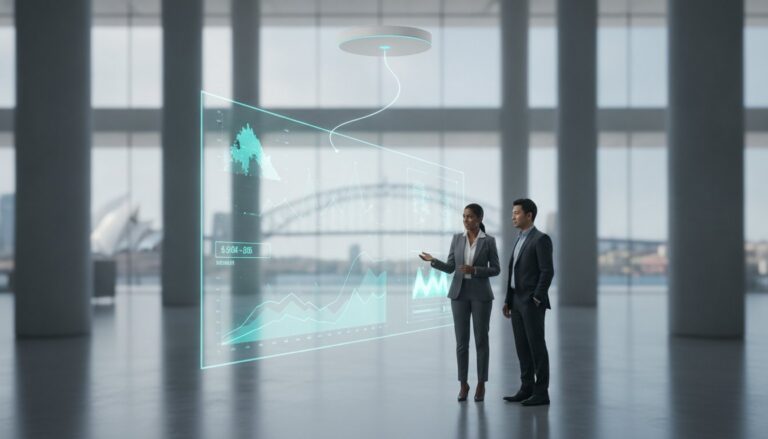
The true power of our system lies in the FootfallCam V9 software. It simplifies complex datasets by transforming raw counts into actionable footfall data analysis. This platform doesn’t just report on volume; it provides real-time alerts and automated reporting to help manage occupancy limits and safety protocols. By integrating with existing sales records, the software calculates true conversion rates. This allows you to see the direct relationship between visitor movement patterns and actual revenue growth, empowering your team to make decisions with quiet confidence.
Future-Proofing Your Facility with Behavioral Intelligence
Implementing these insights requires a partner with the technical depth and local infrastructure to support your growth. With over 20 years of expertise in the Australian market, Footfall Australia delivers proprietary AI-driven FootfallCam technology backed by comprehensive national support and maintenance plans. This ensures your data remains accurate and actionable for the long term. Optimise your space with Footfall Australia’s advanced analytics solutions.
Your physical space holds untapped potential that only precise, objective data can unlock. Start making decisions with the quiet confidence that comes from evidence-based strategy.
Frequently Asked Questions
What is the difference between people counting and customer flow analysis?
People counting measures the total volume of visitors entering a space, whereas customer flow analysis interprets the specific sequence of movements once they are inside. While entry totals provide a high-level KPI, flow analysis reveals dwell times, pathing, and zone engagement. To understand what is customer flow analysis, you must look at how it transforms raw footfall into a narrative of human behavior that simple tallies cannot detect.
Is customer flow analysis GDPR and Australian Privacy Act compliant?
Our systems are fully compliant with the Australian Privacy Act and global standards like GDPR through a privacy-by-design approach. The hardware processes movement data locally, converting human presence into anonymous vector coordinates. No personally identifiable information (PII) or facial features are captured or stored, ensuring that your data collection is both transparent and ethically sound while protecting visitor anonymity.
How accurate is the pathing data in a crowded environment?
High-density environments require 3D stereoscopic vision to maintain data integrity. By mimicking human depth perception with dual lenses, the sensors distinguish between individual visitors even when they are walking in close proximity. This technology achieves accuracy rates exceeding 98 percent, providing reliable pathing data in busy retail environments, museums, or transport hubs where traditional infrared or 2D sensors often fail.
Can I use my existing CCTV cameras for customer flow analysis?
You can integrate existing CCTV infrastructure using the FootfallCam Centroid. This processing hub applies AI-driven analytics to standard IP camera feeds, turning them into intelligent movement sensors. While dedicated 3D hardware offers the highest accuracy for complex flow mapping, the Centroid provides a cost-effective way to gain behavioral insights from your current security setup without requiring a complete hardware overhaul.
What industries benefit most from customer flow analysis?
Any physical space that relies on efficient visitor movement benefits from these insights. Retailers use it to optimize layouts, while shopping malls and museums apply it to manage occupancy and improve exhibition flow. Public transport hubs and smart cities also use these metrics to reduce congestion and enhance safety, demonstrating that understanding what is customer flow analysis is essential for any high-traffic environment.
How long does it take to see a return on investment from flow analytics?
Most organizations begin to see a return on investment within six to twelve months of implementation. This is typically achieved through immediate gains in staffing efficiency and the elimination of underperforming sections in the floor plan. By aligning operational costs with actual visitor behavior, the system pays for itself by reducing labor waste and identifying new opportunities to increase sales conversion rates.
Does the system require a constant internet connection to work?
The system doesn’t require a constant internet connection to count visitors or track movement. Sensors use edge computing to process data locally and can store several weeks of information in their internal memory. An internet connection is only necessary to upload these processed data packets to the cloud-based FootfallCam V9 software for remote reporting, dashboard visualization, and long-term analysis.
Can the software distinguish between staff and actual customers?
The software distinguishes between staff and customers through advanced AI filtering. By setting specific height thresholds or utilizing specialized staff exclusion tags, the system automatically removes employee movements from your conversion metrics. This ensures that your analytics reflect actual customer intent and purchasing behavior rather than the routine activities or security patrols of your on-site service team.