Footfall Conversion Rate: The 2026 Strategic Guide to Retail Efficiency
While the average online retail conversion rate sits at a modest 2.4 percent, specialty physical stores in 2026 are achieving benchmarks between 20 percent and 40 percent. It’s a staggering difference that highlights why your physical space remains your most valuable asset, yet many retailers still struggle to justify marketing spend when high traffic doesn’t lead to sales. You likely know the frustration of seeing a crowded floor that fails to move the needle on revenue, or staffing schedules that feel like guesswork during peak hours.
This strategic guide will help you master your footfall conversion rate, moving beyond intuition to a model where every store layout change and staffing decision is backed by empirical evidence. We’ll provide a clear formula to measure store performance and actionable strategies to increase the percentage of buyers in your aisles. By the end of this article, you’ll have a reliable way to benchmark different store locations accurately, using high-quality data to bridge the gap between raw traffic and sustainable revenue growth.
Key Takeaways
- Learn the precise formula to measure your footfall conversion rate and why high-accuracy AI counters are essential for reliable retail diagnostics.
- Identify how to use conversion data to pinpoint operational gaps in staffing levels, product placement, and store environment.
- Implement dynamic staffing strategies that align your workforce with historical traffic peaks to capture every sales opportunity.
- Optimise your store’s path to purchase by removing physical friction and testing layout changes with empirical evidence.
- Future-proof your operations by integrating FootfallCam Pro2 hardware with V9 software for a unified, high-accuracy reporting system.
Defining Footfall Conversion Rate in the Modern Retail Landscape
Retail success is often measured by the ringing of the till, but revenue is a trailing indicator that frequently masks operational inefficiency. To truly understand the health of a store, we must look at the footfall conversion rate. This metric represents the percentage of total visitors who transition from being potential browsers to paying customers. It’s the ultimate Key Performance Indicator (KPI) for physical stores because it isolates how well your store environment, staff, and products perform once a customer crosses the threshold.
Marketing teams often claim victory when foot traffic increases, but if those visitors don’t buy, the marketing spend has failed to deliver a return. Conversion is an operational success metric. It measures the effectiveness of your floor layout, the availability of your stock, and the engagement levels of your sales team. When these elements align, the conversion rate climbs. When they don’t, you face a widening ‘Opportunity Gap’. This gap represents the revenue left on the table from non-converting visitors. Revenue alone is a vanity metric; it tells you what you earned, but it never tells you what you could have earned if your operations were optimized.
Why Footfall Data is Only Half the Story
Relying solely on Point-of-Sale (POS) data is like reading a book with every second page missing. You see the final result, but you miss the narrative of the customer journey. Footfall data provides the essential denominator for every meaningful retail metric, allowing you to see the footfall conversion rate in context. Without knowing how many people entered, you can’t determine if a sales dip was caused by low traffic or poor in-store performance. The Power Ratio is the direct correlation between the volume of entrants and the resulting transaction count, serving as a pulse check for store vitality.
The Emotional Impact of High Traffic, Low Conversion
Constant movement in a store doesn’t always equate to productivity. When staff handle high volumes of ‘window shoppers’ without seeing sales results, it leads to burnout and a sense of futility. This frustration often stems from an inability to justify staffing levels during peak periods. Identifying the path of these non-buyers shifts management from frustrating intuition to evidence-based strategy. It allows you to address why people leave empty-handed, whether it’s due to long queues or a lack of floor assistance. Moving toward a data-driven model provides the quiet confidence that your team is positioned exactly where they are needed most.
The Calculation Framework: How to Measure Conversion Accurately
Quantifying store performance requires a precise mathematical approach. The standard formula for calculating your footfall conversion rate is straightforward: (Number of Transactions ÷ Total Footfall) x 100. While the math is simple, the integrity of the result depends entirely on the quality of the raw data. This calculation has become an official business metric used to distinguish between a store that is merely busy and one that is truly productive. To obtain a reliable figure, you must ensure that your denominator—the total footfall—is free from environmental noise and non-buying behavior.
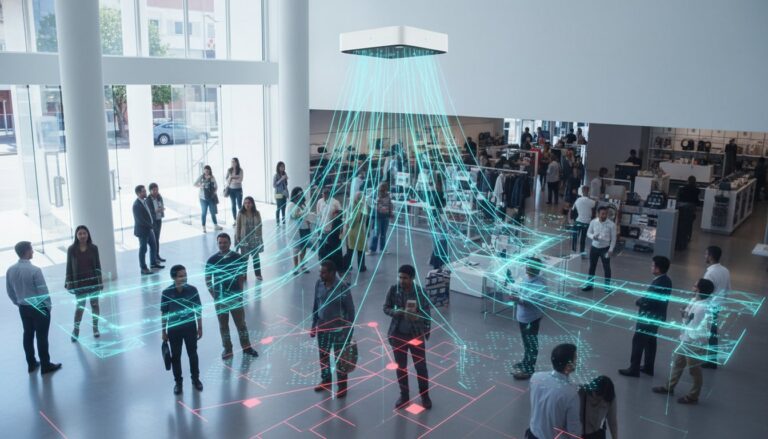
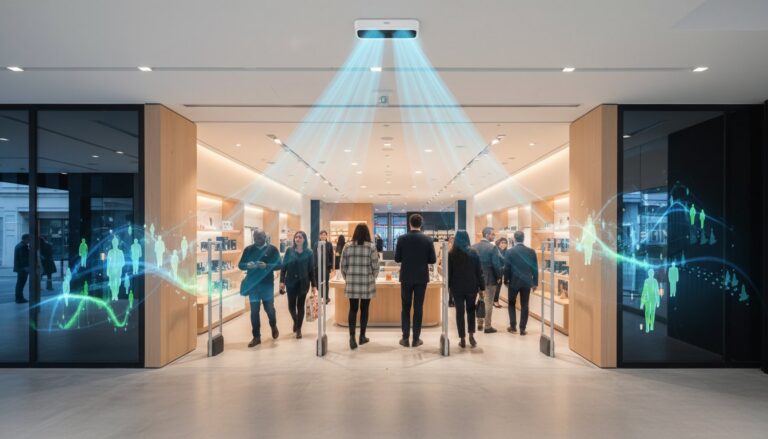
High-accuracy hardware is the first requirement for a clean dataset. Devices like the FootfallCam Pro2 use AI-driven 3D stereoscopic vision to achieve 99.5% accuracy, which is essential when even a 2% margin of error can lead to incorrect staffing decisions. Beyond raw numbers, your system must apply sophisticated logic to filter out anomalies. Staff filtering is a critical feature; without it, every time an employee enters or exits the floor, your conversion rate artificially drops. Similarly, group counting logic identifies families or couples as a single ‘buying unit’. A family of four entering a store usually represents one purchase decision, not four. Counting them as four individuals would skew your data, making your performance appear lower than it actually is.
Integrating POS Systems with People Counters
The true value of traffic data emerges when it’s merged with transaction records. FootfallCam V9 Software automates this technical handshake, pulling data from your Point-of-Sale system via API or secure CSV uploads. This integration eliminates the need for manual data entry, providing a real-time view of store health. For national retailers, ensuring data synchronisation across different Australian time zones is vital. V9 software manages these offsets automatically, allowing managers in Sydney to compare Western Australian store performance without manual adjustments. If you’re still using outdated beam counters, consider a Legacy Swap Out Plan to upgrade your hardware and start capturing integrated sales data.
Common Data Pitfalls to Avoid
Accuracy often suffers when ‘Passer-by’ traffic is included in the count. Sophisticated AI sensors define a clear ‘exclusion zone’ to ensure that people walking past the entrance aren’t counted as visitors. Another common pitfall is failing to account for returns and exchanges. A high volume of returns can create a spike in transactions that doesn’t reflect actual sales growth, momentarily inflating your daily conversion rate. To avoid these distortions, focus on long-term trend analysis rather than point-in-time snapshots. Trends reveal the underlying operational health of the store, smoothing out daily fluctuations caused by seasonal returns or temporary local events.
Diagnosing Retail Issues Through Conversion Rate Analysis
A healthy footfall conversion rate serves as a high-resolution diagnostic for your entire operation. While revenue fluctuates based on seasonal trends, conversion stability indicates whether your internal pillars—Staff, Product, and Environment—are functioning as intended. Research from May 2026 indicates that specialty retail conversion rates typically range from 20% to 40%, providing a clear benchmark for success. A common red flag for managers is the ‘Peak Hour Dip’, where visitor numbers surge but transaction counts remain flat. This suggests your store has hit a service ceiling, where potential buyers are discouraged by long queues or unavailable assistants. By performing a retail footfall analysis in Australia, you can identify these friction points that prevent traffic from becoming revenue.
Comparing performance across different days of the week reveals operational inconsistencies that revenue figures often hide. If your conversion rate is significantly higher on a Tuesday than on a Saturday, the problem isn’t your product or your marketing; it’s likely your ability to scale operations to meet demand. This data-driven approach removes the guesswork from management, allowing you to address specific store locations that are underperforming relative to their traffic potential. It transforms the store floor from a chaotic environment into a controlled space where every movement is understood and every opportunity is quantified.
Staffing vs. Conversion: The Critical Correlation
Staffing levels must mirror human movement to be effective. Calculating the optimal staff-to-customer ratio requires looking at how many customers your team can effectively manage before ‘abandoned baskets’ become a trend. Understaffing during peak footfall doesn’t just lose a single sale; it damages long-term brand perception. Using data to reward shifts with high conversion rates fosters a culture of efficiency. It acknowledges the team’s ability to maximize the value of every visitor who walks through the door, regardless of the total traffic volume. This shift in focus ensures that your most capable staff are scheduled when the opportunity for conversion is highest.
Layout and Merchandising Bottlenecks
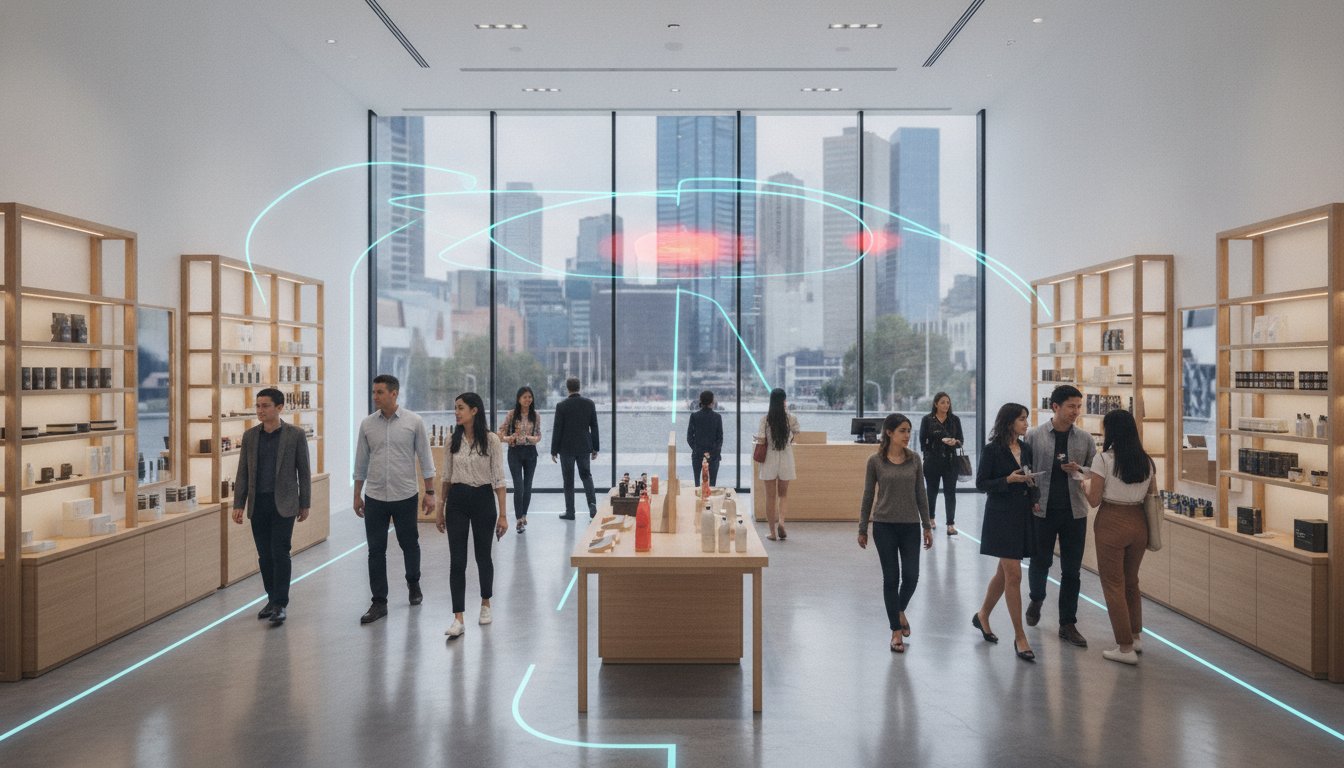
Physical friction is a silent conversion killer. High traffic in a specific aisle means nothing if the footfall conversion rate for that zone is zero. These ‘Dead Zones’ often indicate that while the product is visible, it isn’t accessible or compelling enough to trigger a purchase. AI-driven dwell time data adds another layer of insight. If customers spend ten minutes in a section but leave empty-handed, they might be confused by the layout rather than engaged with the merchandise. Measuring the ‘Capture Rate’—the percentage of passers-by who enter—against the final conversion rate allows you to see if your window displays are attracting the right demographic or simply driving curious but non-buying traffic.
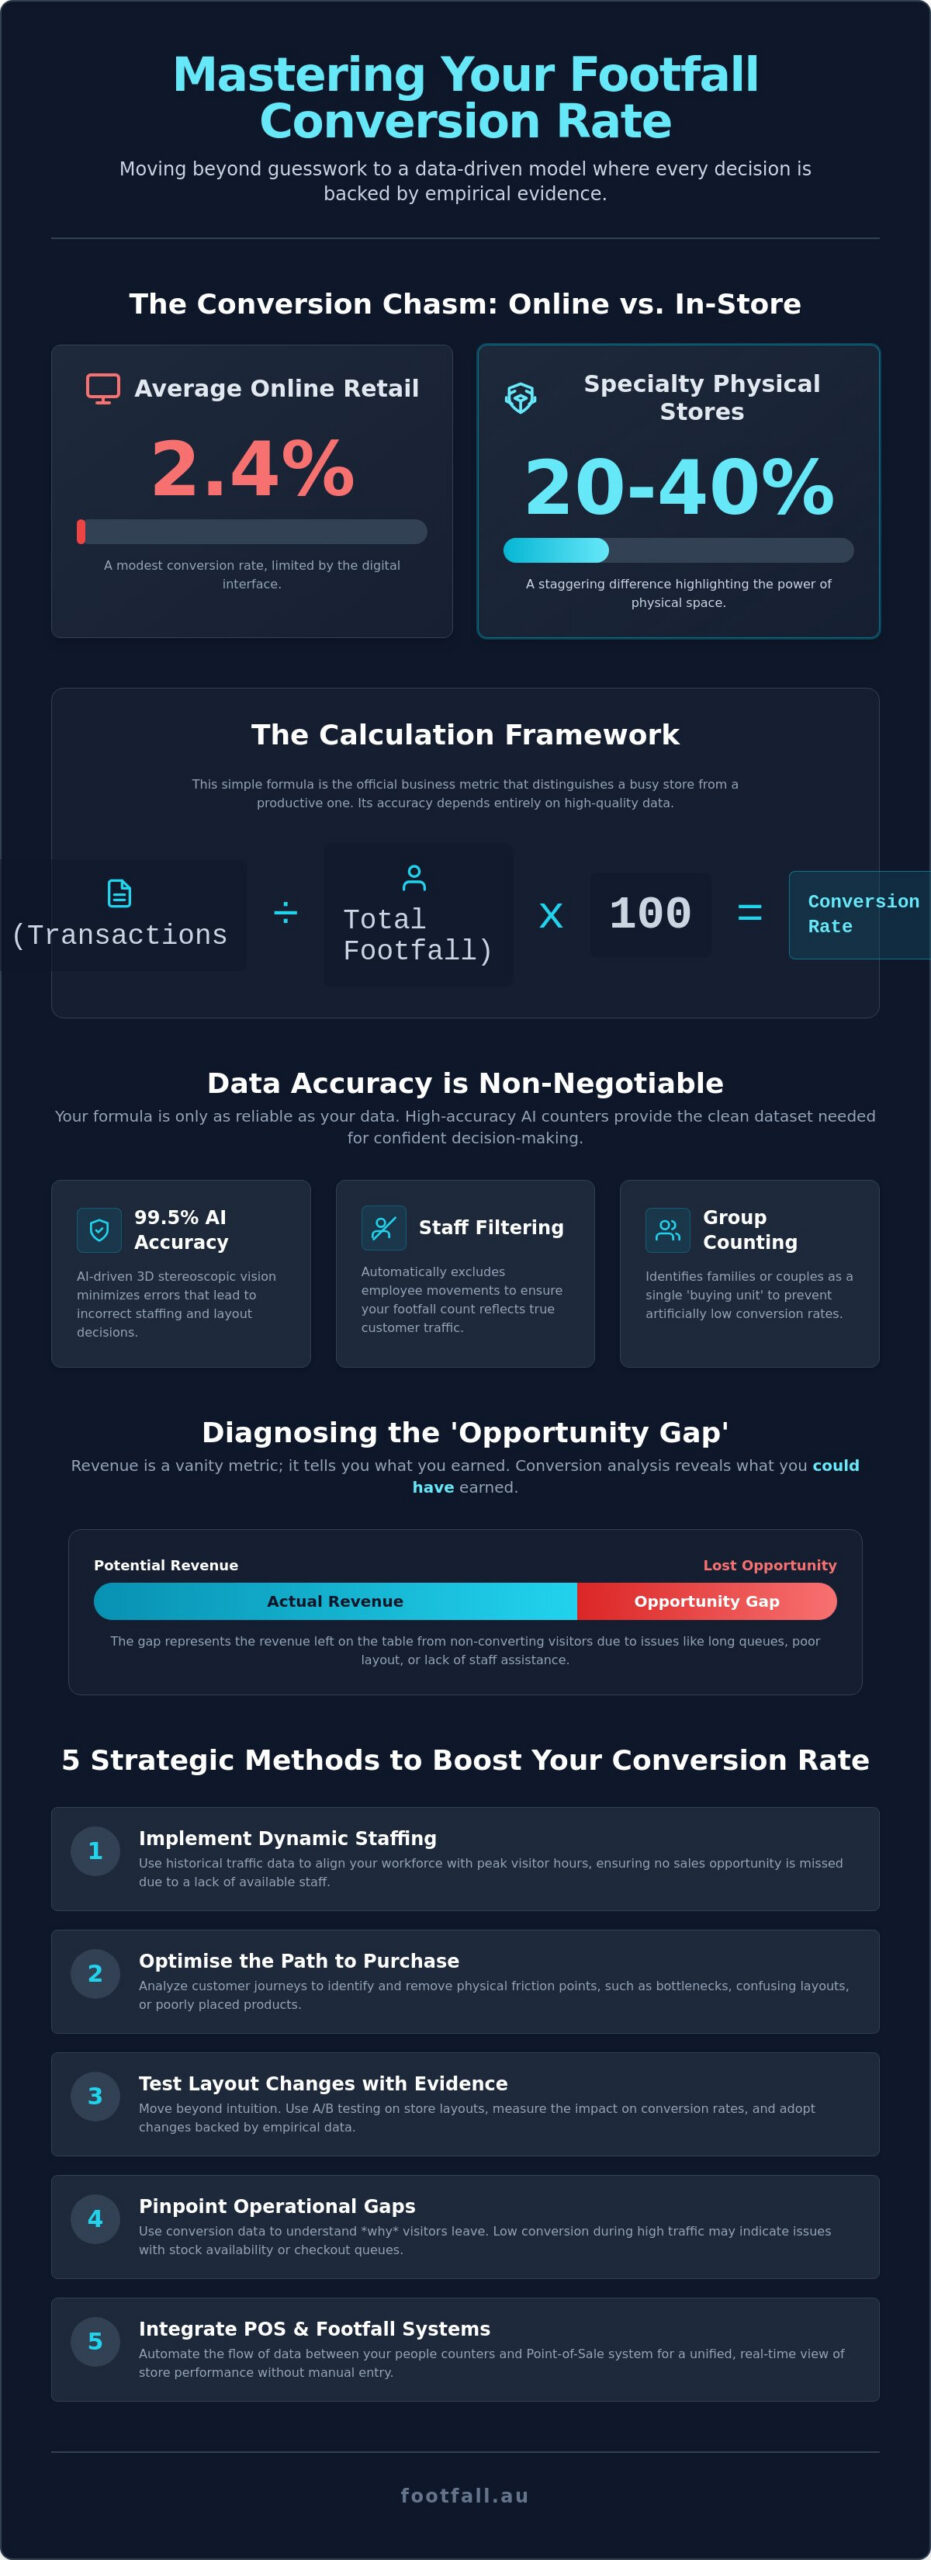
5 Strategic Methods to Improve Your Footfall Conversion Rate
Improving your footfall conversion rate requires a transition from reactive management to proactive optimization. By treating the store floor as a dynamic ecosystem, you can implement targeted changes that directly influence buyer behavior. These strategies focus on removing the friction that exists between a visitor entering your space and completing a transaction. Success in 2026 relies on your ability to act on data while the customer is still in the building, rather than reviewing failures at the end of the month.
- Implement Dynamic Staffing: Align your workforce with historical traffic patterns rather than just sales results. This ensures that during peak periods, your staff-to-customer ratio is optimized to provide the assistance required to close sales.
- Optimise the Path to Purchase: Use movement data to identify and remove physical bottlenecks. A clear, intuitive layout reduces shopper fatigue and keeps the focus on the product.
- Active Queue Management: Monitor waiting times in real-time. High-accuracy sensors can alert managers when queues exceed a specific threshold, preventing ‘walk-outs’ at the most critical conversion point.
- Conversion-Focused Training: Train your team to recognize high-intent behaviors. During high-traffic windows, staff should prioritize engagement with customers who are already interacting with merchandise.
- Scientific A/B Testing: Treat your window displays as the top of your funnel. Test different visual themes and measure the direct impact on the percentage of passers-by who convert into buyers.
Refining the In-Store Experience
Creating dedicated ‘Service Zones’ for high-consideration products can significantly boost conversion. These zones provide a space for deeper engagement without the distractions of the main floor. You can use footfall data analysis to validate these layout changes, ensuring that new fixtures actually improve flow rather than creating fresh obstacles. Additionally, position Click and Collect counters away from high-traffic browsing areas. This prevents quick-service visitors from disrupting the journey of customers who are still in the discovery phase.
Leveraging Real-Time Alerts
Modern AI counters like the FootfallCam Pro2 do more than just count; they act as a live pulse for your store. When the staff-to-customer ratio exceeds a pre-defined threshold, the system can trigger immediate alerts to management. This allows for instant intervention, such as opening a new register or moving staff from the stockroom to the floor during an unexpected traffic surge. Real-time data prevents revenue leakage by surfacing operational friction before it results in a lost transaction. This level of agility ensures that you never miss a sales opportunity due to a temporary lack of resources.
To see how live data can transform your store’s performance, explore our integrated hardware and software solutions today.
Future-Proofing with Footfall Australia’s Integrated Solutions
Establishing a reliable footfall conversion rate requires a foundation of high-precision hardware. The FootfallCam Pro2 serves as this foundation, utilizing AI-driven 3D stereoscopic vision to deliver 99.5 percent accuracy. This level of precision is vital for Australian retailers who need to trust their data before committing to structural or operational changes. When your visitor counts are accurate to within half a percent, every subsequent calculation, from staffing ratios to marketing ROI, becomes an empirical fact rather than a best guess.
Data accuracy is only valuable if it’s accessible and actionable. FootfallCam V9 Software acts as the ‘Single Source of Truth’ for your organization, centralizing traffic data and transaction records into a single, intuitive interface. This integration allows you to observe the direct relationship between floor movement and revenue in real-time. To ensure these systems remain operational at peak performance, we provide a local partner network for national support and maintenance plans across Australia. For businesses currently hindered by outdated infrared sensors or basic IP cameras, our Legacy Swap Out Plan offers a structured path to upgrade your infrastructure without starting from scratch.
FootfallCam Centroid: AI Analytics Without New Cameras
For large-scale national rollouts, the FootfallCam Centroid provides a sophisticated alternative to full hardware replacement. This system repurposes your existing CCTV infrastructure by applying AI processing to current video feeds, enabling high-level conversion tracking without the need for new camera installations. It represents a significant cost-benefit for retailers with extensive footprints, allowing for the rapid deployment of advanced analytics. The Centroid is ideal for identifying complex human behaviors, such as path-to-purchase flows and zone engagement, across vast retail environments.
Next Steps for Your Business
Transitioning to a data-driven model begins with understanding the gaps in your current reporting. We recommend requesting a diagnostic audit of your existing traffic data to identify where inaccuracies might be skewing your footfall conversion rate. Our national experts are available to consult on complex POS integrations, ensuring your sales data and footfall metrics communicate seamlessly. For a deeper look at the technology driving these insights, consult the definitive guide to people counting systems Australia. Taking these steps ensures your business is prepared for the shifting behavioral trends of the 2026 retail landscape.
Mastering Operational Excellence in 2026
Transitioning from intuition to data-driven management is a critical requirement for modern retail success. By mastering your footfall conversion rate, you move beyond observing raw traffic to interpreting the human behavior that drives sustainable revenue. You now have the framework to calculate this metric with 99.5 percent accuracy, diagnose hidden operational bottlenecks, and implement dynamic staffing strategies that mirror your store’s natural movement. These insights empower you to make decisions with the quiet confidence that every change is backed by empirical evidence rather than guesswork.
Footfall Australia provides the specialized expertise required to bridge the gap between complex data and practical application. With over 20 years of experience in the Australian market, we offer seamless POS integration through our FootfallCam V9 Software and maintain a national support network to ensure your systems perform reliably. It’s time to replace uncertainty with a lexicon of measurement and evidence-based strategy. Maximise your store’s efficiency with a FootfallCam Pro2 solution and ensure your physical environment is prepared for the shifting trends of the future. Your store’s potential is best realized when every visitor is seen as a measurable opportunity for growth.
Frequently Asked Questions
What is a good footfall conversion rate for a retail store?
A specialty retail store typically achieves a footfall conversion rate between 20 percent and 40 percent as of May 2026. This benchmark varies by sector; luxury boutiques often see lower traffic with higher conversion, while high-volume convenience stores rely on rapid turnover. You should focus on your own historical baseline to measure improvement. Consistent growth in this metric indicates that your in-store operations are effectively capturing the value of your marketing traffic.
How does staff counting affect our conversion rate accuracy?
Staff counting negatively impacts your data by artificially inflating the denominator of your conversion calculation. Every time an employee enters or exits the floor, the system records a visitor, which lowers your reported efficiency. FootfallCam Pro2 counters use sophisticated AI filtering to exclude staff from the total count. This ensures your data reflects only genuine customer behavior, providing a reliable foundation for staffing and layout decisions.
Can we integrate our existing POS system with Footfall Australia counters?
Yes, Footfall Australia counters integrate with most modern POS systems through our proprietary FootfallCam V9 Software. We support multiple data synchronization methods, including direct API connections and secure CSV uploads. This integration is essential for automating the calculation of your conversion metrics. Our technical experts assist with the handshake between your transaction records and traffic data, creating a unified reporting environment that eliminates manual entry.
What is the difference between capture rate and conversion rate?
Capture rate measures the percentage of passers-by who enter your store, while conversion rate measures the percentage of those visitors who make a purchase. Capture rate is primarily a metric for window display effectiveness and street-level marketing success. In contrast, conversion rate is a diagnostic for in-store operational health. Understanding the distinction helps you identify whether your struggle lies in attracting traffic or closing sales once customers are inside.
How often should we review our footfall conversion data?
You should review high-level conversion data daily to identify immediate operational friction, such as staffing shortages during peak hours. Weekly reviews are better suited for identifying trends and the success of short-term promotions or layout changes. Monthly analysis provides the strategic oversight needed for long-term planning. This rhythmic approach ensures that data leads to specific, positive changes in your operations rather than just sitting in a report.
Does the FootfallCam Pro2 work in low-light or high-ceiling environments?
The FootfallCam Pro2 is engineered to maintain 99.5 percent accuracy in challenging environments, including low-light conditions and high ceilings. Its 3D stereoscopic vision technology creates a depth map of the entrance, allowing it to distinguish between humans and shadows or objects even in dim lighting. This hardware is the gold standard for accuracy, ensuring that environmental factors don’t distort your performance metrics or lead to incorrect strategic conclusions.
How do we calculate conversion rate for a service-based business like a library?
For service-based environments like libraries, conversion is measured by substituting sales transactions with specific engagement goals, such as book loans or event attendance. The formula remains (Goal Achievements divided by Total Visitors) multiplied by 100. This provides a clear metric for how effectively the space serves its community. By tracking these interactions, management can justify funding and optimize the placement of resources based on actual visitor behavior.
What is the ROI of improving our conversion rate by just 1%?
Improving your footfall conversion rate by just 1 percent can lead to a substantial increase in net profit without requiring any additional marketing spend. Since your fixed costs like rent and base staffing remain the same, the revenue from those additional sales flows directly to your bottom line. It’s often more cost-effective to optimize the visitors you already have than to pay for new traffic through expensive advertising campaigns.