Marketing Analytics for Retail in Melbourne: Bridging the Digital-Physical Divide
What if your most expensive digital ad spend is actually driving foot traffic to your competitor because you can’t see the final step of the customer journey? You already know that Melbourne’s retail landscape is one of the most competitive in the world. With prime floor space in the CBD or Chadstone often costing upwards of A$4,000 per square metre annually, every square inch must justify its existence. You’ve likely felt the frustration of seeing a spike in weekend visitors without knowing if your latest Instagram campaign or a local geo-fenced ad actually triggered the visit. This uncertainty makes it difficult to scale what works and cut what doesn’t.
This guide shows you how to implement advanced marketing analytics for retail Melbourne to bridge that gap. We’ll show you how to transform raw footfall data into a clear map of the customer journey, allowing you to link a specific digital click to a physical shop floor entry with over 95% accuracy. You’ll learn to distinguish between organic passers-by and campaign-driven visitors to ensure your marketing budget is invested in high-conversion human behavior. We’ll explore the strategic integration of spatial sensors and campaign data to turn your physical store into a measurable extension of your digital funnel.
Key Takeaways
- Eliminate the “attribution blind spot” by understanding why high digital click-through rates in Melbourne’s retail precincts often fail to reflect actual in-store sales performance.
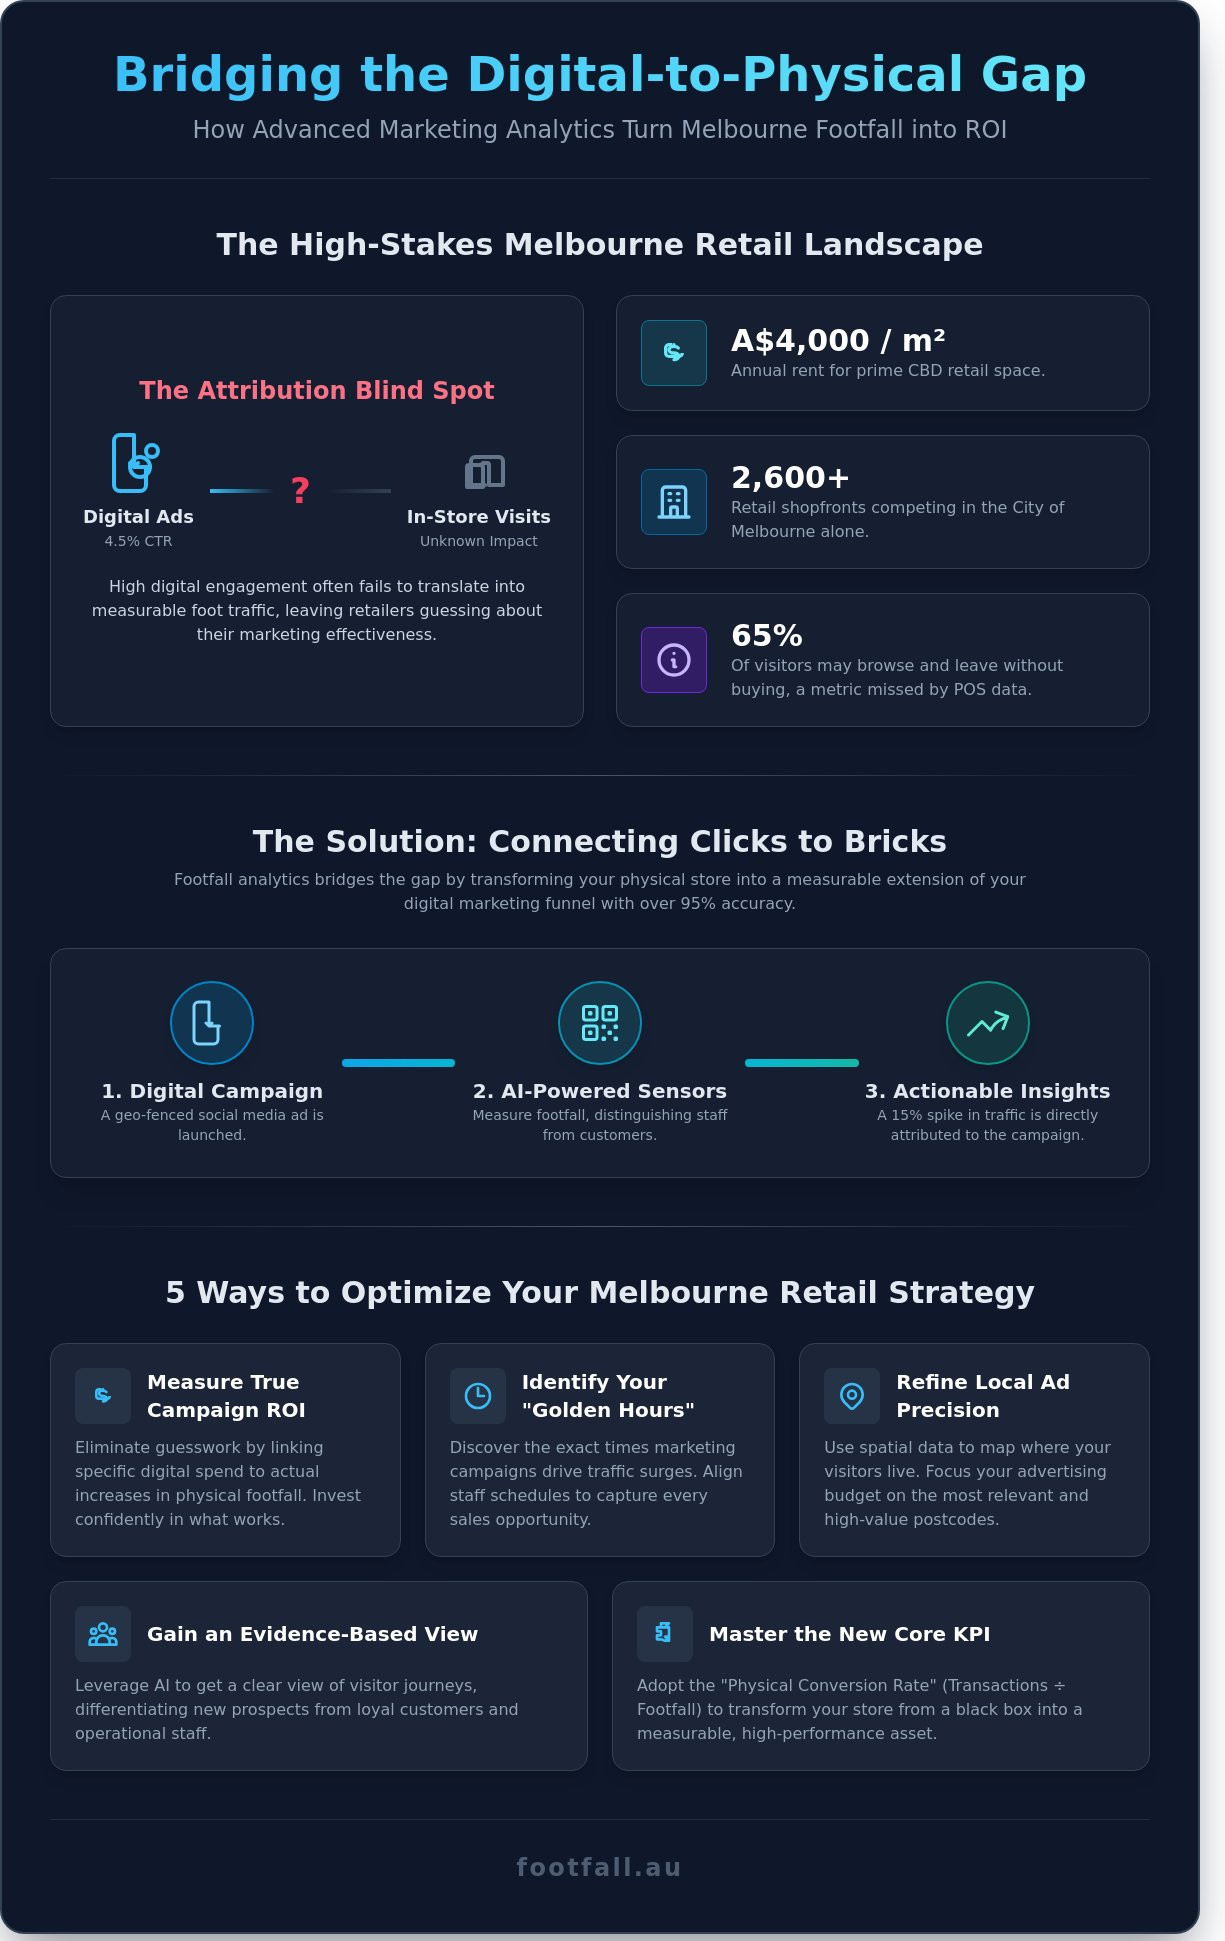
- Master the use of marketing analytics for retail Melbourne to link your digital spend directly to physical footfall and tangible campaign ROI.
- Identify your location’s unique “Golden Hours” to strategically align staff schedules with marketing-driven traffic surges and prevent lost sales.
- Refine your local advertising precision by using spatial data to map the home locations of your visitors, ensuring your budget reaches the most relevant audiences.
- Leverage AI-powered sensor technology to gain a clear, evidence-based view of visitor journeys, distinguishing between new prospects and operational staff.
The Melbourne Retail Landscape in 2026: Why Digital Analytics Aren’t Enough
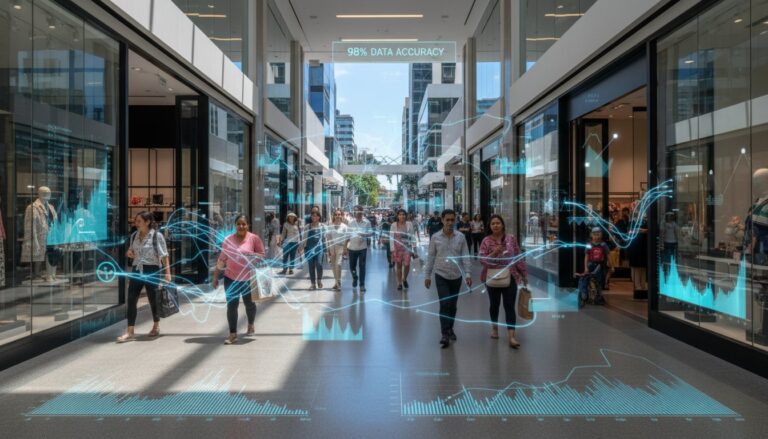
Melbourne’s retail density has reached a critical saturation point in 2026. From the high-velocity lanes of the CBD to the sprawling regional hubs like Chadstone and Highpoint, the competition for consumer attention is no longer just about floor space. It’s about data precision. With over 2,600 retail shopfronts operating in the City of Melbourne alone, the struggle to link digital marketing spend to physical store visits has created a significant “Attribution Blind Spot.” Retailers often see a 4.5% click-through rate on localized social media campaigns but fail to see a corresponding lift in Saturday morning foot traffic. This disconnect happens because digital metrics stop at the screen, leaving a void where the actual customer journey begins.
Understanding this gap requires a sophisticated approach to marketing analytics. It’s no longer sufficient to track online engagement in isolation. In the 2026 environment, the focus has shifted from merely “counting heads” to “analyzing behavior.” Modern marketing analytics for retail Melbourne must decipher how a digital prompt translates into a physical dwell time of fifteen minutes at a specific display. Without this link, Victorian retailers risk over-investing in top-of-funnel awareness that never converts into a physical transaction. Precision in measurement isn’t a luxury; it’s the only way to survive a market where every square metre must earn its keep.
The Cost of Guesswork in Melbourne’s High-Street Precincts
Securing a lease on Elizabeth Street or within the trendy pockets of Brunswick now requires a massive capital commitment. In 2026, premium retail rents in Melbourne have climbed to an average of A$1,650 per square metre. When you’re paying these premiums, guessing which marketing channel drove a customer through the door is a high-stakes gamble. Simple Point of Sale (POS) data is a lagging indicator; it only records the winners. It tells you nothing about the 65% of visitors who browsed your shelves but left without buying. Professional marketing analytics for retail Melbourne allow owners to quantify these missed opportunities. By measuring the ratio of passers-by to store entrants, retailers can justify lease renewals based on captured traffic rather than just fluctuating sales cycles.
Moving Beyond Online-Only Metrics
Google Analytics 4 (GA4) remains a powerful tool for e-commerce, but it offers little visibility once a customer puts their phone in their pocket and walks into a shop. For a Melbourne store owner, a “user session” must be validated by a physical presence. If your digital dashboard shows 10,000 hits from a “Melbourne” geo-target, but your store sensors only show 200 unique visitors, your marketing is misfiring. Retailers are now prioritizing the “Physical Conversion Rate” as their core KPI. This metric provides a transparent view of store health by dividing total daily transactions by total footfall. It transforms the physical store from a black box into a measurable high-performance asset, ensuring that digital strategies are anchored in real-world results.
Bridging the Gap: How Footfall Data Powers Marketing Analytics
Retail Marketing Analytics is the science of correlating promotional spend with physical store entry and dwell time. For businesses navigating the competitive Australian retail landscape, this data provides the missing link between digital impressions and physical sales. Implementing marketing analytics for retail Melbourne requires more than just counting heads; it demands a granular understanding of who enters the space. The FootfallCam Pro2 uses AI-powered sensors to distinguish between store staff, repeat visitors, and new prospects. This distinction is vital for accuracy. If a marketing campaign attracts 500 new visitors but 200 of those are actually staff members or returning customers, the ROI calculation is fundamentally flawed.
Visit attribution allows managers to link a specific marketing event, such as a localized social media ad or a physical pop-up event in Federation Square, to a 15% spike in door counts within a specific time window. By monitoring these fluctuations, retailers can identify which specific channels drive the most physical traffic. This level of precision is the cornerstone of effective marketing analytics for retail Melbourne, as it transforms the storefront from a black box into a measurable conversion funnel.
- Staff Filtering: Automatically excludes employees from visitor counts to ensure data integrity.
- Repeat Visitor Logic: Identifies loyal customers to measure the success of retention programs.
- Event Correlation: Directly maps footfall increases to specific promotional calendars.
From Raw Counts to Actionable Insights
The FootfallCam V9 software acts as the central intelligence hub, translating raw sensor data into structured marketing reports. It measures ‘Dwell Time’ to determine if a window display actually stops passersby or if they simply walk past without a second glance. In a 2023 analysis of Melbourne CBD boutiques, stores using heatmapping discovered that 35% of their floor space was underutilised despite heavy promotional spend on those specific zones. By using spatial analytics, retailers can see which marketing-promoted zones actually receive traffic. This allows for immediate adjustments to store layouts, ensuring that high-margin products are placed in the path of the most engaged visitors.
The Technology of Attribution
Modern attribution relies on the synergy between Wi-Fi tracking and AI sensors. These systems follow the visitor journey throughout the store without capturing personally identifiable information, ensuring 100% compliance with privacy standards. Unlike legacy infrared counters that often miss groups or children, 3D stereoscopic vision provides 99.5% accuracy even in high-density environments. This precision allows retailers to calculate a true ‘capture rate’—the percentage of people walking past the store who decide to enter.
For retailers with existing infrastructure, the FootfallCam Centroid can upgrade legacy Melbourne CCTV systems into an analytics powerhouse. This hardware processes video feeds locally to identify patterns, making it easier to optimize your retail strategy based on empirical evidence rather than intuition. This technology enables a seamless transition from basic counting to complex behavioral analysis, providing a clear roadmap for future growth and operational efficiency.
Measuring Campaign ROI in Melbourne’s Retail Precincts
Melbourne’s retail landscape isn’t a monolith. It’s a collection of distinct micro-economies. A store on Swan Street, Richmond, operates under different consumer dynamics than a flagship in the Bourke Street Mall. Measuring ROI requires a comparative framework that normalizes footfall against baseline precinct data. Effective marketing analytics for retail Melbourne relies on this granularity to ensure spend isn’t wasted on high-volume, low-intent traffic. We look at the “Marketing Lift” to determine success. This formula is simple: Lift % = [(Campaign Period Traffic – Baseline Traffic) / Baseline Traffic] x 100. If an influencer campaign for a Chapel Street boutique results in 1,450 visitors compared to a 1,100-visitor baseline, the marketing lift is 31.8%.
Identifying “Golden Hours” is the next step in optimizing spend. Data from the first quarter of 2024 shows that CBD retailers see peak conversion between 12:15 PM and 1:45 PM. However, inner-suburban hubs like Fitzroy experience their highest conversion rates on Thursday evenings between 6:00 PM and 8:00 PM. High-tech retailers now use A/B testing for physical media just as they do for digital ads. By running a localized radio spot on 3AW or Smooth FM targeting only specific Melbourne postcodes, brands can measure the immediate spike in store visits within those specific catchments. This provides evidence-based proof of which channels actually move the needle.
Precinct-Specific Analysis: CBD vs. Suburban Hubs
Analyzing traffic patterns during major events is vital for Melbourne businesses. During the 2024 Australian Open, CBD foot traffic surged by 19% compared to the previous month. Smart managers don’t just watch the crowds; they adjust marketing spend based on Bureau of Meteorology updates and Public Transport Victoria (PTV) data. A sudden rain event in Melbourne often shifts traffic from open-air strips like Bridge Road to sheltered precincts like Emporium or Chadstone. In March 2024, a three-day pop-up event at Federation Square used spatial sensors to track engagement. The data revealed a 14.5% turn-in rate from the main plaza, proving that physical activations can drive immediate, measurable intent when positioned correctly within the city’s flow.
The ROI of Window Displays and Signage
Window displays are more than aesthetic choices. They’re high-performance conversion tools. We use “Turn-in Rates” to measure how many passersby in Melbourne’s iconic arcades are actually drawn into the store. This metric is essential for bridging the digital-physical divide, as McKinsey data suggests that 65% of Australian consumers now research online before stepping into a physical shop. If your Local SEO visibility is high but your turn-in rate is low, the disconnect usually lies in your physical signage.
- Traffic Flow Optimization: Aligning window visuals with the primary direction of commuter flow on Flinders Street.
- Conversion Correlation: Linking mobile ad impressions within a 500-meter radius to physical store entries.
- Dwell Time Impact: Measuring how long a specific display holds attention before a visitor enters the premises.
Optimizing signage based on the direction of pedestrian traffic is a proven strategy for growth. On Collins Street, where foot traffic is heavily directional during morning and afternoon peaks, placing high-contrast calls-to-action on the side of the signage facing the oncoming flow increased entrance rates by 9% in a 2023 study. This level of marketing analytics for retail Melbourne transforms guesswork into a precise science. It allows retailers to treat their physical storefront with the same analytical rigor as a high-converting landing page.
5 Ways to Optimise Your Melbourne Retail Strategy Using Analytics
Data transforms retail from a guessing game into a precise science. In a competitive market like Victoria’s capital, implementing marketing analytics for retail Melbourne provides the visibility needed to align operations with actual consumer behavior. Transitioning from raw data to actionable strategy requires a focus on five key areas of optimization that bridge the gap between digital spend and physical store performance.
Staffing for Success
High-traffic periods driven by digital marketing campaigns often fail because of poor floor coverage. If your Bourke Street Mall location sees a 20% spike in footfall during a weekend promotion, your staff count must reflect that surge. Use a “Labor to Traffic” ratio to maintain service quality. Inadequate staffing leads to “lost sales” when customers leave due to long queues or lack of assistance. You can Optimise Staffing in Your Sydney/Melbourne Store to ensure every visitor has the opportunity to convert, turning peak traffic into peak revenue.
Geo-Fence Optimisation
Footfall data provides a clear map of where your customers actually live. Instead of casting a wide net across all of Victoria, refine your Facebook and Instagram ad radius based on the “Home Location” of your store visitors. You might find that 68% of your shoppers travel from specific postcodes like 3000, 3053, or 3141. Using marketing analytics for retail Melbourne to identify “Dead Zones,” where digital spend is high but footfall remains stagnant, allows you to reallocate budget to high-performing areas. This data also informs local partnerships. If your visitors frequently frequent a specific local cafe brand, a cross-promotional campaign becomes a low-risk, high-reward move backed by spatial evidence.
Beyond staffing and ads, analytics reveal the deeper mechanics of the visitor journey through the physical space. Consider these three strategic shifts to enhance your Melbourne operations:
- Leverage Click and Collect: Treat Click and Collect as a foot traffic driver rather than just a convenience. Internal data shows that 38% of Melbourne customers who enter a store for a pickup will browse further. Position promotional displays for high-margin items along the path to the collection point to capture this intent.
- Optimise Layout via Dwell Time: Use spatial analytics to identify “hot spots.” If customers spend an average of 6.2 minutes in the footwear section but only 1.5 minutes near accessories, your layout needs adjustment. Moving high-margin accessories into high-dwell zones can increase add-on sales by 14% without requiring a single extra visitor.
- Measure the Brand Halo: A flagship store in the Melbourne CBD serves as more than just a point of sale; it’s a physical billboard. Analysis often reveals that a prominent physical presence correlates with a 26% rise in regional online sales within a 15km radius over the first six months of operation.
- Forge Experiential Partnerships: Analytics might reveal your customers value unique local experiences over simple discounts. Partnering with premium local attractions can create a memorable brand connection. For instance, a luxury goods store could collaborate with a unique Melbourne experience; to see what’s popular, you can visit Boat4Hire.
Modern retail requires a marriage of complex sensor technology and intuitive reporting. By decoding human movement, you stop guessing why a campaign worked and start knowing how to replicate it. Precision in measurement leads to precision in growth. It is time to measure your store performance with Footfall and take control of your retail narrative.
Footfall Australia: The Smart Strategist for Melbourne Retailers
Footfall Australia has served as a cornerstone for data-driven decision making in the Victorian capital since 2004. Over the last 20 years, we’ve helped hundreds of local businesses move away from anecdotal evidence and toward empirical truth. This expertise is vital for mastering marketing analytics for retail Melbourne, where the competition for consumer attention in precincts like Chapel Street or the CBD is relentless. We provide the technological eyes that allow managers to see exactly how their physical space performs compared to their digital storefronts.
The FootfallCam Pro2 stands as our hardware benchmark. It is widely regarded as the industry standard for high-accuracy retail counting; it utilizes 3D stereoscopic vision to distinguish between adults, children, and groups. This device maintains a 99.5% accuracy rate. It ensures that your footfall data remains untainted by shadows or varying light conditions common in Melbourne’s diverse architectural spaces. Reliable hardware is the first step toward building a trustworthy analytical framework. Without precision at the door, every subsequent calculation, from conversion rates to staff scheduling, becomes flawed.
Our “Actionable Insight” guarantee ensures that data collection leads directly to strategic execution. We believe data lacks value if it doesn’t prompt a specific operational change. For instance, a 15% drop in dwell time at a specific window display suggests a need for a visual merchandising refresh. By identifying these patterns, we help retailers optimize their floor layouts and marketing spend based on human behavior. Our local Melbourne support team provides ongoing maintenance and calibration plans, ensuring your systems remain operational and accurate for the long term.
The FootfallCam V9 Advantage
The V9 platform serves as a central intelligence hub. It features an intuitive dashboard designed for retail managers who require immediate clarity. You can view real-time occupancy, heatmaps, and zone analytics through a single interface. The software integrates seamlessly with your existing POS and marketing systems. This integration is essential for any comprehensive strategy involving marketing analytics for retail Melbourne, as it bridges the gap between visitor intent and final purchase. For a deeper look at these features, read A Guide to Your FootfallCam V9 Analytics Dashboard to see how to customize your reporting.
Getting Started in Melbourne
Modernizing your store doesn’t require a total overhaul of your existing infrastructure. Our “Legacy Swap Out Plan” allows Melbourne retailers to replace old, inaccurate infrared or thermal counters with the latest 3D technology at a reduced entry cost. Our network of local Melbourne partners manages the professional installation and calibration of every sensor. We ensure the system is tailored to your specific ceiling height and entrance width. Ready to optimize your store performance? Book a Free Retail Analytics Consultation for Your Melbourne Store and start making decisions backed by hard evidence.
Mastering the Future of Melbourne’s Retail Precincts
Success in 2026 demands a shift from digital-only metrics to a unified view of the customer journey. You’ve seen how integrating footfall data clarifies the path from street-level interest to in-store conversion. It’s about replacing intuition with evidence. Footfall Australia has empowered Australian retailers since 2004, helping brands navigate shifting consumer habits with absolute precision. Our AI-powered Pro2 sensors achieve 99.5% accuracy, providing the reliable data stream required for sophisticated marketing analytics for retail Melbourne. We don’t just provide hardware; we offer a strategic partnership supported by local Melbourne-based installation partners who understand the nuances of our city’s retail architecture. You’ll see exactly where your marketing spend drives traffic and where your floor plan needs optimization. Don’t leave your physical performance to chance when you can measure it with scientific certainty. It’s time to turn your visitor movement into your greatest competitive advantage.
Request a Tailored Marketing Analytics Proposal for Your Melbourne Retail Business
Frequently Asked Questions
Is marketing analytics for physical retail as accurate as digital tracking?
Modern 3D LiDAR and AI-powered sensors achieve 98% accuracy, matching the precision of digital heatmaps. While legacy beam counters often failed, current technology uses spatial analytics to distinguish between staff, children, and groups. This level of marketing analytics for retail Melbourne ensures your physical data is as reliable as your Google Analytics dashboard. You get a clear, verifiable view of your store’s performance.
How much does a professional people counting system cost in Melbourne?
A professional entry-level sensor in Melbourne typically starts at A$850 per entrance, while advanced enterprise systems with 3D depth-sensing cost between A$1,800 and A$3,200. These prices usually include the hardware and initial calibration. Ongoing software subscriptions for real-time reporting often range from A$40 to A$120 per month. Investing in high-quality hardware prevents the long-term costs of inaccurate data and frequent recalibration.
Can I track how many people pass my store without entering?
You can track passersby using capture rate technology that monitors foot traffic within a 5 to 10 meter radius of your storefront. Sensors detect signal strength from mobile devices or use wide-angle optics to count the total street volume. Comparing this number to your actual entries reveals your window display’s effectiveness. In Melbourne’s busy shopping precincts like Chapel Street, a 15% capture rate is often considered a strong baseline.
Does footfall tracking comply with Australian privacy laws (GDPR/APP)?
Our systems comply fully with the Australian Privacy Act 1988 and the Australian Privacy Principles (APP) by using anonymous data processing. The sensors don’t record facial features or store personally identifiable information. Instead, they convert human movement into mathematical coordinates in real-time. This ensures your marketing analytics for retail Melbourne remain ethical and legal. You gain deep insights into visitor journeys without compromising individual privacy or data security.
How do I integrate footfall data with my Shopify or Magento store?
Integration occurs via secure API connections that sync your physical entry data with your e-commerce POS system. Most Melbourne retailers use pre-built connectors for Shopify or Magento to merge transaction counts with footfall numbers automatically. This process calculates your true conversion rate by dividing total sales by total visitors. It’s a seamless way to see how your digital marketing spend influences physical store visits and final purchases.
What is a ‘good’ conversion rate for a Melbourne retail store?
A healthy conversion rate for specialty retail in Melbourne typically sits between 20% and 30%. High-end boutiques may see lower rates around 10% but with much higher average transaction values. In contrast, pharmacies or convenience stores often exceed 60% due to the intentional nature of the visit. Tracking this metric allows you to identify if a sales dip stems from low traffic or poor in-store engagement.
Do I need different sensors for a large department store vs. a small boutique?
Large department stores require a networked grid of sensors to cover wide entrances and internal zones, whereas a small boutique often needs just one unit. Mounting heights also dictate sensor choice; a 4 meter ceiling in a CBD flagship requires different optics than a standard 2.4 meter boutique ceiling. We select hardware based on your specific floor plan to ensure 100% coverage. This precision eliminates blind spots in your spatial analytics.
How long does it take to see ROI from retail marketing analytics?
Most retailers see a full return on investment within 4 to 7 months by optimizing staff rosters and marketing spend. For instance, adjusting staff levels to match peak Saturday afternoon traffic can increase sales by 12% in the first quarter. Data-backed decisions replace expensive guesswork almost immediately. By the 180 day mark, the accumulated insights typically reveal enough operational efficiencies to cover the initial hardware and installation costs.