10 Essential Store Performance Metrics to Track in 2026: A Data-Driven Guide
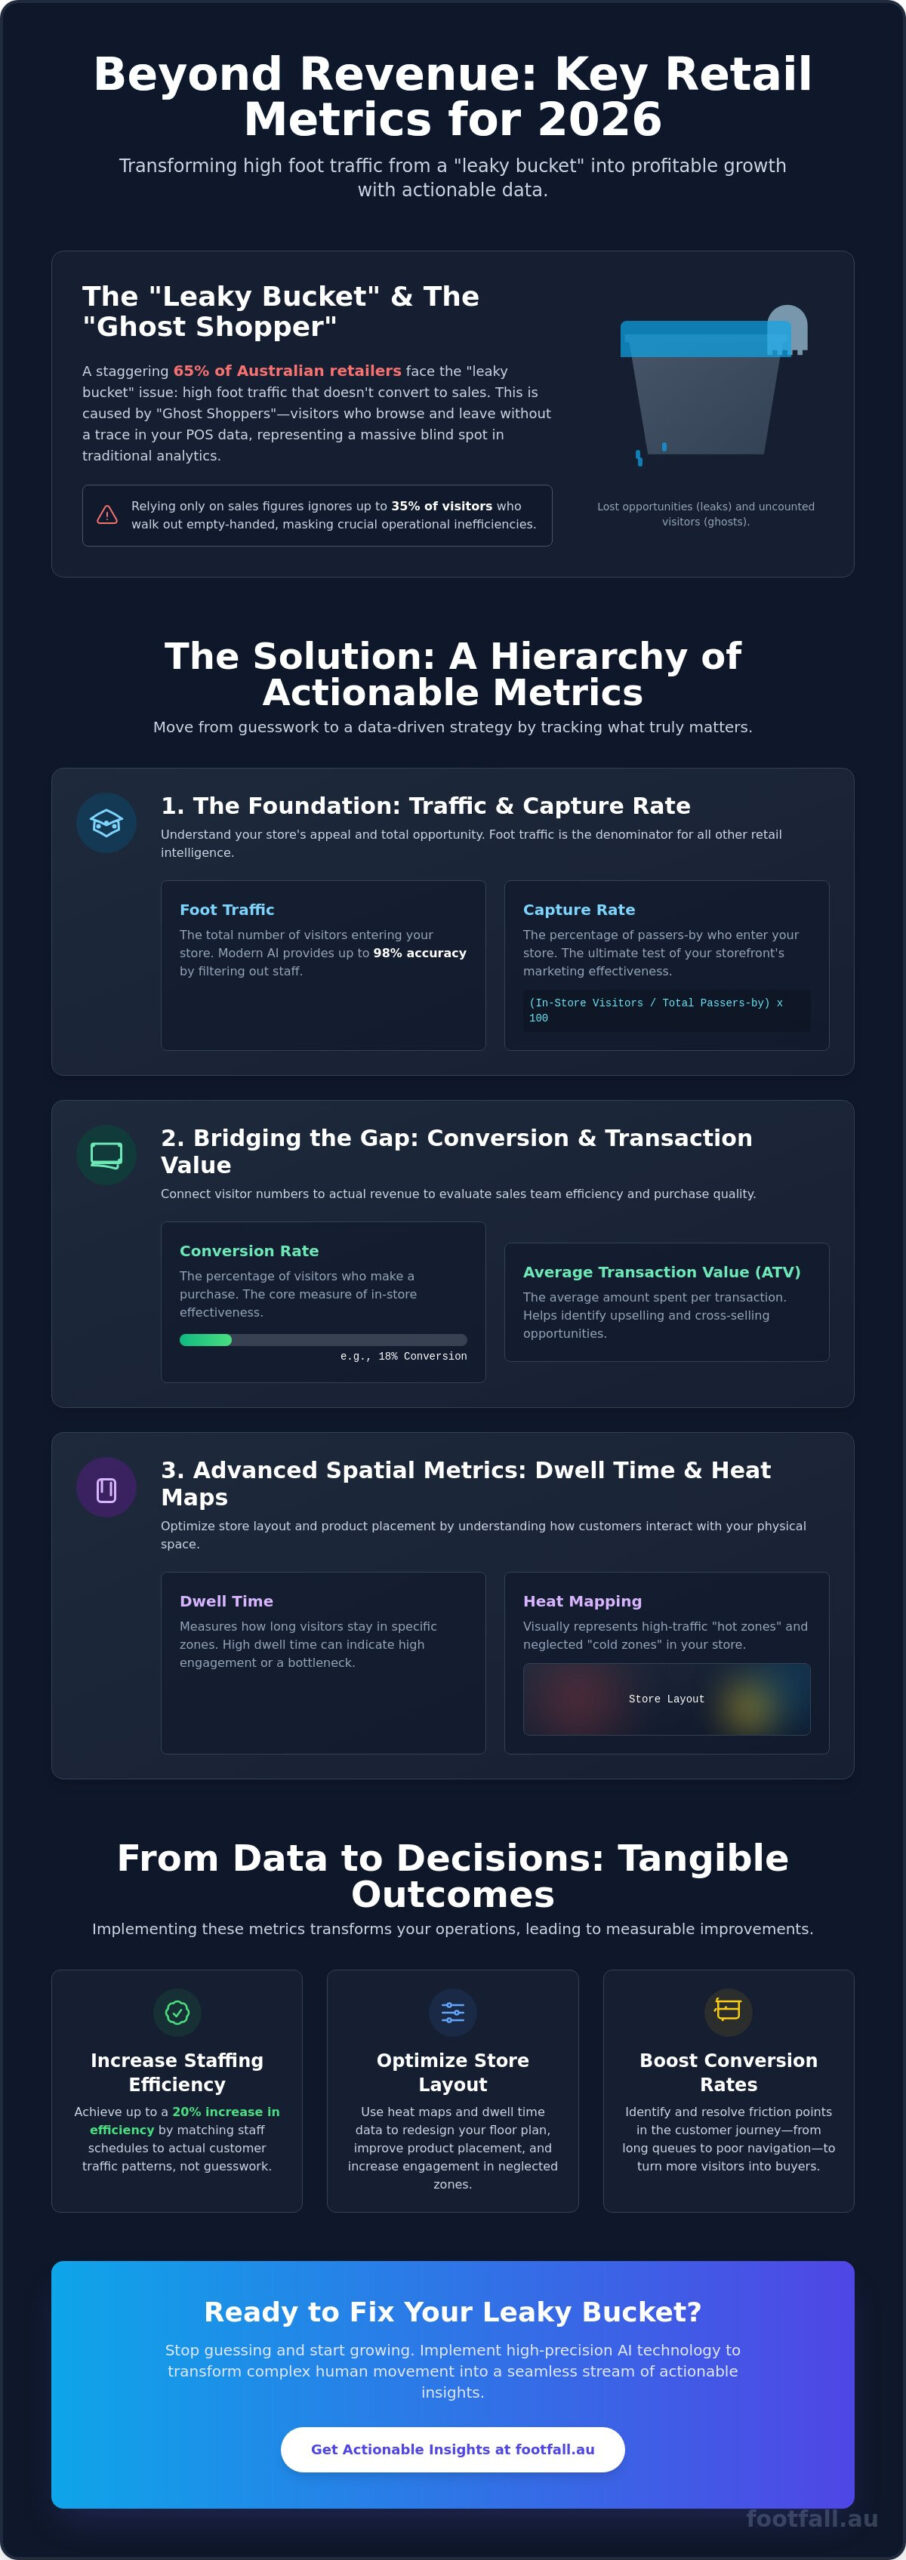
Recent industry reports show that 65% of Australian retailers currently suffer from a “leaky bucket” problem, where high foot traffic doesn’t lead to the expected sales growth. This gap between visibility and profit often occurs because businesses lack the granular data needed to understand why visitors leave empty-handed. Selecting the right store performance metrics to track in 2026 is no longer just a technical exercise; it’s a strategic necessity for anyone looking to eliminate guesswork. You’ve likely experienced the inefficiency of staffing for a rush that never comes, or the missed opportunities of a marketing campaign that brings people in but fails to convert.
We agree that data is only valuable if it leads to a specific, positive change in your operations. This guide promises to bridge the gap between raw numbers and actionable intelligence, helping you achieve up to a 20% increase in staffing efficiency. We’ll examine ten critical KPIs, including dwell time and spatial analytics, to give you a clearer understanding of your customer behavior and a proven path to higher conversion rates.
Key Takeaways
- Identify the “Ghost Shopper” by moving beyond basic POS data to uncover why high-traffic volumes are not always translating into completed transactions.
- Master the most critical store performance metrics to track by using raw foot traffic as the fundamental denominator for all your retail intelligence.
- Bridge the gap between visitor count and revenue by analyzing conversion rates and Average Transaction Value to evaluate sales team efficiency and purchase quality.
- Utilize advanced spatial analytics, including heat mapping and dwell time, to optimize your store layout and increase engagement in neglected zones.
- Implement high-precision AI technology to transform complex human movement into a seamless stream of actionable insights for your business.
Beyond Revenue: Why Traditional KPIs Leave Australian Retailers with Blind Spots
Traditional retail management often relies on the end-of-day closing report. While sales figures provide a snapshot of success, they fail to explain why 35% of visitors walked out empty-handed during a Tuesday afternoon slump. Relying solely on Point of Sale (POS) data creates a significant blind spot. It ignores the “Ghost Shopper,” the visitor who enters, browses, and departs without leaving a digital footprint. In 2026, successful store owners move beyond these surface-level figures to embrace a more granular approach. They recognize that a Key Performance Indicator (KPI) should reflect the entire customer journey, not just the final transaction. This shift from intuitive management to evidence-based retail strategy provides the quiet confidence needed to justify operational investments to stakeholders.
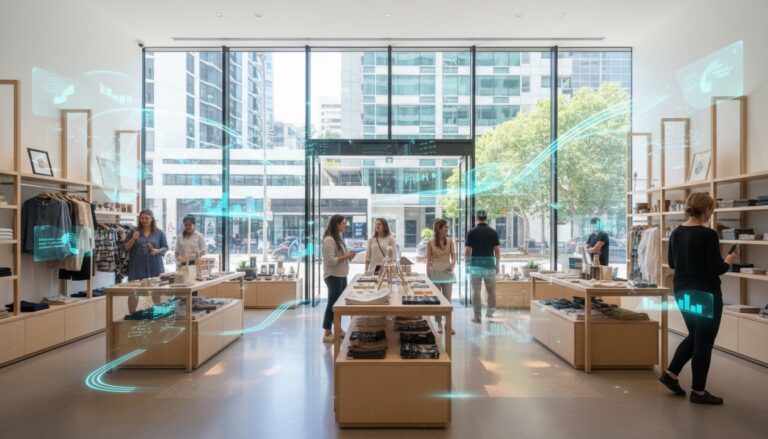
Adopting sophisticated store performance metrics to track allows you to decode human behavior within your physical space. It transforms a silent floor into a map of opportunity. When you see the gap between foot traffic and sales, you stop guessing and start optimizing. This precision builds a foundation of expertise that protects your business against shifting consumer trends.
The Difference Between Vanity Metrics and Actionable Insights
Total sales often function as a vanity metric, masking underlying operational inefficiencies. A store might hit its daily target while missing 18% of potential revenue due to long queues or poor product placement. Actionable insights in the Australian retail market require identifying which store performance metrics to track specifically correlate with your growth goals. These insights allow managers to pinpoint exactly where the customer experience breaks down. By focusing on conversion rates and dwell times rather than just gross revenue, retailers implement precise changes that yield measurable results.
The Cost of Guesswork in Modern Store Management
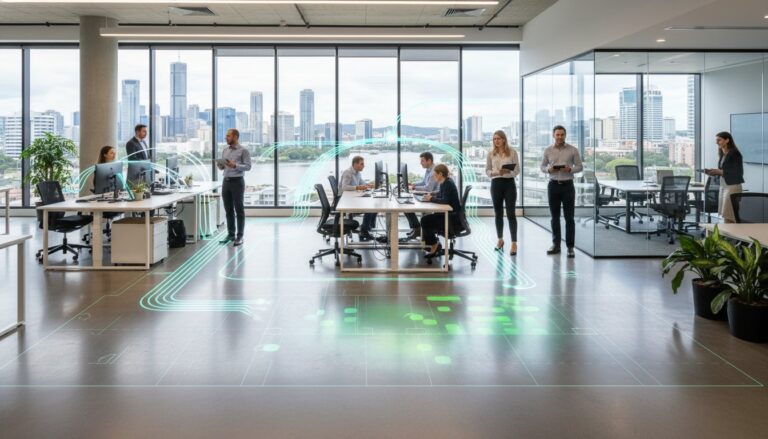
Guesswork carries a heavy price tag. Miscalculating peak hours leads to a 15% drop in customer satisfaction when staff are stretched too thin during high-traffic windows. Conversely, overstaffing during quiet periods inflates overheads without adding value. Implementing retail footfall analysis Australia wide provides the foundation for modern growth by replacing assumptions with precision. When you understand the flow of human movement, you optimize scheduling and floor layout with scientific accuracy. This level of intelligence transforms the store into a high-performance environment where every decision is backed by hard evidence.
The Foundation of Retail Intelligence: Foot Traffic and Capture Rates
Foot traffic is the raw count of visitors entering your physical space over a specific period. It’s the most fundamental of all store performance metrics to track because it provides the essential denominator for your entire success equation. High sales figures mean little if they represent only a tiny fraction of a massive crowd. Conversely, a high conversion rate on low traffic suggests a need for better storefront appeal rather than better sales training. By establishing this baseline, you transform vague guesses into a structured foundation for retail intelligence.
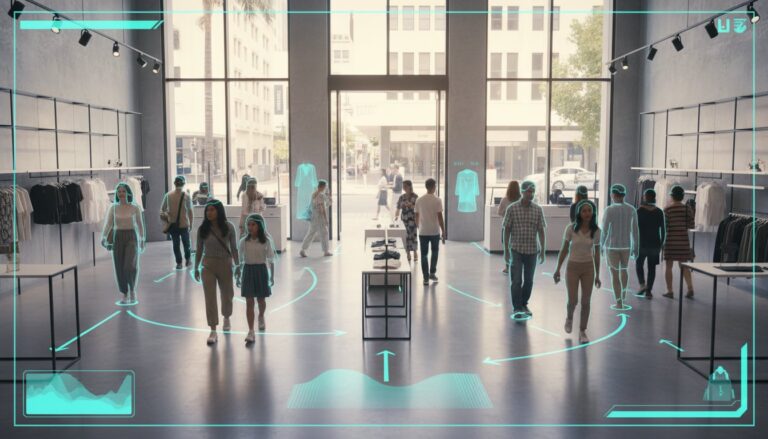
Modern people counting technology now filters out the noise that historically skewed retail data. AI-driven sensors distinguish between staff members, delivery personnel, and genuine prospects with up to 98% accuracy. This precision ensures your labor costs and performance targets align with actual customer opportunity rather than inflated door-swing counts. It allows managers to focus on the human behavior that actually drives revenue while ignoring non-buying traffic.
Outside Traffic vs. In-Store Visitors
To understand your store’s true potential, you must look beyond the entrance. Measuring the catchment area involves counting every person who walks past your window. By comparing this to the number of people who actually enter, you calculate your Capture Rate: (In-store Visitors / Total Passers-by) x 100. Capture Rate is the ultimate measure of storefront marketing effectiveness. If your Capture Rate sits below the 2024 industry benchmark of 9% for specialty retail, your window displays likely lack the necessary “stop power” to pull consumers from the street. Identifying these gaps is a core part of the store performance metrics to track for any manager looking to optimize floor coverage.
Identifying True Peak Hours
Relying on daily totals hides the rhythmic flow of the Australian consumer. You need to analyze traffic in 15-minute intervals to identify Power Hours. These are specific windows where traffic surges but conversion often dips due to service bottlenecks. For example, a Sydney-based boutique might see a 30% spike in traffic during the Thursday night shopping window. If your data shows high volume but stagnant sales, you’re likely losing revenue to long wait times.
- Analyze 15-minute intervals to spot immediate staffing needs.
- Compare Power Hours across different locations to standardize service models.
- Identify “Dead Zones” where marketing activations could stimulate movement.
Implementing advanced visitor tracking helps you adjust staff rosters to meet these surges, ensuring you never miss a high-intent prospect during the busiest parts of the day. This data-driven approach moves your operations from reactive to proactive, matching your team’s energy to the actual pulse of the street.
Bridging the Gap: Connecting Traffic to Sales Conversion and ATV
Raw traffic numbers tell only half the story. To unlock genuine growth, you must understand how efficiently your team converts visitors into paying customers. Identifying the right store performance metrics to track allows you to pinpoint exactly where the sales funnel leaks, moving beyond guesswork to evidence-based management.
The Conversion Rate remains the most critical metric for measuring sales team performance. It measures the percentage of visitors who make a purchase, providing a direct reflection of your floor team’s ability to engage and close. However, conversion doesn’t act alone. You must also monitor Average Transaction Value (ATV) and Units per Transaction (UPT).
- Average Transaction Value (ATV): This defines the quality of each successful sale. A high conversion rate with a low ATV suggests your team is processing small, low-value items rather than driving premium sales.
- Units per Transaction (UPT): This is your primary indicator of effective cross-selling and merchandising. If a customer leaves with three items instead of one, your UPT rises, directly boosting your bottom line without requiring additional footfall.
To gain a comprehensive perspective, you need to integrate footfall and sales data. This connection reveals whether a dip in revenue stems from a lack of visitors or a failure in the sales process itself, creating a holistic view of store health.
Calculating the Real Conversion Rate
The standard formula is simple: (Number of Transactions / Total Foot Traffic) x 100. Accuracy depends entirely on the quality of your denominator. Many retailers still rely on basic door counters that include staff movements or delivery personnel, which artificially suppresses your conversion figures. Using high-precision sensors ensures your base data is clean and actionable.
Setting realistic benchmarks is essential for Australian retailers. In 2024, specialty fashion retailers in Sydney and Melbourne typically targeted conversion rates between 18% and 22%. In contrast, high-intent sectors like hardware or pharmacies often see rates exceeding 45%. Knowing your specific sector’s baseline helps you set achievable KPIs for your staff.
Optimising Staff-to-Customer Ratios
The Service Level metric ensures you have enough eyes on the floor during peak periods. If your staff-to-customer ratio exceeds 1:12 during a busy Saturday afternoon, your conversion rate can drop by 10% as customers leave due to lack of assistance. This is a missed opportunity that data can prevent.
Overstaffing during quiet periods is equally damaging, as it erodes your Gross Margin Return on Investment (GMROI). By using predictive traffic data, you can build more efficient, cost-effective rosters. Aligning your headcount with historical visitor trends allows you to maintain high service levels while controlling labor costs. This strategic alignment is one of the most effective store performance metrics to track for long-term profitability.
Advanced Spatial Metrics: Understanding Dwell Time and Visitor Journeys
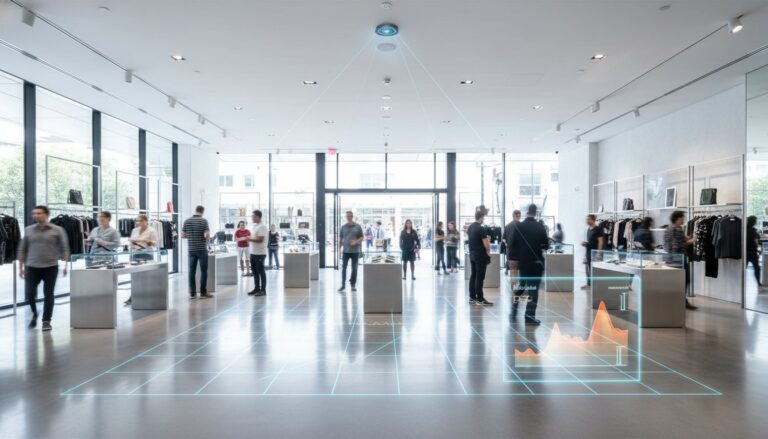
Spatial intelligence transforms the physical floor plan from a static space into a dynamic sales funnel. Dwell time measures the exact duration a visitor remains within a specific radius of a display or product category. This metric provides a granular look at engagement that raw traffic numbers cannot capture. Heat mapping visualizes these interactions, highlighting high-traffic “hot zones” where visibility is peaked and identifying “cold zones” that may require structural changes or better lighting.
Understanding the “Path to Purchase” involves decoding the sequence of movements a customer makes from the moment they cross the threshold. Data from 2025 retail studies indicates that 70% of shoppers follow a predictable flow, yet even minor obstructions can lead to missed opportunities. Implementing people counting technology provides the objective evidence needed to validate the success of new store layouts. When these tools are integrated into your store performance metrics to track, you move beyond intuition to evidence-based management.
Zone Analytics and Department Performance
Dead zones represent a significant drain on resources. These areas consume rent and maintenance costs while generating zero engagement. By measuring the “Attraction Rate”, which is the percentage of total store visitors who interact with a specific promotional end-cap or kiosk, you can quantify the ROI of your visual merchandising. In high-consideration retail environments, dwell time directly correlates with purchase intent because shoppers require more time to process complex product information before committing to a sale.
Customer Flow and Bottleneck Identification
Friction remains a primary driver of lost revenue. Analyzing queue wait times at the POS allows managers to deploy staff dynamically to prevent walk-outs. Industry benchmarks show that abandonment rates increase by 25% when wait times exceed five minutes. Optimizing aisle widths and product placement based on real human movement patterns creates a fluid environment. Reducing this friction ensures that the visitor journey remains focused on product discovery rather than navigation frustration. This level of precision is essential when refining the store performance metrics to track for long-term growth.
Ready to eliminate guesswork from your store layout? Discover how Footfall spatial analytics can optimize your retail floor today.
Building a Seamless Analytics Ecosystem: Implementing FootfallCam Technology
Precision hardware is the non-negotiable prerequisite for any data-driven strategy. If your entry counts are off by even 5%, your conversion rates and labor models become fiction. The FootfallCam Pro2 eliminates this margin of error by combining AI-driven 3D stereo vision with high-speed Australian network integration. It doesn’t just count heads; it filters out trolleys, shadows, and staff members to ensure the numbers reflect genuine customer intent. This hardware is engineered to work across 4G, 5G, and Wi-Fi networks, providing a stable backbone for your data collection.
Raw data alone doesn’t grow a business. The V9 Software dashboard acts as the central nervous system of your operations, converting pulses of traffic into actionable intelligence. This platform allows you to monitor the most critical store performance metrics to track, such as dwell times and power hours, through a single interface. When your hardware and software speak the same language, the path to optimization becomes clear. You’re no longer guessing why a weekend sale failed; you’re looking at the exact point where the visitor journey stalled.
Maintaining a 99.5% data integrity rate requires more than just good equipment. It demands proactive oversight. Through comprehensive people counter support, Footfall Australia ensures your sensors remain calibrated and your data flows remain uninterrupted. This level of technical vigilance protects your ROI by ensuring every strategic decision rests on a foundation of absolute truth. Data integrity isn’t a luxury. It’s the difference between a calculated move and a blind gamble.
Automated Reporting and Real-Time Alerts
Efficiency thrives on automation. The V9 system generates automated KPI reports tailored for specific roles, from floor managers needing daily traffic peaks to executives reviewing monthly regional trends. Real-time occupancy alerts help staff manage store capacity and safety protocols instantly. You can customize these dashboards to highlight the specific store performance metrics to track that align with your 2026 financial goals. This ensures no vital detail is overlooked and keeps every level of management focused on the same objectives.
Future-Proofing Your Retail Strategy
Technology moves fast, but your infrastructure shouldn’t become obsolete. FootfallCam provides perpetual software updates and AI model refinements to adapt to changing consumer behaviors. If you’re currently using outdated hardware, the Legacy Swap Out Plan provides a structured path to upgrade without massive capital disruption. This forward-thinking approach ensures your analytics ecosystem evolves alongside the retail industry. It’s about staying ahead of the curve rather than reacting to it. Optimise your store performance with Footfall Australia’s data-driven solutions.
Future-Proofing Your Retail Strategy Through Data Precision
Modern retail success requires a shift from reactive observation to proactive spatial intelligence. Relying solely on revenue figures creates blind spots that obscure the true potential of your physical space. By mastering advanced analytics like dwell time and visitor journeys, you gain a clear narrative of the human movement within your store. Identifying the right store performance metrics to track is the first step toward navigating the competitive landscape of 2026 with absolute clarity. Footfall Australia provides the technical precision needed to execute these strategies with confidence. Our systems deliver AI-driven 99.5% accuracy, ensuring every decision rests on a foundation of verifiable evidence rather than guesswork. We’ve supported Australian retailers since 2004, offering seamless V9 Software integration to bridge the gap between complex sensor data and actionable growth strategies. Your data holds the key to your next operational breakthrough. Discover how Footfall Australia can transform your store data into growth. We’re ready to help you turn these sophisticated insights into your most significant competitive advantage yet.
Frequently Asked Questions
What are the most important retail KPIs to track for a small store?
Small retailers should focus on conversion rate, average transaction value, and foot traffic volume. Tracking these specific store performance metrics to track allows you to identify if a sales dip is due to low traffic or poor floor execution. For instance, a 5% increase in transaction value can offset a 10% drop in total visitors. Precision in these core numbers ensures you optimize limited resources for maximum impact.
How do I calculate the sales conversion rate using footfall data?
You calculate sales conversion rate by dividing the number of completed transactions by the total footfall count, then multiplying by 100. If your store records 45 transactions against a footfall of 300 visitors, your conversion rate is 15%. This metric reveals how effectively your staff and layout turn browsers into buyers. It’s the most reliable way to measure operational success regardless of external economic factors or seasonal fluctuations.
Why is foot traffic more important than just looking at my POS sales?
Foot traffic identifies the volume of missed opportunities, whereas POS sales only record successful outcomes. If your sales are flat but traffic has increased by 15%, you have a conversion problem, not a marketing problem. Relying solely on POS data ignores the 70% of visitors who leave empty handed. Understanding this gap helps you adjust staffing levels or product placement to capture revenue that’s currently walking out the door.
Can people counters distinguish between staff and customers?
Modern AI counters distinguish between staff and customers using advanced height filtering and staff exclusion technology. These systems use specialized tags or skeletal tracking to recognize employees, ensuring they don’t skew your conversion data. By removing staff movements, you maintain a 98% accuracy rate in your visitor counts. This level of precision is vital for calculating a true conversion rate that reflects genuine customer behavior rather than internal operations.
What is a good ‘Turn-in Rate’ for a retail store in Australia?
A healthy turn-in rate for an Australian retail store generally sits between 8% and 15% depending on the sector. High street boutiques often aim for the upper end of this range, while large department stores might see lower percentages due to higher passing volume. This metric measures the percentage of people passing your window who decide to enter. Monitoring this helps you evaluate the effectiveness of your window displays and storefront marketing strategy.
How does dwell time affect my store’s bottom line?
Dwell time directly impacts your bottom line because customers who stay longer typically spend more. Industry data suggests that increasing a visitor’s stay by just 10 minutes can boost sales by up to 30%. When you understand where people linger, you can place high margin items in those high dwell zones. It’s a strategic way to optimize your floor plan based on actual human movement patterns and recorded spatial analytics.
Is it difficult to integrate people counting data with my existing POS system?
Integrating people counting data with your existing POS system is a seamless process using modern API connections. Most cloud based platforms allow for automated data syncing that can be configured in under 48 hours. This connection automates the calculation of your store performance metrics to track, removing the need for manual spreadsheets. It provides a unified dashboard where you can view traffic and sales data side by side in real time.
How accurate are modern AI-based people counters compared to older systems?
Modern AI based counters offer accuracy rates exceeding 98%, which is a significant leap from the 80% typical of older infrared sensors. Older technology often struggled with groups or shadows, leading to inflated or missed counts. AI systems use 3D stereoscopic vision to distinguish between individuals, children, and even shopping carts. This precision ensures your strategic decisions are based on the highest quality data available in the 2026 retail market.