
How to Build a Clear Weekly Foot Traffic Report
A weekly foot traffic report should do more than count visits. It should show what changed and what to do next. A practical weekly foot traffic report template has four sections: a visit summary, day-and-time patterns, comparison with recent weeks, and actions for the coming week. Include a four-week trend to make shifts easier to spot.
It’s easy to focus on the total, but a weekly figure is more useful when you can see when traffic rose or fell and how the pattern compares with earlier weeks. Whether managing a busy retail shop or a specialized healthcare clinic like Ankle & Foot Centers, PC, clear context helps turn visit data into practical operational decisions.
This guide shows how to organise the four sections and use a simple template to present the week’s results. You’ll see what to include in each part, how to keep the report readable, and how to connect visitor patterns with practical next steps.
Key Takeaways
- Organise the report around completed work, blockers, upcoming priorities and goal status to give store visit data a clear structure.
- Compare the latest week with the previous week and a four-week trend to put changes in context.
- Keep the template concise, then connect notable traffic patterns to practical next steps.
- Use people-counting technology and reporting software to support consistent measurement and clearer weekly reviews.
Four-section weekly report format
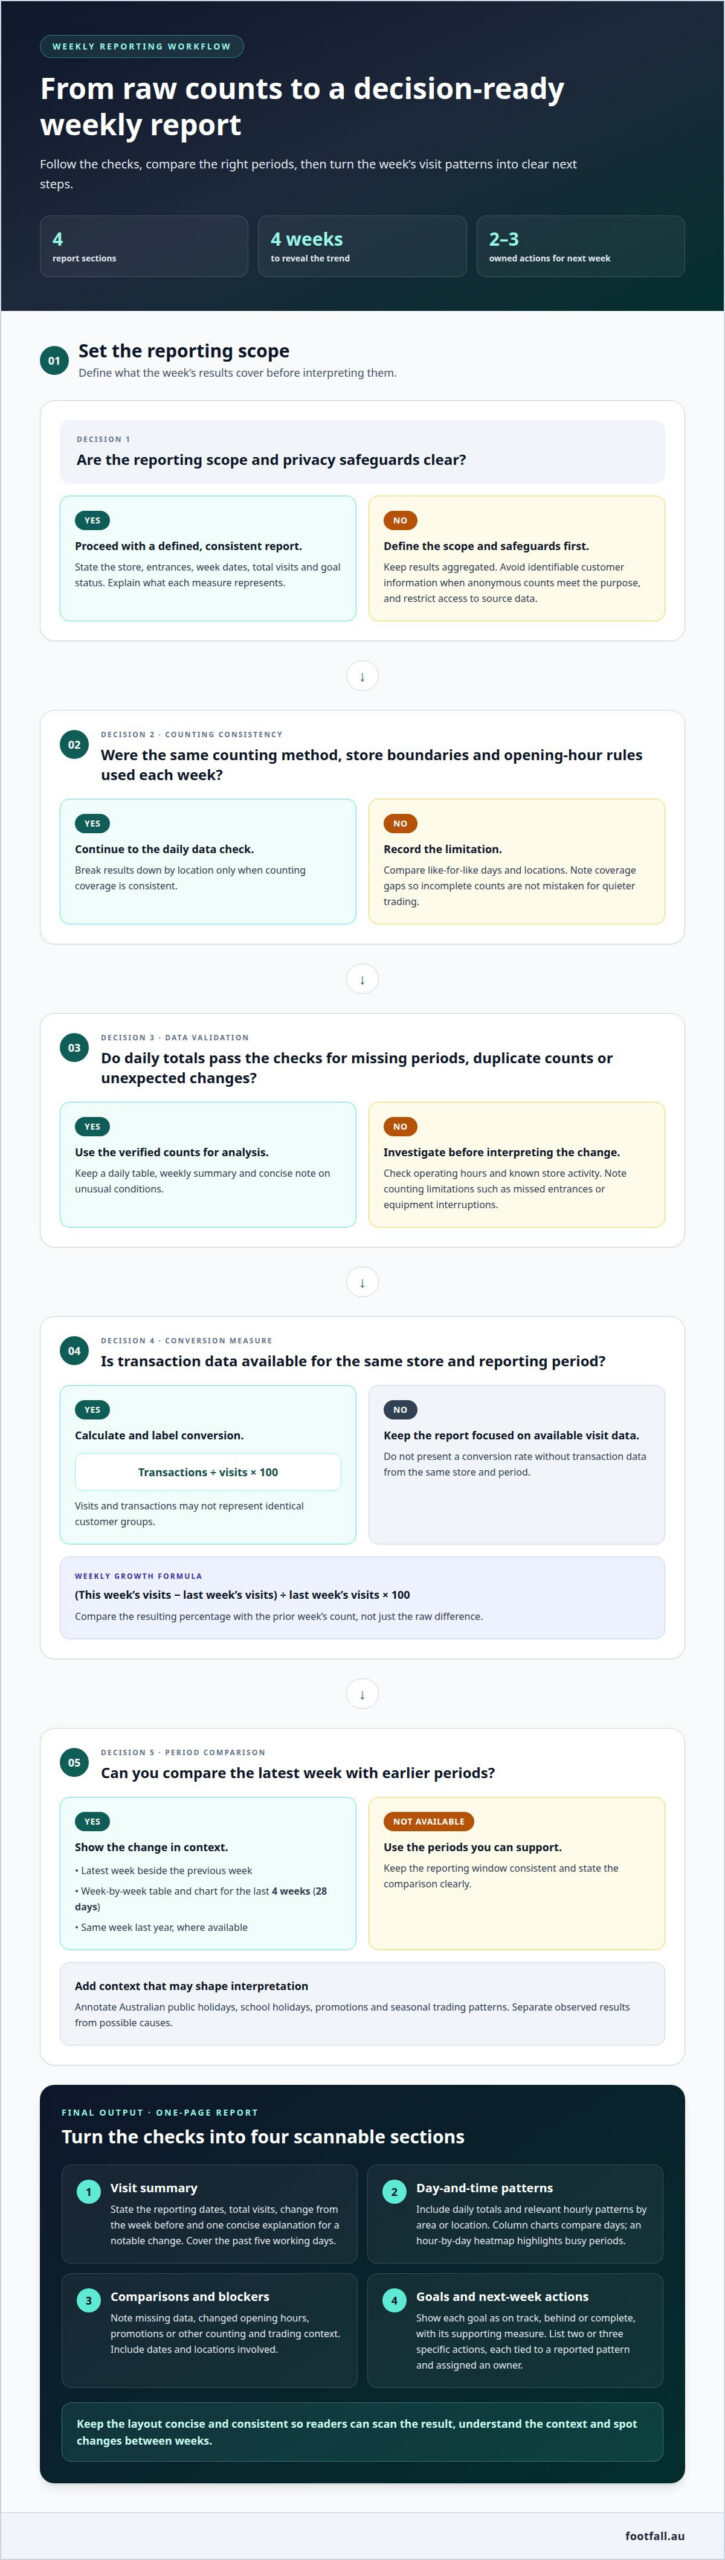
Build the report in four steps: define the measures, validate the counts, calculate rates, then compare periods. This sequence turns raw visit data into operational context.
-
Define report contents and privacy safeguards
Set the reporting scope first: store, entrances, week dates, total visits and goal status. In Australia, keep reported results aggregated and avoid collecting or retaining identifiable customer information when anonymous counts meet the purpose. Restrict access to any source data and explain what each measure represents. Use a daily table, a weekly summary and a short note on unusual conditions.
-
Collect and verify foot traffic data
Use the same counting method, store boundaries and opening-hour rules each week. Check daily totals for missing periods, duplicate counts or unexpected changes, then compare them with operating hours and known store activity. A line chart shows the weekly direction; column charts compare days, while an hour-by-day heatmap highlights busy periods. Break results down by location only when counting coverage is consistent.
-
Calculate growth and conversion rates
Calculate weekly growth as (this week’s visits − last week’s visits) ÷ last week’s visits × 100. For example, compare the resulting percentage with the prior week’s count, not just the raw difference. Calculate conversion as transactions ÷ visits × 100, using transaction data from the same store and period. Label both measures clearly, and flag that visits and transactions may not represent identical customer groups.
-
Compare periods and account for seasonal effects
Show the latest week beside the previous week and, where available, the same week last year. Add a week-by-week table and chart for the last 4 weeks to reveal direction beyond a single comparison. Annotate Australian public holidays, school holidays, promotions and seasonal trading patterns; these can shift daily and hourly demand. Compare like-for-like days and locations, and note counting limitations such as missed entrances or equipment interruptions.
Basic weekly report template
Use a consistent one-page layout so managers can scan results, explain changes and assign actions. Define the reporting window, then complete these four sections.
- Summarise completed work. Cover the past five working days and state the key visit result. Add the comparison with the week before, plus one concise explanation for a notable change. For example, identify whether a rise occurred across the store or mainly at a particular location. Separate observed results from possible causes so readers can judge the evidence clearly.
- Record blockers and context. Note anything that affected counting or trading, such as missing data, changed opening hours or a local promotion. Include the dates and locations involved. This keeps an unusual total from being mistaken for a sustained customer pattern, and helps the next review distinguish operational issues from actual shifts in visits.
- Set upcoming priorities. List two or three actions for the coming week, each with a named owner. Tie each action to a reported pattern, such as reviewing staffing around a consistently busy period. Keep the action specific enough to assess at the next check-in, rather than using broad aims such as “improve store performance”.
- Show goal status. State whether each relevant target is on track, behind or complete, and give the supporting visit measure. Keep the report to a single page where possible, so stakeholders can understand it in less than two minutes. A stable layout also makes changes between reporting weeks easier to spot.
For help with the people-counting setup behind recurring reports, consider the Basic Support Plan.
A useful final check is to ensure the completed-work section captures achievements from the last five working days. A weekly report can organise its content around past achievements, current work and future plans. This structure gives readers a clear progression from what has happened to what is underway and what comes next.
What should a weekly foot traffic report include?
Choose measures that explain where visits changed, when they changed and what to do next. Keep the reporting window consistent so each update supports a clear decision.
- Show the headline and comparison. State the reporting dates, total visits and change from the previous week. Add a week-by-week table and chart covering the last 4 weeks, or 28 days, to show whether movement is continuing. A single total describes volume; the trend adds direction and helps distinguish a short-lived shift from a developing pattern.
- Break down movement by time and place. Include daily totals, then show hourly patterns for relevant store areas or locations. A column chart makes day-to-day differences easy to scan; a heatmap can reveal busy time blocks. Keep labels consistent across reports, and explain any gaps in coverage so readers don’t mistake incomplete counts for quieter trading.
- Connect the data to goals and context. Show each relevant goal’s status beside its supporting measure. Add concise notes for events that may shape interpretation, such as a promotion, altered opening hours or a holiday period. Separate the observed count from its possible explanation. This gives managers useful context without presenting an assumption as a proven cause.
- End with accountable next steps. Identify two or three actions for the coming week and assign an owner to each. Tie every action to a reported pattern, such as reviewing coverage during a recurring peak. Keep the finished report brief enough to read in 90 seconds, with details prioritised for decisions rather than decoration.
Improve the visibility of store visit patterns with a reporting approach built around consistent foot traffic data.
The plan states that pedestrians should generally be prohibited from entering restricted areas. Note relevant access constraints when interpreting changes in movement.
Footfall Australia
Footfall Australia helps retailers build a consistent foundation for weekly visit reporting through people-counting technology and software. If store totals are difficult to compare across locations or reporting periods, its offerings include FootfallCam Pro2 People Counters, FootfallCam Pro1 IP Cameras, FootfallCam Centroid and FootfallCam V9 Software.
These tools are useful when you need to measure store visits systematically and turn the data into clear reports. The right setup depends on your locations, counting requirements and how your team will use the results. A consistent measurement approach makes weekly comparisons easier to interpret and connect with operational decisions.
Contact Footfall Australia to discuss the foot traffic reporting needs of your stores.
Make each reporting cycle more useful
A weekly foot traffic report template is more valuable when its measures consistently inform the next operational decision. Use each reporting cycle to identify what needs attention, then link that observation to a practical action your team can review later. Over time, this builds a clearer view of how store visits relate to staffing, trading patterns and location-level priorities.
When you need a stronger foundation for measuring visits across your stores, Footfall Australia offers people-counting options including FootfallCam Pro2 People Counters, FootfallCam Pro1 IP Cameras and FootfallCam Centroid. Choose a measurement approach that fits the locations and decisions your reporting needs to support.
Contact Footfall Australia to discuss your store foot traffic reporting needs. A consistent measurement process can help turn weekly observations into informed next steps.
Frequently Asked Questions
Where can I find a free weekly foot traffic report template?
You can create a report in a spreadsheet using a weekly foot traffic report template with columns for date, store, visits, data source and notes. Add a row for each reporting period, then use formulas to calculate changes consistently. Keep a blank copy as your master so each week’s report follows the same structure without overwriting earlier results.
What key metrics should a foot traffic report track?
Track visitor count, change against a comparable period, peak trading times and location-level patterns. If transaction data is available for the same store and timeframe, include conversion to show how visits relate to purchases. For example, traffic may stay steady while the conversion rate changes, indicating that visit volume alone may not explain trading performance. For service-oriented retail businesses such as The Fitting Room Tailoring, pairing customer counts with completed orders helps ensure staffing levels match peak drop-off and fitting times.