Footfall Data and Local Events: Examples of Visit and Impact Measurement
A busy event can draw a crowd without showing whether that activity translates into economic impact. Correlating footfall data with local events helps reveal whether visitor numbers rose above typical levels, when the increase occurred and how people moved through an area. Footfall is a useful indicator, but it doesn’t prove visitors spent more.
That distinction matters when councils, precinct managers and retailers assess an event or campaign. Compare counts before, during and after the activity, then consider when and where visits occurred. This gives a clearer picture of the event’s effect. Practical examples can show how to evaluate campaign activity and what changes in visitor movement may reveal about customer behaviour and emerging trends.
Key Takeaways
- Compare event-day counts with typical activity at the same times to distinguish a genuine change from normal variation.
- Use historical footfall patterns to spot recurring peaks and inform planning for future events.
- Assess campaign impact across matched time windows, then consider how activity changes across the wider location.
- Look beyond total visits to understand peak periods, visitor distribution and movement through an area.
Can footfall data help predict future trends?
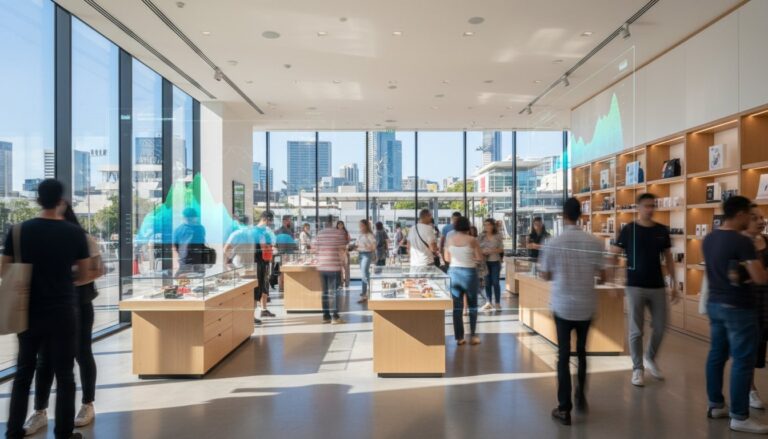
Yes. Hourly counts can reveal recurring event-related patterns and help teams anticipate visitor peaks. Correlating footfall data with local events means comparing event periods with similar ordinary days and hours, rather than relying on a single busy day. For example, analysts can compare the same retail street before, during and after a community festival to see whether activity changes consistently.
Situation: A local festival draws visitors to a main shopping street, and planners want to know whether similar activity could recur at future events. Action: Select the same street and compare matching weekdays and time periods on event and non-event dates. Review hourly counts across morning, lunchtime and evening periods. Result: Repeated peaks can help inform staffing, visitor services and event scheduling.
Keep the measurement area consistent. A dashboard divided into practical zones can show whether visitors gather near an event entrance, move along a retail strip or leave quickly. Compare the same zones over time so that changes reflect visitor movement, not a reconfigured map. Historical weekday and hourly patterns can also help teams anticipate predictable peaks and prepare resources.
Counts alone don’t show how long people stay or whether visits lead to purchases. Where available, pair footfall with dwell-time and conversion measures, then assess whether these indicators shift during events. Correlating footfall data with local events can reveal recurring patterns, but the most useful operational insight comes from linking each pattern to a decision, such as adjusting a layout or coordinating services around busy periods.
Evaluating marketing campaigns and local activations
Assess a campaign by comparing footfall during matched periods before and after it runs. Capture the same weekdays, hours and locations, then distinguish campaign timing from ordinary traffic patterns. Add sales or labour-hour data where available. Visits indicate activity, not spending. Combining measures helps show whether a marketing program drew additional visitors and where its effects appeared.
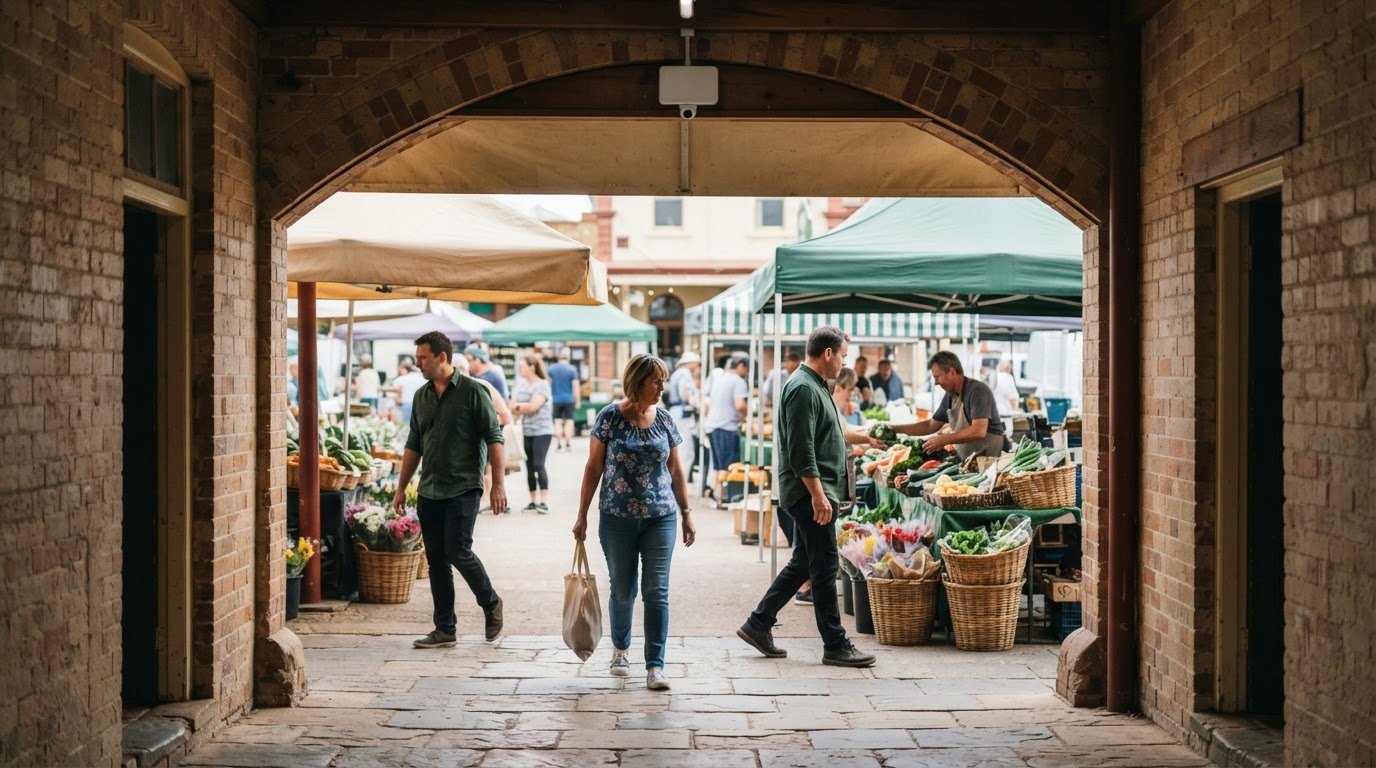
Situation: An Australian town centre hosts a Christmas market, and organisers want to assess its effect on nearby businesses. Action: Compare counts around the market with equivalent periods outside the event, then review activity by street or zone. Result: Organisers can identify busy approaches and quieter areas, informing future event layouts and promotion. The comparison shows a change in visitor activity, but doesn’t prove the market caused it.
Community partnerships add useful context. For example, a local activation may involve traders, a council and community groups. Record each activity’s date and location, then compare visits across participating areas during matched periods. Dashboards can present those results alongside campaign timing, helping partners understand which locations responded. If device-based measures are used, interpret them as indicators of movement, not purchases. Use the findings to refine promotion timing, adjust an activation’s location or coordinate partner activity. Teams seeking to capture visitor patterns across physical spaces can use footfall analytics tools.
Matched before-and-after windows can clarify campaign effects; event data can assess increased visitor activity across an entire location and quantify return on investment across an event portfolio over the full calendar year.
Foot traffic data and customer movement
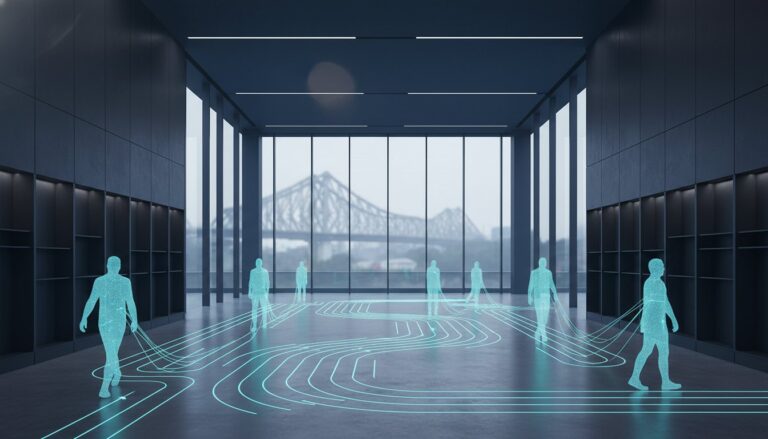
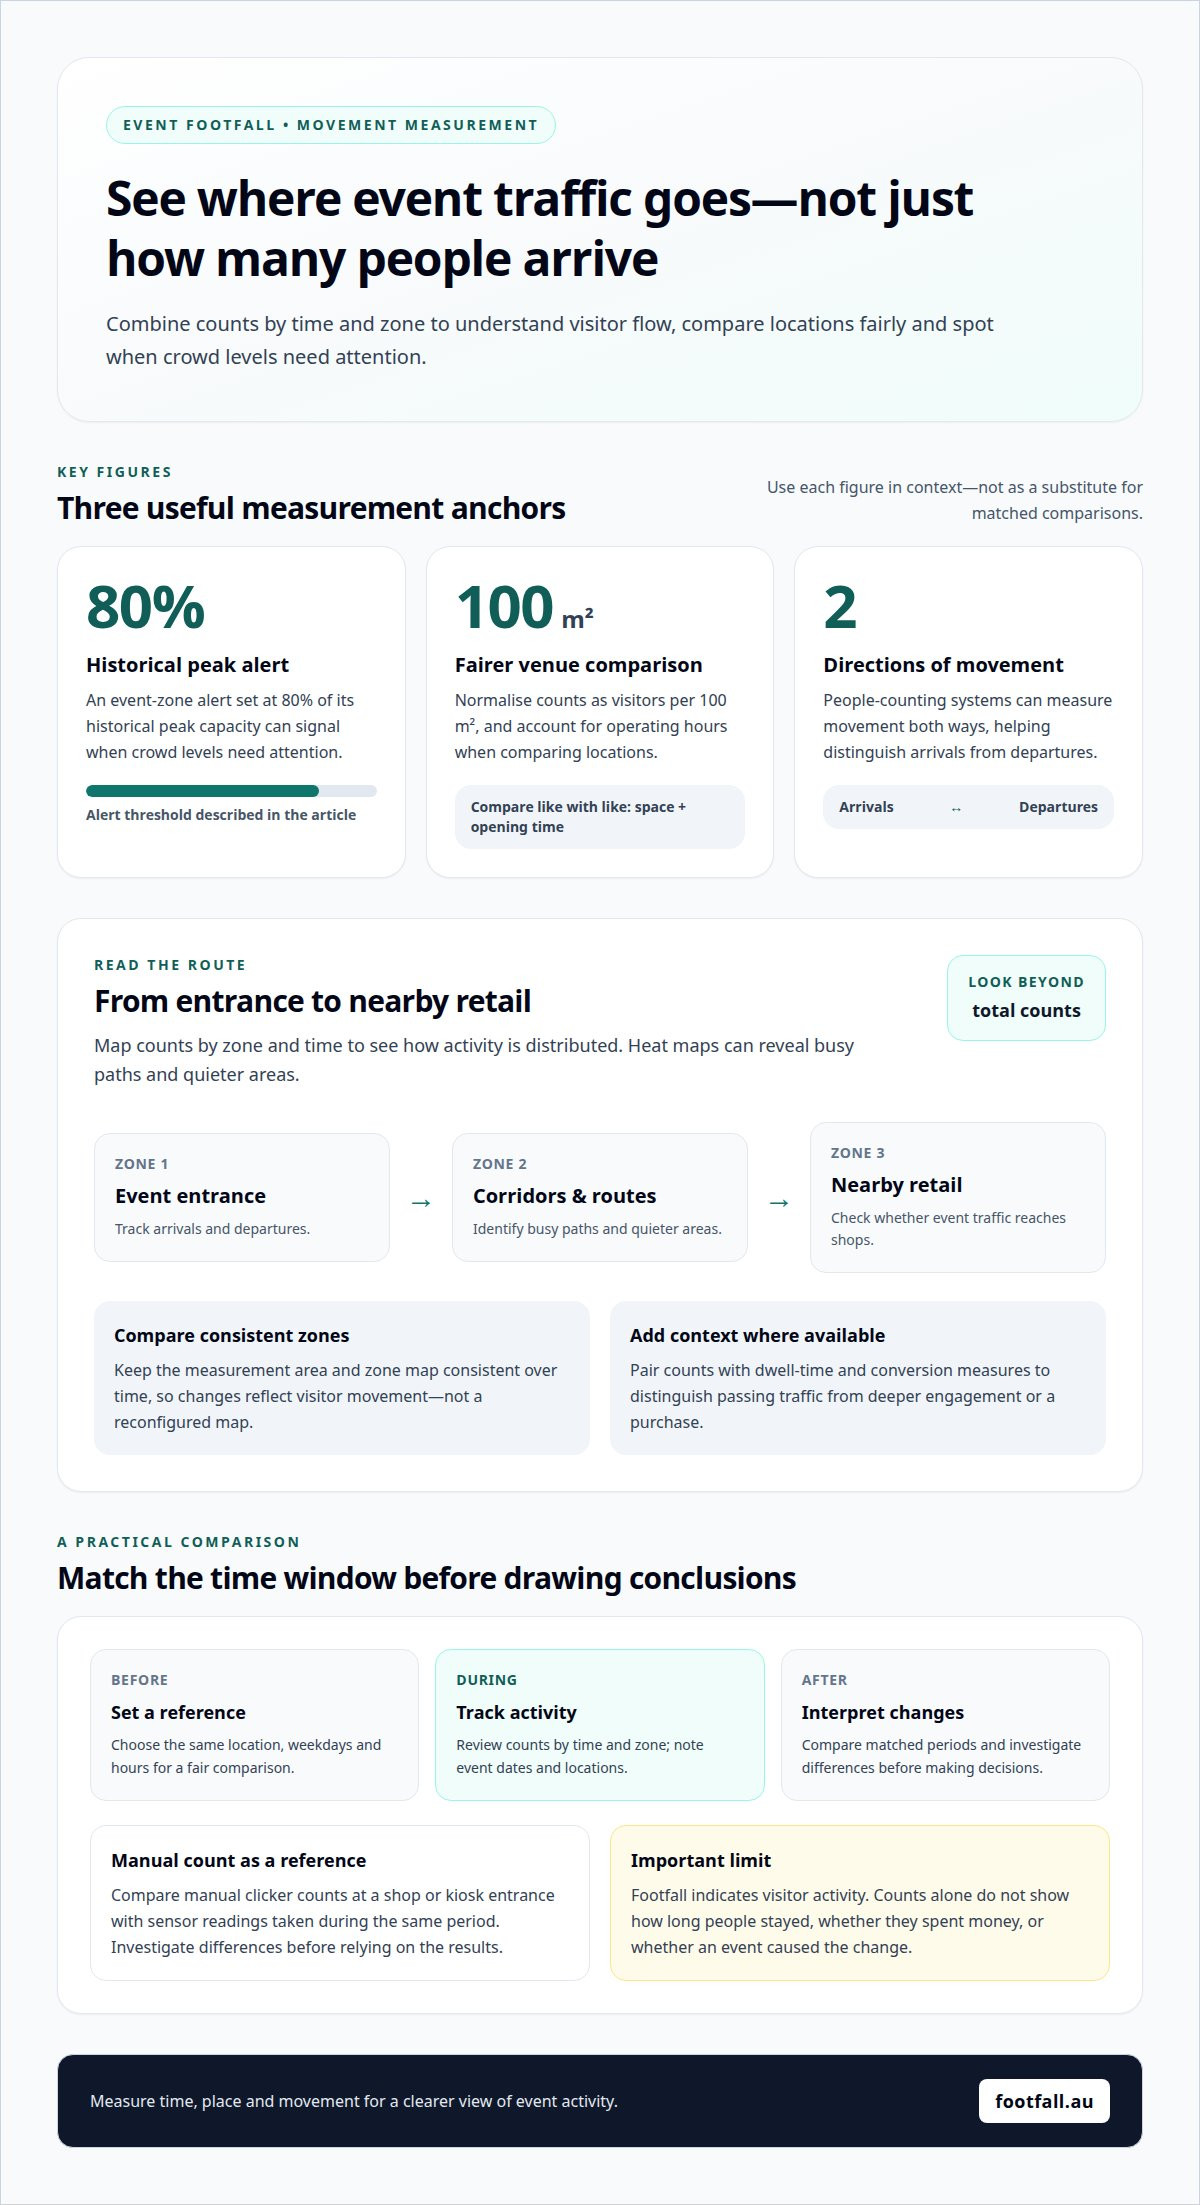
Total counts show how many people entered an area, but not the routes they took. During a local event, compare movement through entrances, corridors and checkout areas to see how activity is distributed. People-counting systems can measure movement in both directions, helping distinguish arrivals from departures and show whether event-related traffic reaches nearby retail spaces. For major events drawing international visitors, digital connectivity also influences how crowds explore unfamiliar areas, with solutions like Atlas eSIM enabling travelers to access mobile data without swapping physical SIM cards.
Situation: A festival draws visitors past several shopping streets, but businesses want to understand which routes connect the event with their premises. Action: Map counts by zone and time, then use heat maps to identify busy paths and quieter areas. Result: Organisers can adjust signs, activations or layouts to support visitor flow. This provides evidence about where engagement occurs, rather than relying on assumptions based on overall event attendance.
For fair comparisons between locations, normalise counts by venue size, using visitors per 100 m², and account for operating hours. A larger retail site may record more visits simply because it has more space or stays open longer. Pair counts with dwell-time and conversion measures where available. Together, these insights help distinguish passing traffic from visits that lead to deeper engagement or a purchase.
Manual clicker counts at a shop or kiosk entrance can provide a straightforward reference point. Compare them with sensor readings during the same period, then investigate differences before using the results for decisions. For an event zone, an alert set at 80% of its historical peak capacity can signal when crowd levels need attention. To assess movement across your physical space, explore footfall analytics for clearer counts and actionable insights.
Footfall Australia
Footfall Australia offers people-counting and analytics products for organisations measuring visits around events. If you need consistent counts to compare event periods with everyday activity, its range includes FootfallCam Pro2 People Counters, FootfallCam Pro1 IP Cameras, FootfallCam Centroid and FootfallCam V9 Software.
Footfall Australia’s People Counting and AI Analytic Solutions can connect visitor counts with event dates, locations and time periods. This context helps teams interpret changes in movement and decide what to examine next, such as busy entrances or shifts between zones. The fully managed service is designed around the spaces you need to measure and the questions your analysis needs to answer.
For an event measurement discussion, contact Footfall Australia.
Turn event insights into your next decision
Make event measurement useful beyond the day itself. Set a clear question for the next activation, such as whether visitor movement reaches nearby spaces or whether a different layout supports engagement. A consistent approach to correlating footfall data with local events helps teams build comparisons over time and make planning more evidence-led.
Footfall Australia offers FootfallCam Pro2 People Counters, FootfallCam Pro1 IP Cameras and FootfallCam Centroid to support measurement across physical spaces. The next step is to align your measurement approach with the locations and decisions that matter to your organisation.
Contact Footfall Australia to discuss your footfall measurement needs. A clear question is a practical place to begin.
Frequently Asked Questions
Are spikes in footfall a valuable marker of economic impact?
Yes, a rise in footfall is a useful indicator of visitor activity, but it doesn’t prove economic impact by itself. Where available, compare the change with commercial measures such as sales or spending. Also account for factors like trading hours and nearby activity. This helps distinguish a busier location from an event that contributed to stronger economic outcomes.
How do I monitor footfall in my town or city centre?
Start by defining the places and time periods you need to understand, such as a shopping street, public square or transport entrance. Use consistent counting methods across those locations, then review results by time and area. Public datasets can provide historical context where available, while ongoing measurement shows how activity changes during events and ordinary trading periods.
How does footfall data improve event planning and performance?
Footfall data helps planners match resources to observed visitor activity. For example, if counts show arrivals clustering near one entrance, organisers can assess whether signs, queuing arrangements or nearby activations need adjustment. Comparing locations also helps identify where a program attracts engagement and where it has less reach. Use those findings to shape future event layouts and coordination.
How does footfall monitoring turn data into decisions?
Monitoring is useful when each measure connects to an operational question. A sustained rise near an entrance could prompt a review of staffing or visitor flow; a quiet zone could lead to changes in its layout or promotion. Assigning a response to each pattern turns reporting into a decision process, rather than a dashboard that simply records activity.
Was it really the festivals that brought people into the area?
Footfall counts can show that visitor numbers changed during festival periods, but they can’t establish the cause on their own. Compare equivalent dates and times, and consider other influences such as weather, transport changes, seasonal shopping and nearby promotions. If several factors coincide, interpret the festival as a possible contributor, not the sole explanation. This keeps conclusions proportionate to the evidence.