Measuring Marketing Campaign Impact on Store Footfall
More store visits do not automatically mean a campaign caused them. Measuring marketing campaign impact on store footfall works best when you compare visits with a pre-campaign baseline, track in-store sales and conversion, and use a comparable control group to estimate what changed because of the campaign.
It is reasonable to want a clear view of which digital activity brings people through the door and whether those visits lead to sales. This guide explains how footfall attribution works, how to assess online campaign effects in Australian stores, and how to set measurable outcomes before a campaign begins. It also explains why choosing the right business goal matters as much as choosing the right measurement tools.
Key Takeaways
- Set a separate pre-campaign baseline for each channel, using matching weekdays and hours to make visit changes easier to interpret.
- Use a comparable control group to distinguish campaign-driven visits from traffic that might have occurred anyway.
- Read footfall alongside transactions, conversion and revenue to understand whether extra visits translated into store sales.
- Define the business outcome first, then choose measurement tools such as FootfallCam Pro2 People Counters to support useful, evidence-led decisions.
Footfall attribution across online and physical retail
Online campaigns can influence store visits, website purchases and in-store sales. Attribution connects campaign touchpoints with those outcomes, but it does not prove the campaign caused them. For businesses optimising local search and digital campaigns to drive nearby foot traffic, digital agencies like PurpleCow Digital focus on aligning online visibility with measurable real-world visits.
Connecting Online Campaigns to Store Visits
Visit attribution links campaign exposure, such as an ad view, with a later visit to a physical store. This helps retailers see whether online activity coincides with changes in store traffic. According to the Australian Competition and Consumer Commission, mobile data can measure offline conversions by tracking actions based on a user’s presence in a store. However, a recorded visit identifies a journey touchpoint, not necessarily a campaign-driven decision. A national dining chain campaign associated a specific channel placement with a 29% visit lift, illustrating how results can be assessed for individual placements.
Channel Baselines and Attribution Windows
A channel baseline is its typical traffic and sales before a campaign, while an attribution window defines how long after exposure a visit or purchase can be connected to it. Build separate baselines for each channel, then compare matching weekdays and hours before and during the campaign. Choose a window that reflects the campaign and buying journey: too short may miss considered purchases, while too long can credit unrelated activity. Consistent reporting makes these choices visible when reviewing results.
Retail sales can follow several paths: a direct click to purchase, a later purchase on the retailer’s e-commerce site, or an in-store transaction with no trackable click. Reporting only direct purchases can miss this halo effect. In large organisations, separate platforms and teams can also leave channel reports disconnected. Combine base revenue with estimated halo revenue to assess broader retail impact, while treating attribution as evidence of association, not proof of causation. A holdout group offers a stronger test by comparing exposed audiences with comparable people who did not receive the campaign.
Measuring digital campaign impact on physical store sales
Measuring marketing campaign impact on store footfall means connecting changes in visits with transactions and incremental sales. Set the outcome first, then choose metrics that show whether campaign activity influenced store performance.
Footfall Uplift and Visit Conversion
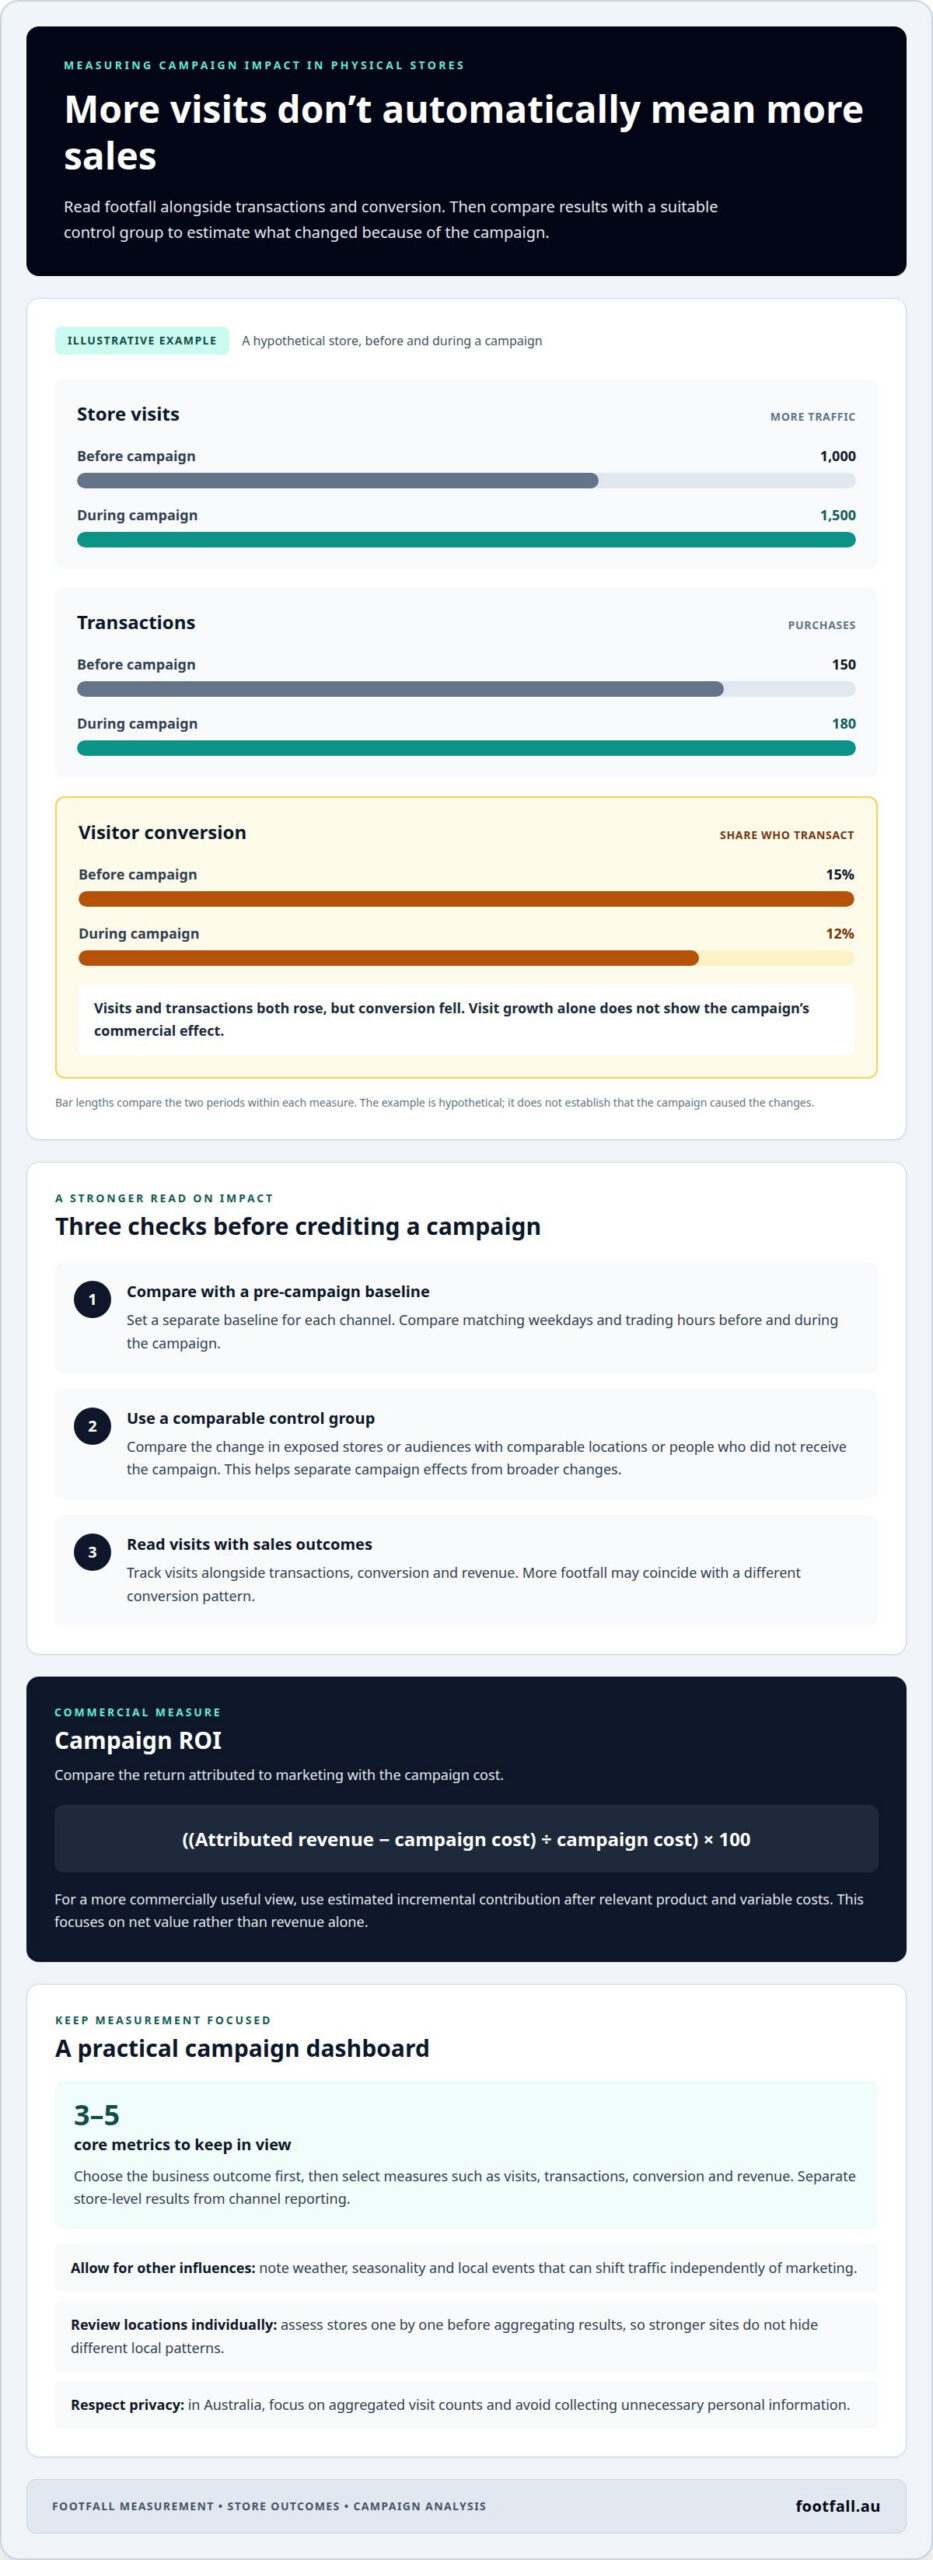
Footfall uplift tracks the change in visits during a campaign; conversion shows the share of visitors who transact. Together, they reveal whether additional traffic became purchases. For example, a hypothetical store moves from 1,000 visits and 150 transactions to 1,500 visits and 180 transactions. Visits rise, but conversion drops from 15% to 12%, so visit growth alone doesn’t show the campaign’s commercial effect.
Estimate incremental sales by comparing campaign results with a comparable control group, rather than crediting all sales growth to marketing. Sales can also help estimate visits by dividing transactions by the store’s conversion rate. Because that estimate changes when conversion shifts, use it as an analytical aid, not a direct count. The Australian Competition and Consumer Commission notes that mobile data can measure offline conversions through a user’s presence in a store.
Campaign ROI Calculations
Campaign ROI compares the return attributable to marketing with its cost. Calculate it by subtracting campaign cost from attributed revenue, dividing by campaign cost, then multiplying by 100. For a more commercially useful assessment, use estimated incremental contribution after relevant product and variable costs. This focuses on net value rather than revenue alone.
A disciplined method for measuring marketing campaign impact on store footfall can also track retention, customer lifetime value and pipeline after a campaign ends. For physical traffic measurement, people-counting tools can complement sales and campaign metrics.
Defining campaign business outcomes and measurable goals
Start with the business outcome, then choose analytics that connect campaign activity to actual store results. A clear goal makes clicks, display exposure and store visits easier to interpret.
Before-and-After Footfall Metrics
Before-and-after metrics compare historical store performance with campaign-period results, showing how traffic and customer behaviour changed. Track visits, transactions, conversion and revenue, using matching weekdays and trading hours for a fair comparison. Keep a focused dashboard of 3-5 core metrics, separating store-level results from channel reporting. This helps teams see whether more visits coincided with stronger sales or simply changed traffic patterns.
In Australia, use privacy-aware measurement focused on aggregated visit counts and avoid collecting unnecessary personal information. Consider privacy obligations when selecting tracking methods and deciding what data to retain.
Weather, seasonality and local events can shift traffic independently of marketing. Compare equivalent periods and note disruptions in store reports. For multiple locations, review results store by store before aggregating them, so stronger sites do not conceal different local patterns.
Control Stores and A/B Testing
Control stores help estimate campaign lift by comparing locations exposed to the campaign with comparable stores that were not. Measure the change in both groups, then assess the difference to help separate campaign effects from broader changes. A/B testing compares two versions of a marketing asset, such as display creative, to identify which produces more conversions. Keep other conditions as consistent as practical.
Choose the outcome before launch, such as incremental visits or store conversion, and connect it to a business decision. Plan store footfall measurement around clear goals and comparable location data.
Footfall Australia
Footfall Australia helps retailers measure store traffic and interpret customer movement alongside campaign outcomes. When you need consistent visit data to assess changes in physical-store activity, its people-counting and analytics offerings can support that measurement process.
FootfallCam Pro2 People Counters and FootfallCam Pro1 IP Cameras provide options for capturing store activity, while FootfallCam Centroid and FootfallCam V9 Software support people-counting analysis. The right combination depends on your locations, measurement goals and how you plan to use the resulting data in campaign reporting.
Contact Footfall Australia to discuss measuring store footfall against your campaign objectives.
Make Your Next Campaign More Measurable
The next step is to build a measurement framework your team can use consistently. Set the business outcome before launch, decide which evidence will inform it, and connect campaign activity with store performance in reporting. A disciplined approach to measuring marketing campaign impact on store footfall helps teams look beyond platform-reported clicks and focus on what changes in physical retail.
Footfall Australia offers FootfallCam Pro2 People Counters, FootfallCam Pro1 IP Cameras and FootfallCam Centroid to support people-counting needs. Consider how store traffic data could fit alongside your existing campaign and sales reporting, then use that view to guide future decisions.
Contact Footfall Australia to discuss attribution and explore a practical approach for your stores. Clearer measurement can help your next campaign start with a stronger basis for learning.
Frequently Asked Questions
What are the best tools for foot traffic attribution?
A useful setup combines people-counting data, campaign exposure records and store sales data. People-counting measures visits, while analytics help relate traffic patterns to campaign timing and location. For example, a retailer can compare visits near a promoted display with sales during the same period. Choose tools according to whether the main goal is counting visits, understanding movement or estimating incremental impact.
Can a heat map show whether a campaign display drew shoppers?
A heat map can show where shoppers moved, paused or gathered, helping assess activity around a display. It may reveal whether a display zone attracted attention during campaign hours, but cannot establish by itself that the campaign caused the behaviour. Compare the zone with its usual activity and a similar area without the display to interpret the pattern more carefully.
How Does It Work?
A footfall measurement system records movement in selected store areas and turns those observations into reports for analysis. Campaign dates and locations provide context for reviewing traffic patterns. A measurement plan can also combine visitor behaviour with factors such as sales, weather and marketing activity, helping teams interpret results without treating a single metric as a complete explanation.
How do I track conversion during an in-store campaign?
Divide completed store transactions by visits for the same location and campaign period. Keep the time window and store area consistent, then compare the result with a suitable reference period or control location. For example, a retailer running a demonstration can review conversion during demonstration hours separately from the rest of the day. This can show whether campaign timing coincides with a change in purchasing behaviour.
What data does it provide?
Depending on the measurement system, reporting can include visitor counts, occupancy, zone use, movement paths and engagement patterns. Footfall Australia’s AI for Vision captures entry-to-exit journeys, traffic paths, engagement, demographics and staff interactions. Its privacy-first approach masks data at the source, with no personally identifiable information collected or stored. These measures help organisations understand how people use a space, not just how many enter.