

Acceptable Margin of Error for People Counters
A people counter has no single acceptable error margin for every site: the right tolerance depends on how the count will guide decisions. For survey-style estimates, researchers commonly use a margin of error between 3% and 6% at a 95% confidence level, but that benchmark isn’t a universal counter-accuracy standard. The acceptable margin of error for people counters should reflect the operational decisions the data needs to support.
It’s reasonable to want a clear measure of precision before relying on footfall data. This guide explains how margin of error is calculated, how sample size affects survey estimates, and what to consider when deciding whether a margin is acceptable for your needs. It also explains why a survey’s statistical margin of error and a people counter’s measurement accuracy describe different things.
Key Takeaways
- Interpret a margin of error alongside its confidence level; together, they show how to read an estimate’s precision.
- Use sample size to understand how much uncertainty remains, and why collecting more observations can narrow the margin.
- Set an acceptable tolerance around the decisions your footfall data needs to support, rather than treating survey benchmarks as counter specifications.
- Explore how people-counting technology can help measure movement consistently and turn footfall data into operational insight.
How is Margin of Error calculated?
For survey estimates, margin of error depends on the confidence level, response variability and sample size. People-counter accuracy is measured differently, by comparing recorded counts with a reference count.
Confidence Levels and Intervals
A confidence interval is the range around a survey estimate that reflects its margin of error at a chosen confidence level. It helps you judge whether survey results are precise enough to support a decision.
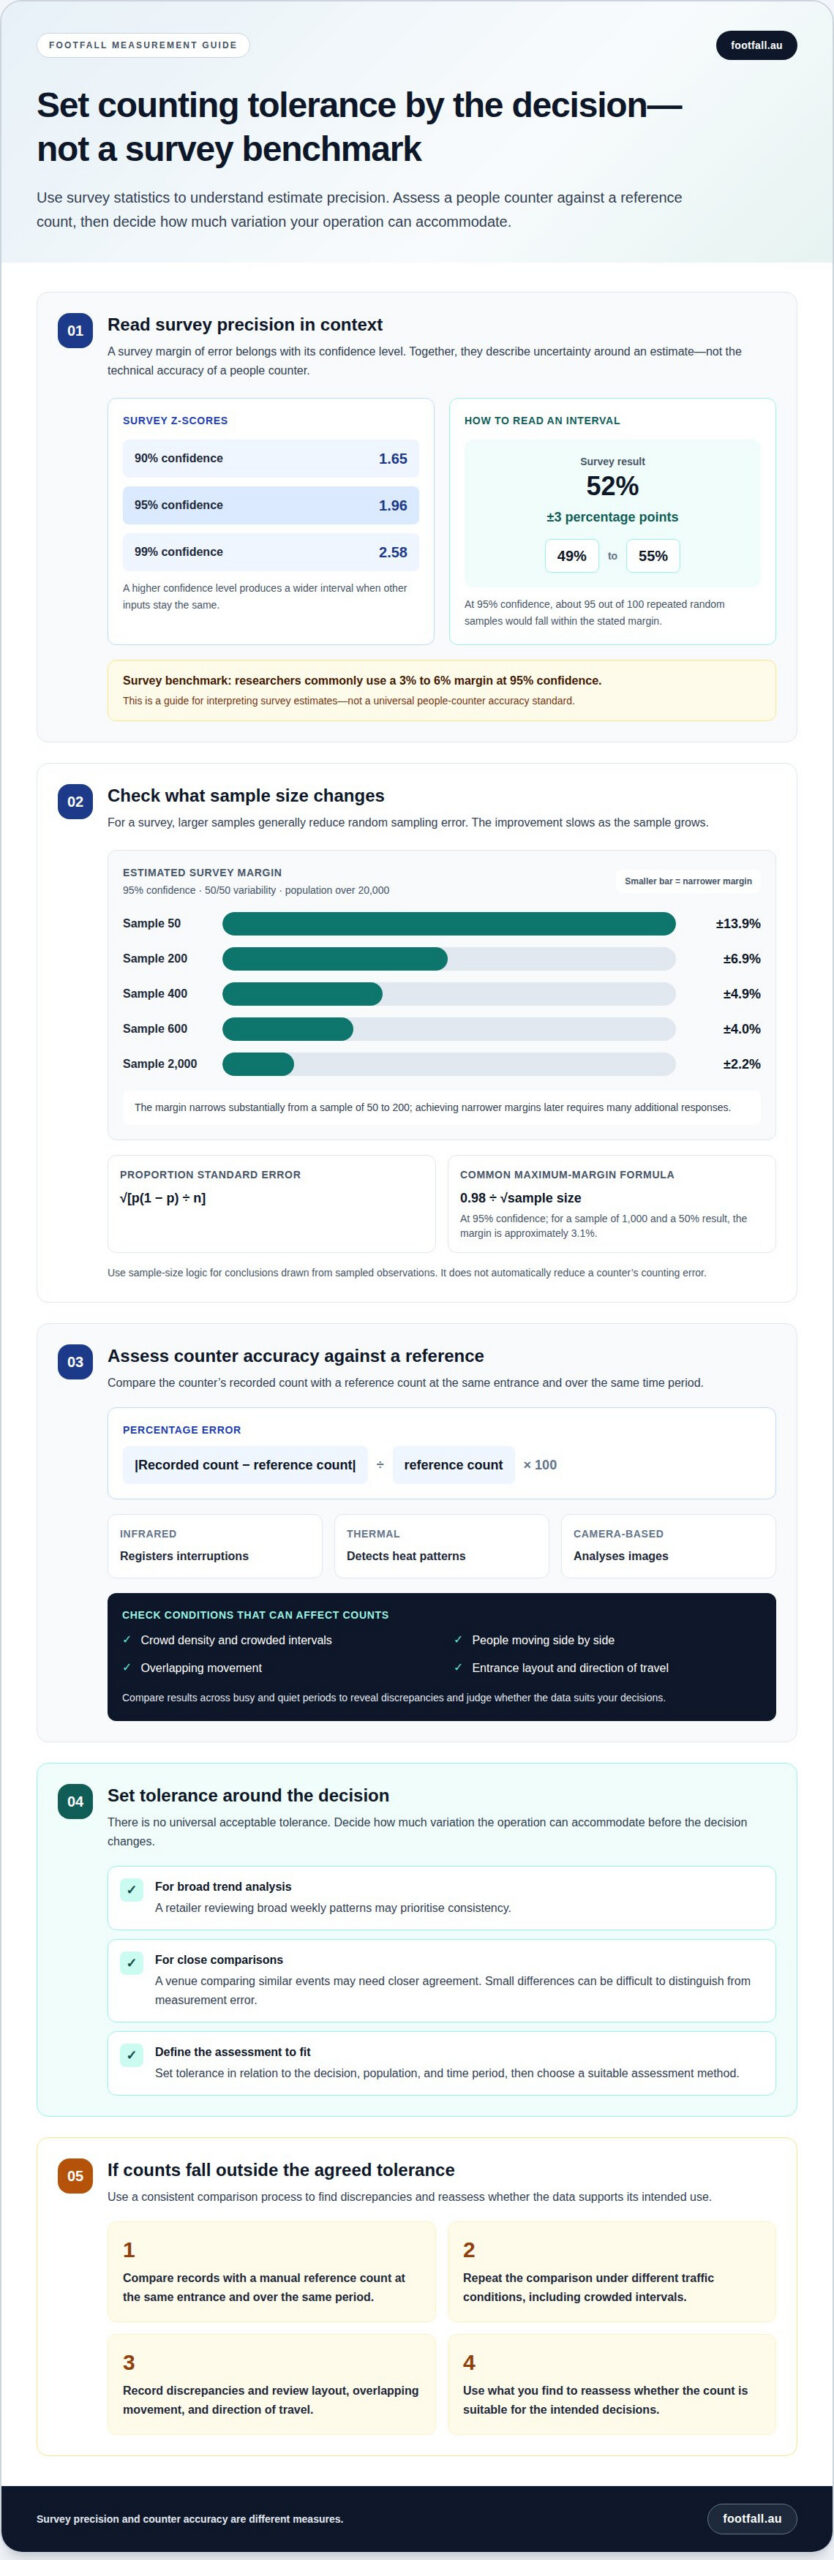
For example, a result of 52% with a ±3 percentage-point margin gives an interval from 49% to 55%. At 95% confidence, about 95 out of 100 repeated random samples would fall within the stated margin. The interval describes uncertainty in an estimate; it isn’t a measure of a people counter’s accuracy.
Using Confidence Levels and Z-Scores
A Z-score shows how far a confidence level extends from an estimate in standard-error units. A higher confidence level produces a wider interval when the other inputs stay the same.
For survey calculations, the Z-score is 1.96 at 95% confidence, 1.65 at 90%, and 2.58 at 99%. A common maximum-margin formula at 95% confidence is 0.98 divided by the square root of sample size. For a sample of 1,000 and a 50% result, the margin is approximately 3.1%. Choose the confidence level and margin that suit the desired precision.
Testing People Counter Accuracy
People-counter accuracy is tested by comparing its count with a reference count over the same entrance and time period. The percentage error can be calculated as the absolute difference between counts, divided by the reference count, then multiplied by 100.
Infrared systems register interruptions, thermal systems detect heat patterns, and camera-based systems analyse images. Their performance depends on system design and site conditions. Crowd density, overlapping movement, entrance layout, and people walking side by side can affect counts. Comparing results across busy and quiet periods can reveal discrepancies and help determine whether the data is suitable for your decisions.
Sample size and precision
In a survey, sample size affects how closely an estimate reflects the wider population. Larger samples generally reduce random sampling error, although the improvement slows as the sample grows. These calculations describe survey precision, not a people counter’s technical error rate.
For a proportion, the standard error is calculated from the sample proportion, its complement and sample size: √[p(1 − p) ÷ n]. A margin-of-error formula multiplies that error by the Z-score for the desired confidence level. Assuming 50/50 variability is a common, conservative choice when the proportion is unknown. Standard deviation also matters when estimating values rather than proportions.
At 95% confidence and 50/50 variability, the estimated margins are ±13.9% for a sample of 50, ±6.9% for 200, and ±4.9% for 400. At 600, the margin is ±4.0%; at 2,000, it is ±2.2%. This comparison assumes a population over 20,000.
The pattern shows diminishing returns. Increasing a sample from 50 to 200 substantially narrows the interval, while reaching a narrower margin later requires many additional responses. To determine a suitable sample size, start with the precision needed for the decision, then consider population size and expected variability. A smaller subgroup also has less precision if it contains fewer respondents than the full survey.
For people-counting projects, use survey sample-size logic only when drawing conclusions from a sampled set of observations. Assess counter performance separately against reference counts under the operating conditions that matter. For context on people-counting measurement, connect the data requirements to the decisions the count must support.
Acceptable margin of error
There is no universal acceptable tolerance: it depends on the decisions supported by the count. Survey benchmarks can help with interpretation, but they do not define counter accuracy. Set an acceptable margin of error for people counters according to how much variation your operation can accommodate before a decision changes.
Defining an Acceptable Error Range
An acceptable margin is the difference between a counter’s result and a reference count that a business can tolerate for its intended decision. It matters because a discrepancy that has little effect on broad trend analysis could affect comparisons between closely matched periods. Survey researchers commonly use a 3% to 6% margin at 95% confidence, but that benchmark applies to survey estimates, not technical counter accuracy.
Retailer and Venue Accuracy Requirements
Australian retailers and venues set accuracy requirements according to how they use the data, so no single percentage suits every site. A store reviewing broad weekly patterns may prioritise consistency, while a venue comparing similar events may need closer agreement. Set the acceptable margin of error for people counters in relation to the decision, population, and time period, then choose a suitable assessment method.
When two periods differ only slightly, measurement error may make it difficult to tell whether the change is meaningful. A larger survey sample can improve survey precision, but it will not automatically reduce a counter’s counting error.
Responding to Counters Outside Tolerance
If results exceed the agreed tolerance, compare the counter’s records with a manual reference count at the same entrance and over the same period. Repeat the comparison under different traffic conditions, including crowded intervals, and record any discrepancies. Review the entrance layout, overlapping movement, and direction of travel to identify patterns that could affect detection.
Use those findings to reassess whether the data supports the intended decisions. To discuss site-specific people-counting requirements, explore people-counting options.
Footfall Australia: FootfallCam Pro2 People Counters
Footfall Australia offers FootfallCam Pro2 People Counters for organisations measuring visitor movement across physical spaces. The right next step is to match the counter choice to your site, the decisions your counts support, and the accuracy checks you plan to use.
For a broader measurement setup, Footfall Australia also offers FootfallCam Pro1 IP Cameras, FootfallCam Centroid and FootfallCam V9 Software. Each offering has a distinct role, so focus on the data your operation needs rather than treating a survey margin of error as a product accuracy claim.
Clear reference counts and consistent review conditions help you assess whether the resulting data is useful for your decisions. Contact Footfall Australia to discuss your people-counting requirements.
Make Footfall Data More Actionable
The acceptable margin of error for people counters is most useful when it reflects your organisation’s decisions. Treat the tolerance as an operational guide: define what level of difference could change a decision, then use consistent comparisons to assess whether the data remains useful.
As your site, visitor behaviour, or reporting needs change, revisit the assumptions behind your measurement approach. Regularly reviewing counts can help distinguish meaningful changes in movement from discrepancies that need investigation. This gives teams a clearer basis for planning and keeps footfall data connected to operational decisions.
For a people-counting setup aligned with your requirements, contact Footfall Australia to discuss your counters. A considered approach can turn visitor movement into evidence your team can use with confidence.
Frequently Asked Questions
What is an acceptable accuracy rate for people counters?
There is no single accuracy rate that suits every Australian retailer or venue. Set a tolerance based on how you will use the count: reviewing broad trends may allow more variation than making staffing decisions based on differences between comparable trading periods. Define which entrances and visitor movements to include, then assess whether discrepancies could change your decision.
How does people counter accuracy vary by technology, such as infrared, thermal, and camera-based?
Infrared systems register interruptions, thermal systems detect heat patterns, and camera-based systems analyse images. There is no universal accuracy ranking: performance depends on system design and site conditions, including crowd density, overlapping movement, entrance layout, and people walking side by side.