How to Reduce Customer Wait Times: A Data-Driven Guide for 2026
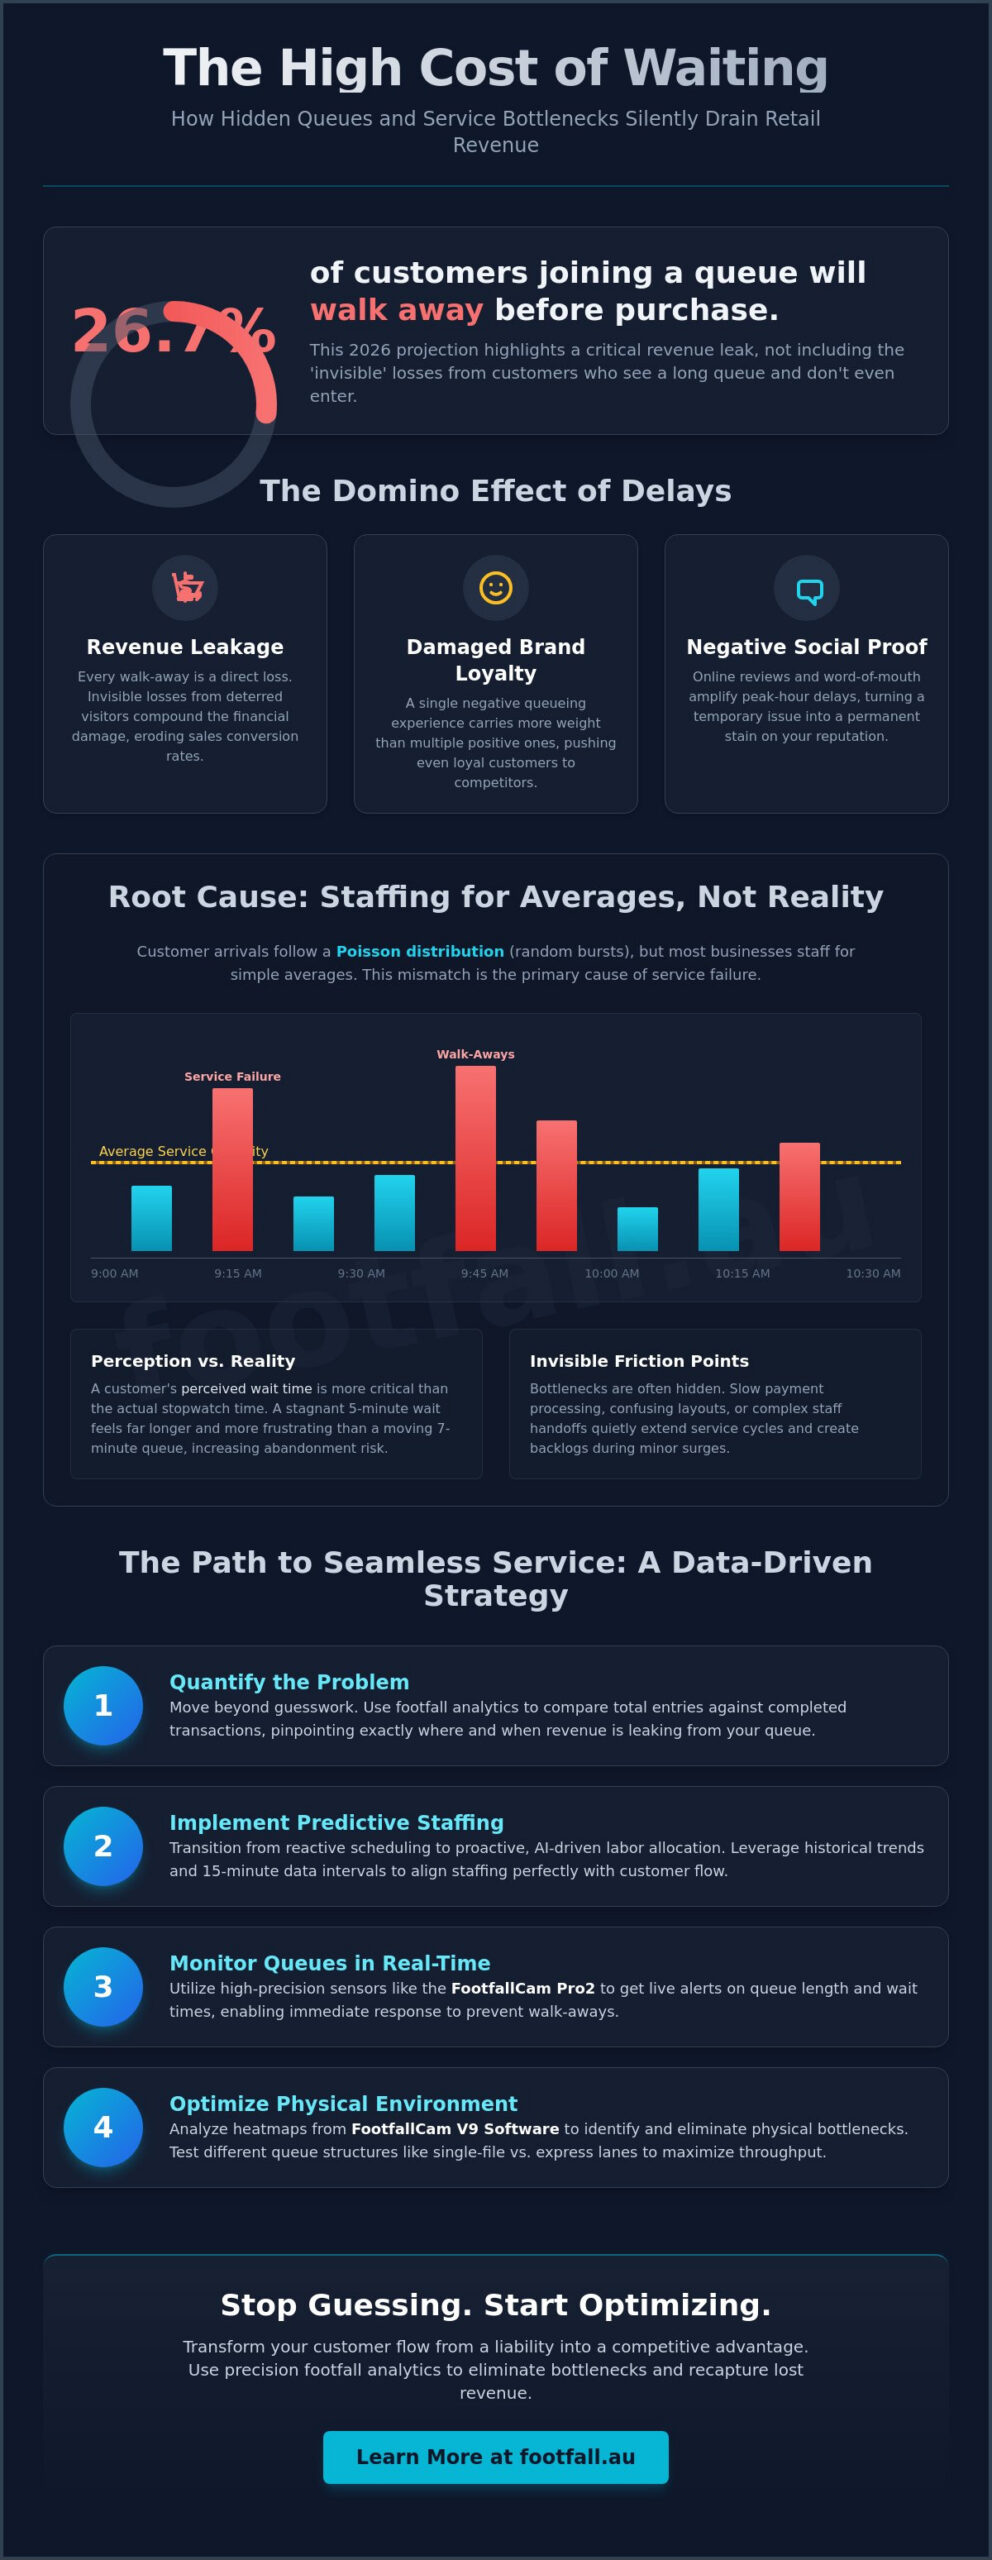
In 2026, 26.7% of customers who join a queue will walk away before completing their visit, representing a multi-billion dollar drain on global retail revenue. This suggests that learning how to reduce customer wait times is no longer a secondary operational goal; it’s a critical requirement for survival in an increasingly impatient market. You understand the frustration of watching potential revenue exit the building during unpredicted peaks, especially when staffing levels don’t align with the actual flow of people through your doors.
We’re here to help you move beyond guesswork and manage your environment with quiet confidence. This guide explores how to eliminate service bottlenecks and optimize labor costs using advanced footfall analytics and strategic staffing models. You’ll discover how the FootfallCam Pro2 and our V9 Software provide the empirical evidence needed to quantify the cost of waiting and transform human movement into a predictable, manageable wave. By the end of this article, you’ll have a clear roadmap for creating seamless experiences that foster long-term loyalty and maximize every square meter of your space.
Key Takeaways
- Quantify the financial impact of the ‘walk-away’ effect by accurately defining the gap between customer arrival and service initiation.
- Transition from reactive scheduling to predictive labor allocation by leveraging historical footfall trends and AI-driven forecasting.
- Discover how to reduce customer wait times through real-time queue monitoring and the high-precision data provided by the FootfallCam Pro2.
- Evaluate the efficiency of your physical environment by comparing single-file and express lane structures to maximize customer throughput.
- Identify and resolve invisible service bottlenecks, such as slow payment processing, using the intuitive reporting found in FootfallCam V9 Software.
The True Cost of Customer Wait Times in 2026
Wait time is the temporal gap between a customer’s arrival at your facility and the initiation of their requested service. In 2026, this metric has become a primary indicator of operational health. Many managers focus solely on the physical line, but the “walk-away” effect often happens before a customer even joins the queue. Research indicates that 26.7% of customers who join a queue do not complete their visit, yet this doesn’t account for the “invisible” losses: those who see a crowded entrance and choose not to enter at all. In high-traffic Australian environments like Pitt Street Mall or Bourke Street, negative social proof travels fast. A visible bottleneck acts as a warning sign to potential visitors, signaling that your service cannot keep pace with demand. Understanding how to reduce customer wait times starts with acknowledging that every second of delay directly erodes your sales conversion rates and average transaction values.
Quantifying Revenue Leakage from Queues
Calculating your true abandonment rate requires more than observing the checkout line; it demands a sophisticated analysis of entry and exit data. By comparing total footfall against completed transactions, businesses can pinpoint exactly where revenue is leaking. This analysis is rooted in Queueing theory, which provides the mathematical framework for understanding how arrival patterns influence wait times. When dwell times exceed a specific threshold, frustration peaks and the likelihood of a “walk-away” increases exponentially. Queue-induced churn is the immediate loss of potential revenue and long-term customer value caused by perceived or actual service delays that exceed a visitor’s psychological threshold.
The Long-Term Impact on Brand Loyalty
The damage of a long wait extends far beyond the immediate lost sale. In the digital age, a single negative experience carries significantly more weight than multiple positive ones. Online reviews often amplify peak-hour delays, turning a temporary staffing mismatch into a permanent stain on your brand’s reputation. To stay competitive, organizations must shift from a reactive “apology” culture to a proactive “efficiency” culture. Using data to understand how to reduce customer wait times allows you to protect your brand equity before a bottleneck occurs. It’s about moving from intuition-based management to a model where every staffing decision is backed by empirical evidence, ensuring that your most loyal customers aren’t pushed toward competitors by avoidable friction.
Identifying the Root Causes of Service Bottlenecks
Bottlenecks aren’t always as obvious as a long line snaking out the door. Often, they’re the result of subtle friction points within the operational flow. To understand how to reduce customer wait times, you must first distinguish between actual wait time, the stopwatch reality, and perceived wait time, the customer’s psychological experience. A customer standing in a stagnant line for five minutes feels more frustrated than one moving through a structured queue for seven. Beyond psychology, invisible delays like complex handoffs between staff or slow payment authorization can quietly extend the service cycle, turning a minor surge into a significant backlog.
Arrival Patterns vs. Service Capacity
In retail, customer arrivals rarely follow a steady, linear path; they typically follow a Poisson distribution, characterized by random, concentrated bursts. Relying on daily or even hourly averages is the primary enemy of efficiency. If you staff for an average of 40 customers per hour, but 30 of those arrive in the first 15 minutes, your service capacity will inevitably buckle. This is why granular, 15-minute data intervals are essential. By analyzing these micro-trends, you can align rosters with the actual velocity of human movement rather than broad estimations. This level of precision allows managers to anticipate surges before they manifest as physical congestion.
Physical Layout and Flow Constraints
Sometimes, the architecture of the space itself is the culprit. Narrow aisles, poorly positioned promotional displays, or confusing signage can create dead zones where customers get stuck before they even reach the point of sale. Utilizing retail footfall analysis Australia helps identify these friction points through the use of heatmaps. These visual representations of movement reveal where traffic stalls and where it flows. For example, if a high-demand product is placed too close to the queue entrance, it can cause cross-traffic that slows down both shoppers and those trying to exit. Optimizing these layouts ensures that the path to service is as direct as possible. To gain a deeper understanding of your specific site dynamics, you can explore the advanced reporting tools available through modern people counting systems as a proven strategy for how to reduce customer wait times without increasing overhead.
Predictive Staffing: Using Footfall Data to Align Labour
Managing service speed is often treated as a reactive crisis. When a line becomes visible, managers scramble to open additional service points, but by this stage, the customer’s perception of the brand has already begun to sour. True mastery of how to reduce customer wait times lies in predictive labour allocation. This approach shifts the focus from managing a queue once it exists to preventing its formation entirely. By treating footfall as a predictable wave rather than a series of random events, you can align your staff rosters with the precise velocity of incoming traffic. In the Australian market, where high labour costs demand extreme operational efficiency, this level of precision isn’t just a luxury; it’s a financial necessity.
Analysing Historical Traffic Trends
The foundation of predictive staffing is the identification of your site’s unique “power hours.” Using high-accuracy people counting systems allows you to isolate seasonal, weekly, and hourly trends with scientific clarity. You can establish a baseline for normal operations and contrast it with peak periods triggered by external factors like local weather shifts or community events. When you correlate these variables with arrival surges, you move beyond guesswork. Instead of staffing based on a hunch, you’re deploying resources based on documented human behaviour patterns. This data-driven baseline ensures you aren’t overstaffed during lulls or dangerously under-resourced during high-probability surge windows.
Dynamic Roster Management
Integrating footfall analytics with your workforce management strategy creates a culture of “Labour Effectiveness.” This metric ensures that your most expensive resource, your people, are present exactly when traffic is highest. FootfallCam V9 Software facilitates this by providing intuitive reporting that highlights the gap between staff presence and customer volume. Implementing “flex-staffing” models, where team members are cross-trained to jump into service roles during anticipated peaks, offers a high ROI by protecting sales conversion without permanently increasing overhead. Communicating these data-backed changes to your team is equally vital. When staff understand that roster adjustments are based on empirical evidence rather than arbitrary decisions, it builds buy-in and fosters a more resilient, efficiency-focused work environment. This strategic alignment is the most direct path for any business looking at how to reduce customer wait times while maintaining a lean operational profile.
Optimising the Physical Environment for Faster Throughput
Physical space is a powerful, often underutilised tool for managing customer flow. While staffing levels determine service capacity, the layout of your environment dictates how efficiently that capacity is used. Transitioning from multiple parallel lines to a single-file, serpentine queue structure is a proven strategy for how to reduce customer wait times. This configuration ensures a “First-In, First-Out” flow, which eliminates the anxiety of “queue jumping” and enhances the perception of fairness. Beyond the main line, designating express lanes based on transaction complexity rather than just item count allows your team to clear high-velocity tasks, such as simple pickups or card-only payments, without being stalled by time-intensive consultations.
Transparency acts as a psychological buffer during peak periods. Integrating digital signage that displays real-time wait estimates can reduce a customer’s perceived wait time by approximately 35%. When visitors know exactly how long they will be standing in line, their abandonment threshold extends. For simple transactions, introducing self-service kiosks or mobile checkout options offloads pressure from the main counter, allowing your staff to focus on high-value interactions that require a human touch.
The Psychology of the ‘Active’ Wait
Unoccupied time feels significantly longer than occupied time. For Australian shoppers, the frustration of waiting is often tied to a lack of engagement. Strategic placement of impulse-buy zones or informative displays within the queue keeps customers mentally active, effectively shortening the perceived duration of the wait. High-precision people counting technology plays a vital role here by monitoring queue density in real-time. When a specific threshold is reached, the system can trigger “all hands on deck” alerts to store managers, ensuring that additional service points are opened before the physical line becomes a deterrent to new arrivals.
Triage and Advanced Queue Management
Implementing a triage system at the entrance of the service zone can drastically improve throughput. A “Floor Lead” or greeter can pre-sort customers by their specific needs, directing “Quick Wins” like returns or pre-paid pickups to dedicated stations. This prevents “Deep Consultations” from clogging the main flow. In high-dwell environments like service centres, virtual queuing allows customers to join a digital line via a QR code, freeing them to browse the space until their turn is called. To see how these layout strategies can be customised for your specific footprint, you can explore our site survey and planning services to identify the optimal configuration for your facility.
Leveraging FootfallCam Pro2 for Real-Time Queue Analytics
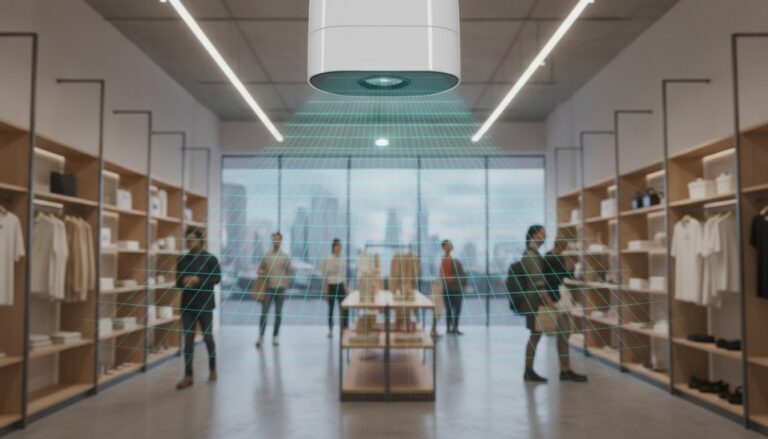
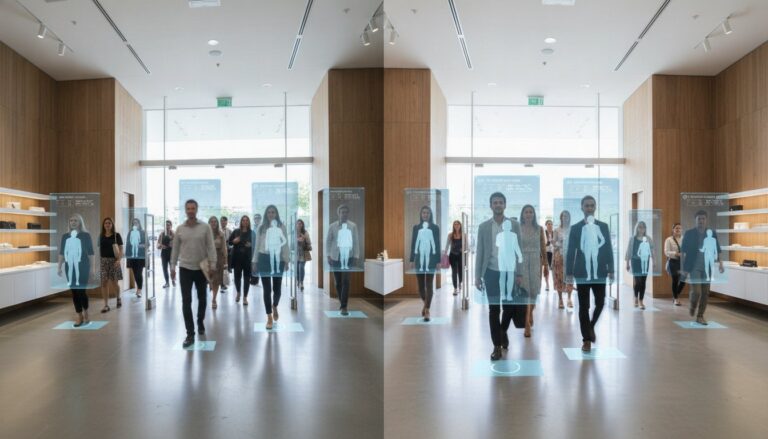
Data accuracy is the foundation of any strategy aimed at how to reduce customer wait times. The FootfallCam Pro2 has emerged as the industry standard for this task because it moves beyond simple counting. Its AI-powered sensors use advanced skeletal tracking to distinguish between staff members and customers. This ensures your queue metrics aren’t inflated by employees restocking shelves or floor leads managing the line. Clean data leads to clear decisions. By providing a purified dataset, the Pro2 allows you to make operational adjustments with absolute confidence in the empirical evidence.
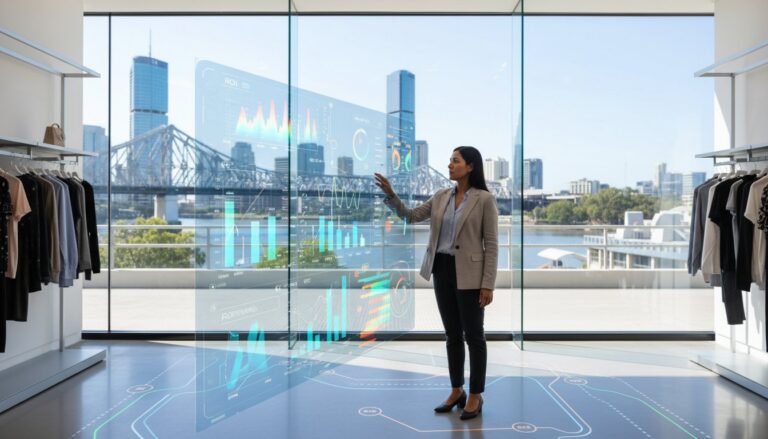
It’s not just about seeing the queue; it’s about reacting to it instantly. For national multi-site operations, the integrated reporting within FootfallCam V9 Software provides a bird’s-eye view of organizational performance. You can compare the efficiency of a flagship store in Sydney with a regional outlet in Perth, identifying exactly where bottlenecks persist and where service models are excelling. This centralized visibility empowers executive teams to standardize service levels across the entire brand footprint without relying on anecdotal reports from the field.
Automated Real-Time Alerts
Managers can’t be everywhere at once. Automated real-time alerts bridge this gap by sending notifications via SMS or app when wait time thresholds are breached. If a queue exceeds a pre-defined length, the system triggers an immediate alert. This allows a floor manager to open an additional register or reassign a staff member before the situation escalates. Beyond speed, these live occupancy dashboards help maintain safety standards by preventing overcrowding in high-traffic zones. It’s a proactive way to handle how to reduce customer wait times without needing a constant physical presence at every service point.
Continuous Improvement through Data Loops
Long-term success requires a consistent feedback loop. Using footfall data analysis allows you to audit the effectiveness of the layout changes and staffing models implemented in your facility. You can measure the direct impact of an express lane or a new roster on your average service speed. This level of scrutiny helps identify “Best Practice” locations within your network, creating a template for success that can be scaled across the organization. Accuracy matters. The FootfallCam Pro2 turns physical movement into strategic growth by providing the technical foundation needed to evolve your service model in real time.
Mastering the Future of Frictionless Service
Eliminating queues requires a shift from reactive management to a model defined by predictive precision. By aligning labor rosters with historical arrival patterns and optimizing your physical layout for maximum throughput, you transform waiting from a service failure into a manageable operational variable. These data-driven strategies are the most effective way to understand how to reduce customer wait times while protecting your bottom line from unnecessary labor costs. Decisions backed by empirical evidence ensure that your facility remains efficient even during unpredicted surges.
To implement these insights, you need a technical foundation built on accuracy and reliability. Trusted by leading Australian retailers, our systems deliver 99.5% counting accuracy through advanced AI sensors. You can gain access to real-time queue monitoring and automated alerts that empower your floor managers to act before bottlenecks manifest. It’s time to replace intuition with the quiet confidence of verified data. Optimise your service efficiency with a FootfallCam Pro2 solution and build a seamless environment that prioritizes your customers’ time.
Frequently Asked Questions
What is the biggest cause of long customer wait times?
The primary cause is a mismatch between customer arrival velocity and available service capacity. This imbalance usually occurs because businesses staff based on hourly averages rather than granular, 15-minute peaks. When arrivals follow a random distribution, a sudden surge can quickly overwhelm a static roster. This creates a backlog that takes significant time to clear, even after the initial wave of traffic has subsided.
How do I calculate the average wait time for my customers?
You calculate the average wait time by measuring the duration between a customer joining a defined queue zone and the initiation of their service. Using FootfallCam V9 Software, you can automate this process by tracking dwell times within specific digital polygons. This provides a much more accurate metric than manual observation, allowing you to quantify the exact gap between demand and fulfillment throughout the day.
Can people counting sensors really measure queue length accurately?
Yes, modern AI-powered sensors like the FootfallCam Pro2 use skeletal tracking to identify human presence within a defined area with high precision. These systems are programmed to ignore static objects or staff members, focusing exclusively on customer movement. This level of accuracy ensures that your queue length data is a reliable reflection of reality rather than a rough estimate based on general motion or heat.
What is an acceptable wait time for retail customers in Australia?
In 2026, research indicates that the average tolerated wait time for retail customers has dropped to between 5 and 7 minutes. Beyond this threshold, abandonment rates tend to increase significantly. For Australian businesses, maintaining service speed within this specific window is critical for protecting conversion rates, as modern shoppers have become much more sensitive to perceived delays compared to previous years.
How does predictive staffing differ from traditional scheduling?
Predictive staffing uses historical footfall data and AI-driven forecasting to anticipate surges before they occur, while traditional scheduling relies on static shifts. By understanding how to reduce customer wait times through data, you can align your labor resources with the actual velocity of human movement. This shift moves your team from a reactive crisis mode to a proactive, efficiency-focused operational model that prioritizes the customer experience.
Do I need to hire more staff to reduce wait times?
Not necessarily, as the solution often lies in the strategic reallocation of existing resources rather than increasing headcount. By identifying your site’s “power hours” through footfall analytics, you can move staff from low-traffic periods to high-demand windows. This optimization ensures you have the necessary service capacity when it matters most without inflating your overall labor budget or decreasing your operational profit margins.
How can I reduce wait times without spending more on labour?
You can achieve this by optimizing your physical layout and implementing triage systems. Separating quick transactions from complex consultations and using express lanes can significantly improve throughput. Additionally, introducing self-service kiosks or mobile checkout options allows you to offload simple tasks. These are practical ways to manage how to reduce customer wait times without increasing your total number of rostered hours.
Is it better to have one single queue or multiple lines?
A single-file, serpentine queue is generally superior because it ensures a “First-In, First-Out” flow and enhances the perception of fairness. Multiple lines often lead to the frustration of choosing the “slow” lane or witnessing others jump ahead. A single-line structure reduces the psychological stress of waiting, which is just as important for customer loyalty as reducing the actual time spent in line.