2026 Strategic Guide: Australian Office Space Metrics
With the national CBD office vacancy rate reaching 15.3% in 2026, many Australian organisations are currently paying for premium square metres that serve no one. You’ve likely felt the frustration of walking through a silent floor on a Friday or searching for a meeting room that’s “booked” but remains entirely empty. It’s difficult to justify a lease renewal or a major redesign when your decisions rely on intuition rather than empirical evidence. This guide provides the analytical framework you need to master office space utilisation metrics and right-size your real estate for a modern hybrid workforce. We’ll examine the essential data points and high-accuracy tools like the FootfallCam Pro2 that transform human movement into a clear strategic advantage. You’ll gain the clarity required to optimise your environment, eliminate wasted budget, and improve the daily experience for your entire team.
Key Takeaways
- Define the “Big Three” data points of Occupancy, Utilisation, and Density to transition from static headcounts to dynamic presence analytics.
- Calculate your Peak-to-Average ratio to identify exactly how much “just-in-case” real estate is being wasted during hybrid work cycles.
- Master the essential office space utilisation metrics required to justify lease renewals and office redesigns with high-fidelity, empirical evidence.
- Compare AI-driven video sensors against legacy systems to ensure your strategic decisions are built on 99.5% accurate occupancy data.
Decoding the Core Office Space Utilisation Metrics for 2026
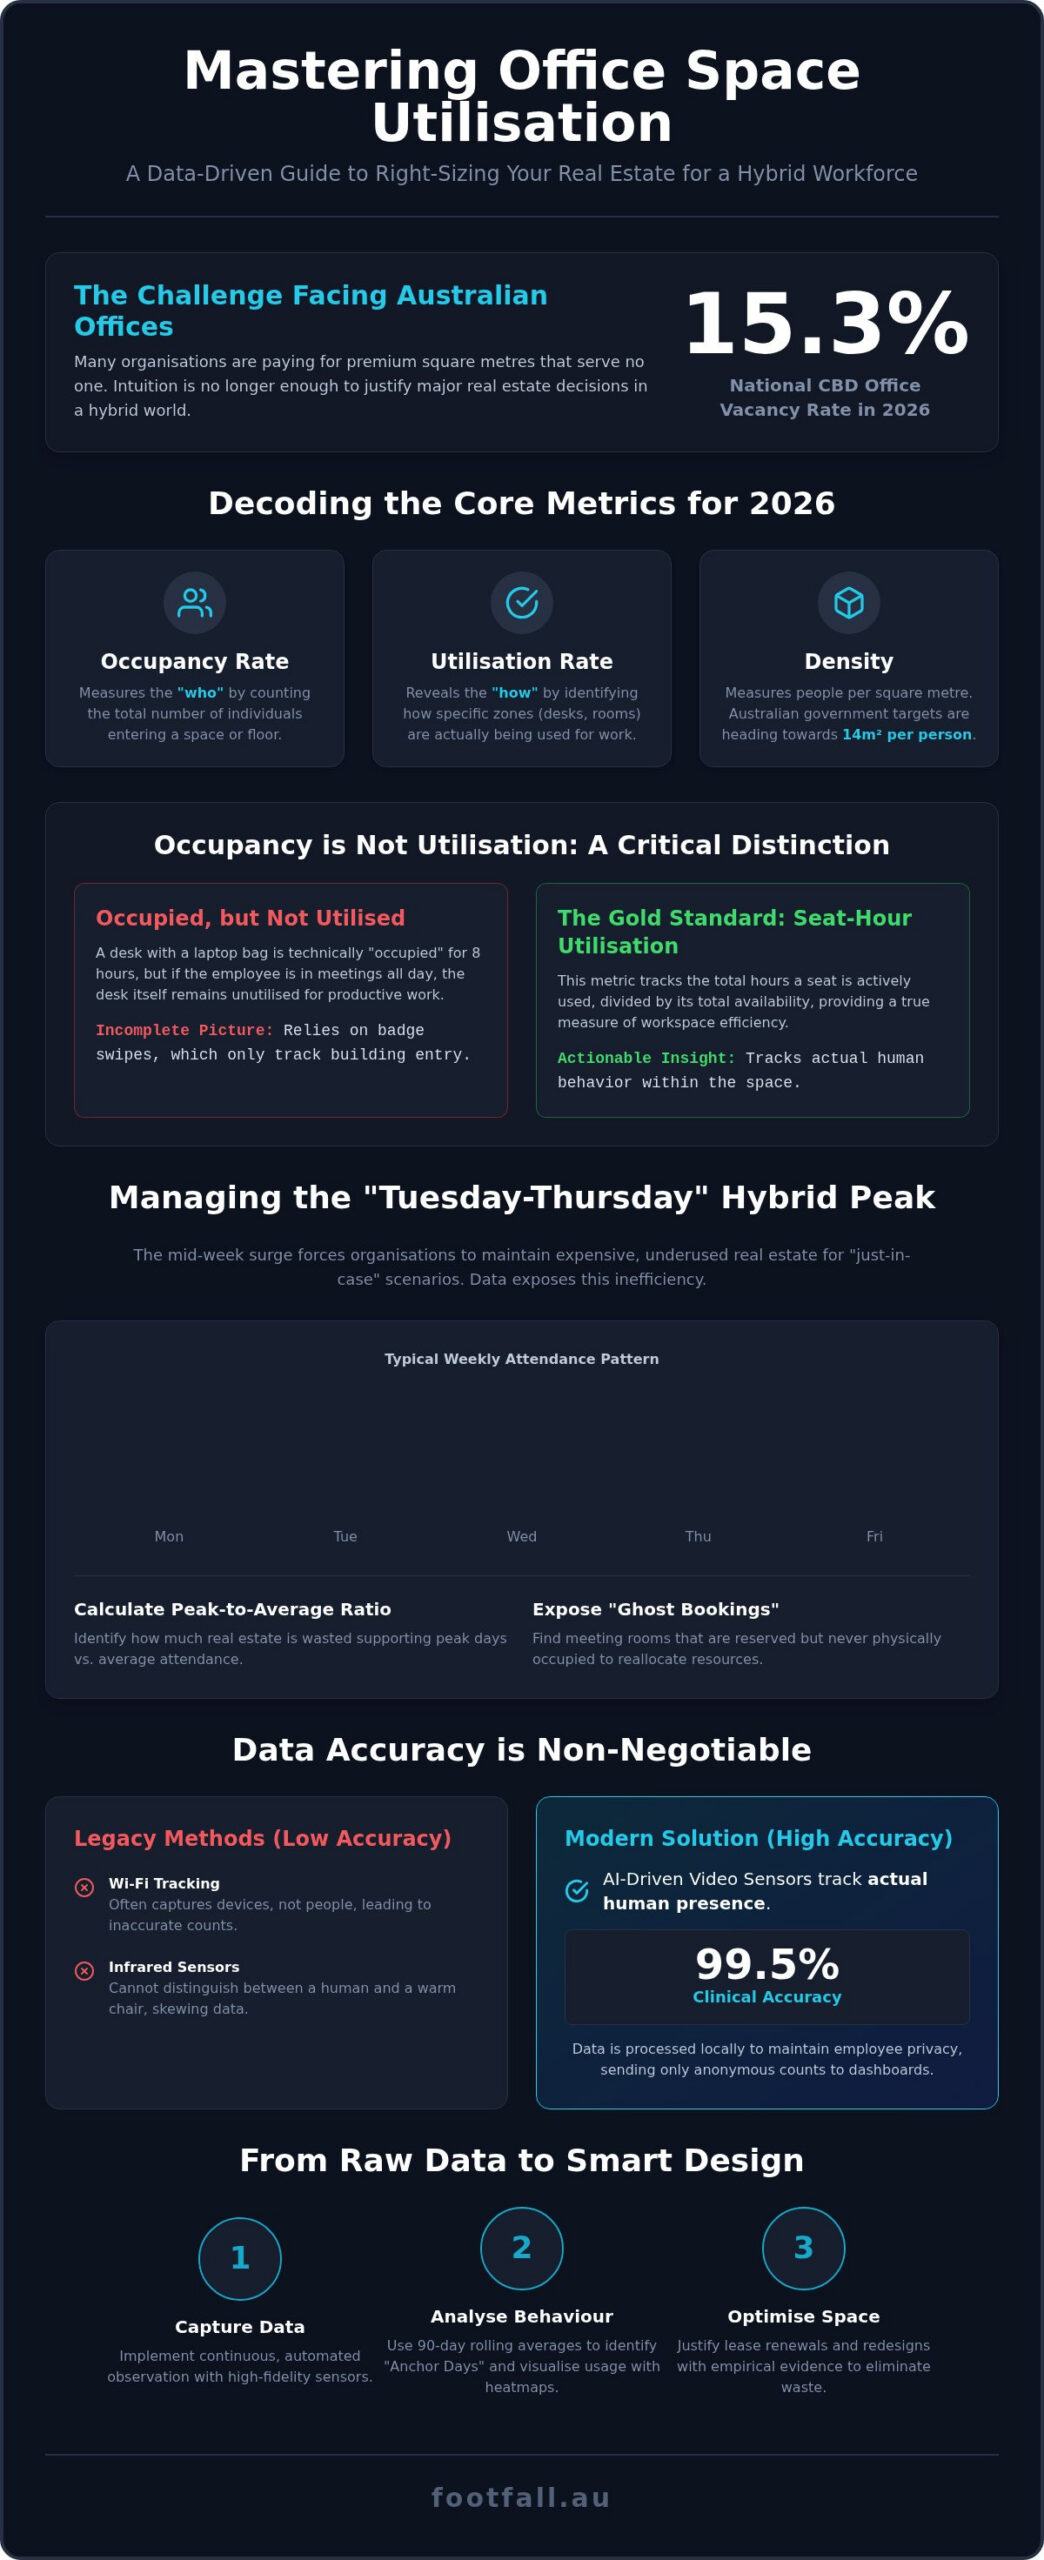
The traditional reliance on static headcount has become a liability for Australian organisations. In 2026, the shift toward dynamic presence analytics is no longer optional; it’s a prerequisite for effective lease negotiations. To right-size your environment, you must master the “Big Three” office space utilisation metrics: Occupancy Rate, Utilisation Rate, and Density. While occupancy tracks the total number of people entering a floor, utilisation reveals how specific zones are actually functioning. This distinction is vital for interpreting the narrative of movement, where a desk can be technically occupied but not utilised for productive work.
Occupancy vs. Utilisation: Understanding the Behavioral Difference
Occupancy measures the “who” by counting individuals entering the building, whereas utilisation measures the “how” by identifying active zones. Badge swipes provide an incomplete picture because they fail to capture internal space performance. A desk might be occupied by a laptop bag for eight hours but remain unutilised for work while the employee spends their day in collaborative spaces. Seat-Hour Utilisation is the gold standard for hybrid office efficiency, representing the total hours a seat is actively used divided by its total availability. To capture these behavioral nuances, sophisticated firms integrate advanced analytics and RTLS to monitor real-time density. With the Australian government targeting a 14m² density threshold, having empirical evidence of how people flow through your space is the only way to avoid paying for expensive, empty desks on Mondays and Fridays. Using office space utilisation metrics allows you to move beyond intuition and make decisions that reflect actual human behavior.
Managing the Hybrid Peak: Strategic Metrics for Dynamic Environments
The “Tuesday-to-Thursday peak” remains the most significant hurdle for Australian facility managers. While Friday vacancies often hover near record highs, the mid-week surge frequently forces organisations to maintain expensive, underused floor space. You’ll find that calculating the Peak-to-Average ratio is essential to determine if you’re paying for “just-in-case” real estate. This is one of the core office space utilization metrics that helps reconcile the 15.3% national vacancy rate with the reality of crowded mid-week hubs.
Beyond desks, meeting room efficiency metrics expose “ghost bookings” where spaces are reserved but never physically occupied. Identifying these gaps allows for immediate resource reallocation and improved employee access. Setting a Mobility Ratio, the number of employees assigned per desk, requires similar precision. A ratio that’s too aggressive causes morning shortages, while one that’s too conservative wastes capital. Organisations must move from anecdotal evidence to office space utilisation metrics derived from actual human behavior. Data doesn’t lie.
Calculating Peak Space Utilisation for Effective Right-Sizing
Identifying your “Anchor Days” begins with isolating the three consecutive days of highest attendance across a full quarter. Don’t react to temporary spikes. Use 90-day rolling averages instead to predict future requirements with confidence. This longitudinal approach ensures your lease decisions account for broader behavioral shifts. For a deeper dive into interpreting these patterns, consult our Footfall Data Analysis: A Strategic Guide to Actionable Insights. Transitioning to this evidence-based model ensures your office space utilisation metrics lead to measurable operational savings. If you’re ready to see how your floorplan performs in real-time, consider how automated occupancy tracking can simplify your reporting.
From Raw Data to Smart Design: Implementing Advanced Analytics
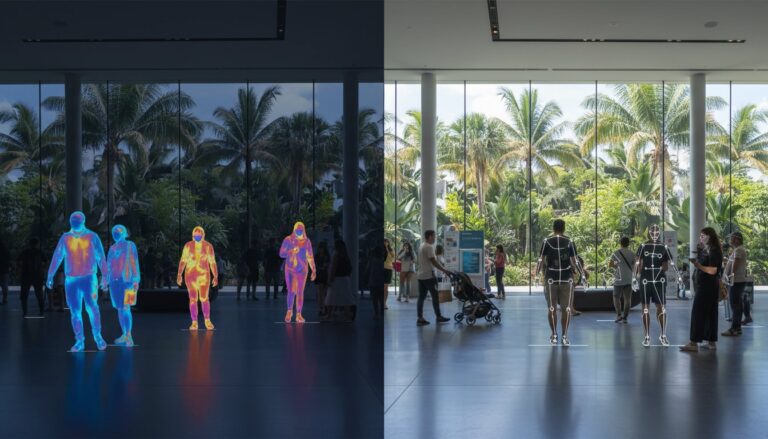
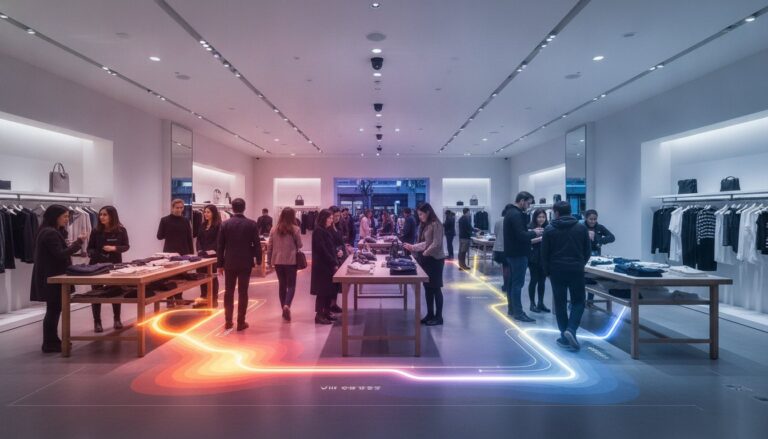
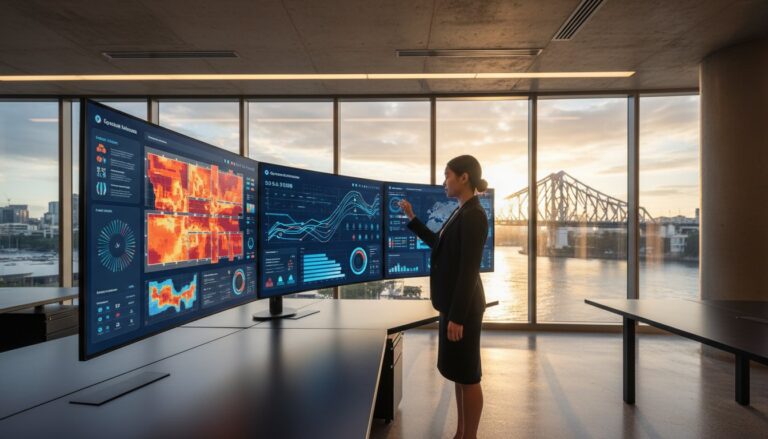
Capturing high-fidelity data across a national portfolio requires a shift from sporadic audits to continuous, automated observation. While many organisations rely on Wi-Fi tracking or basic infrared sensors, these methods often lack the granularity needed for precise office space utilisation metrics. Wi-Fi often captures devices rather than people, while infrared cannot distinguish between a human and a warm chair. Transitioning to AI-driven video sensors like the FootfallCam Pro2 ensures you’re tracking actual human presence with clinical accuracy. These systems process data locally to maintain employee privacy, transmitting only anonymous counts to your dashboard. Centralising this information through the FootfallCam V9 Software allows you to turn raw counts into visual heatmaps, revealing exactly how different departments interact with your floorplan.
Leveraging AI People Counting for High-Precision Insights
Modern AI sensors use sophisticated edge computing to distinguish between humans and inanimate objects like bags or furniture. This capability is what allows for 99.5% accuracy, even in high-density environments. For Australian businesses still using outdated technology, the Legacy Swap Out Plan offers a streamlined path to modernising your infrastructure. When selecting hardware, use this integration checklist:
- Verify 99.5% accuracy in varied lighting conditions.
- Ensure native API compatibility with your existing IWMS.
- Confirm local data processing for GDPR and privacy compliance.
- Check for real-time reporting capabilities via centralised software.
Implementing these systems provides the empirical foundation necessary to refine your office space utilisation metrics and justify long-term real estate investments. By moving away from intuition, you create a workplace that is both efficient and responsive to the actual needs of your workforce.
Securing the Future of the Evidence-Based Workplace
Mastering office space utilisation metrics is the definitive step toward eliminating real estate waste and improving the daily employee experience. You now have the framework to distinguish between simple occupancy and deep utilisation, allowing you to manage hybrid peaks with clinical precision. By replacing intuition with empirical data, you can justify every square metre of your national portfolio and ensure your environment supports actual human behavior. Footfall Australia has helped organisations move toward this data-driven future since 2004. Our AI-driven hardware delivers 99.5% accuracy, while the comprehensive V9 analytics suite provides the visual heatmaps necessary for strategic growth. Don’t leave your next lease renewal to chance when you can rely on proven technical solutions. Optimise your workplace with the FootfallCam Pro2; contact Footfall Australia today. You’re now equipped to lead your organisation into a more efficient and responsive era of office management.
Frequently Asked Questions
What is a good office space utilisation rate for hybrid work in 2026?
A sustainable average utilisation rate for Australian hybrid offices in 2026 typically falls between 40% and 60%. While the national CBD office vacancy rate sits at 15.3%, leading organisations focus on managing the Tuesday-to-Thursday mountain. You should aim for peak occupancy that doesn’t exceed 85% to ensure employees find collaborative spaces. Consistently low rates below 30% indicate significant opportunities for real estate consolidation.
How do occupancy sensors differ from standard CCTV for measuring space?
Occupancy sensors like the FootfallCam Pro2 are purpose-built for data precision rather than visual surveillance. Standard CCTV requires manual counting or basic software that often misinterprets shadows as people. AI-driven sensors provide 99.5% accuracy by distinguishing between humans and objects. These sensors integrate directly with the V9 analytics suite to automate reporting, providing real-time density data that security cameras can’t deliver.
Can I measure office density without invading employee privacy?
You can maintain total employee privacy by using sensors that process data at the edge. It’s a privacy-first approach where the FootfallCam Pro2 analyzes movement locally and transmits only anonymous numerical counts to the cloud. No identifiable facial data or video streams are stored. This allows you to gather deep insights into office space utilisation metrics while remaining compliant with privacy regulations and maintaining organisational trust.
How often should I review my office space utilisation metrics?
Operational teams should review real-time density data weekly to manage immediate facilities needs like cleaning and HVAC. However, strategic reviews of your office space utilisation metrics should occur quarterly using 90-day rolling averages. This timeframe filters out temporary fluctuations and provides the empirical evidence needed for lease negotiations. Consistent monitoring ensures your strategy remains responsive to evolving hybrid attendance trends across the Australian market.