Maximising Space Utilisation for Better Efficiency
Is your office actually working as hard as you are? Recent data from June 2026 reveals that enterprise office utilization rates often hover between 35% and 50%, leaving a staggering 20% to 40% of real estate budgets wasted on underused square meterage. For many Australian businesses, high commercial lease costs make this inefficiency a significant financial burden. You’ve likely noticed the disconnect between a fully booked meeting room on the digital calendar and the reality of a vacant space, making it difficult to optimize your Space Utilisation effectively.
We understand the frustration of managing maintenance schedules and portfolio sizes when you lack visibility into actual human behavior. This article will show you how to master the art of space management by replacing intuition with evidence-based insights to reduce overheads and enhance operational efficiency. You’ll learn to refine cleaning operations and gain the data needed to make confident decisions about downsizing or expansion. We’ll explore how interpreting the narrative of movement allows you to align your physical assets with the way your people actually work.
Key Takeaways
- Understand why modern Australian workplaces are moving from assigned seating to activity-based environments to better align with actual human behavior.
- Identify critical crunch points in your facility by analyzing peak occupancy and frequency of use metrics rather than relying on anecdotal evidence.
- Compare the limitations of traditional manual audits with the 24/7 reliability of AI-driven sensors to ensure your data is accurate and actionable.
- Master the art of Space Utilisation to pinpoint surplus areas, allowing you to reduce lease, energy, and maintenance costs without impacting productivity.
- Discover how the FootfallCam Pro2 and V9 Software transform complex movement patterns into intuitive heat maps and evidence-based reporting.
What is Space Utilisation and Why Does it Matter in 2026?
Space Utilisation is the ratio of actual usage against total capacity over a specific timeframe. In 2026, this metric has become the primary indicator of organizational health and fiscal responsibility. Within major Australian business hubs, the financial impact of underutilised commercial real estate is significant. High lease costs in Sydney, Melbourne, and Brisbane mean that every empty desk or vacant meeting room represents a direct hit to the bottom line. Consequently, the Australian market is seeing a rapid shift from rigid assigned seating to flexible, activity-based environments. This transition introduces the concept of Space Productivity. Instead of just looking at square meterage, leaders now measure the value generated per square metre. It’s a move toward empirical evidence that ensures physical assets are working as hard as the people within them.
The Difference Between Occupancy and Utilisation
Occupancy and utilisation are often used interchangeably, but they represent entirely different layers of truth. Occupancy is a binary measurement. It tells you if a person is present in a space at a single moment. It’s a snapshot that answers whether a room is currently taken. Utilisation is a longitudinal study of how frequently and effectively a space is used over time. It answers how well that room is being used throughout the week. Mistaking occupancy for utilisation often leads to poor real estate decisions, such as expanding an office because desks look full at peak hours, even if they remain empty for the rest of the day. By conducting a Post-Occupancy Evaluation (POE), businesses can use quantitative metrics to understand occupational density. This data-driven approach prevents the common mistake of over-investing in space that only reaches peak capacity for a few hours a week.
The Narrative of Movement in Physical Spaces
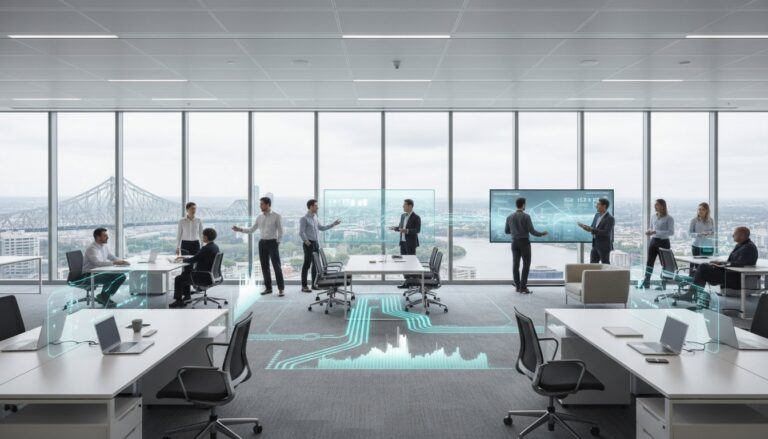
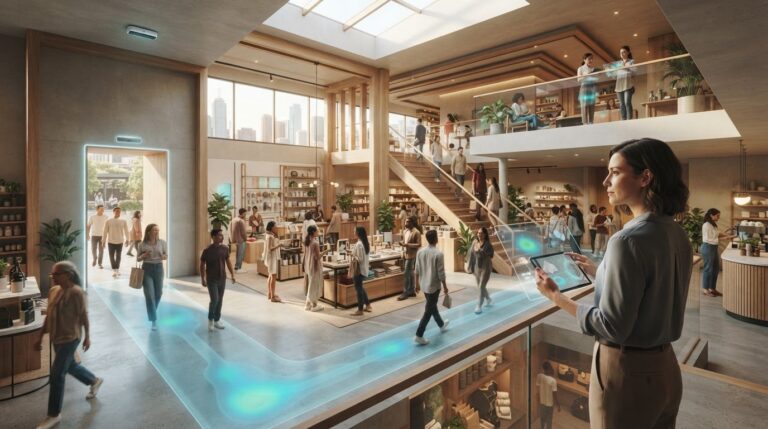
True efficiency requires looking beyond static numbers. We view physical presence as a sequence of human actions, a concept we call the narrative of movement. This approach treats your office or facility as a living environment where every step tells a story. Understanding the “why” behind movement involves analyzing dwell times, pathing, and zone popularity. If data shows high dwell times in a breakout area but low frequency in formal meeting rooms, your employees are signaling a preference for informal collaboration. This narrative informs better architectural and operational design. It allows you to stop guessing and start configuring your environment based on actual human behavior. When you interpret movement as a sequence of actions, you can create spaces that naturally support the way people want to interact and work. This level of insight is what transforms a standard office into a high-performance environment.
Key Metrics for Accurate Space Utilisation Analysis
Measuring the narrative of movement requires a shift from anecdotal observation to empirical metrics. To master Space Utilisation, you must first identify the specific data points that reveal how your environment actually functions. These metrics provide the foundation for strategic decisions, moving beyond simple headcounts to a nuanced understanding of spatial efficiency. When you track these variables, you transform a physical floor plan into a strategic asset.
- Peak Occupancy: This identifies the ‘crunch points’ where your space becomes a constraint. Research indicates that peak utilisation on busy days typically reaches 85% to 90%. This is when employees feel the office is “full” despite lower average rates throughout the rest of the week.
- Frequency of Use: This tracks how often a specific room or zone is accessed during a standard business week. It highlights whether a high-cost asset like a boardroom is a vital hub or an expensive, rarely touched relic that could be repurposed.
- Duration of Stay (Dwell Time): Measuring the depth of engagement within a specific area tells you if a space is truly functional. Long dwell times in collaborative zones suggest high utility, whereas short stays in designated focus areas might indicate poor acoustic design or discomfort.
- Turnover Rate: This metric reveals how quickly spaces are vacated and re-occupied. High turnover in hot-desking areas suggests a dynamic, high-demand environment, while low turnover might signal “desk hogging” that limits access for other team members.
Density and Flow Metrics
Efficiency isn’t just about presence; it’s about the quality of movement. Calculating people per square metre ensures your facility meets safety and comfort standards while preventing overcrowding. By analysing flow patterns, you can identify physical bottlenecks in lobbies or hallways that frustrate users. Modern systems use this density data to trigger automated HVAC or lighting adjustments, ensuring energy is only consumed where people are actually present. To begin capturing these insights, you can explore the latest in automated occupancy monitoring solutions.
Capacity vs. Demand Ratios
The most significant drain on resources often comes from ‘ghost spaces’. These are areas that are booked in a system but never actually used. Current benchmarks show that no-show rates in hybrid offices can reach 25% to 30%, creating a false sense of demand. Comparing peak demand against your total footprint allows you to determine downsizing potential or the need for reconfiguration. The ‘Utilisation Gap’ is the difference between perceived and actual space needs. Closing this gap is essential for reducing the 20% to 40% of real estate budgets typically lost to underused square meterage.
Manual Surveys vs. Automated AI People Counting
Manual surveys have long been the standard for assessing workplace efficiency. These audits typically involve a person walking through a facility with a clipboard or tablet, recording occupancy at set intervals. While this method provides a baseline, it’s essentially a collection of snapshots that miss the erratic usage patterns common in 2026. Automated AI people counting, however, offers a continuous 24/7 stream of data. This shift from intermittent observation to constant monitoring is fundamental for mastering Space Utilisation.
The cost-effectiveness of these methods differs significantly. Manual surveys require recurring labour costs every time you need a new data set. In contrast, a one-time investment in hardware like the FootfallCam Pro2 People Counters eliminates the need for ongoing audit fees. These AI sensors achieve up to 99.5% accuracy, providing a level of precision that manual counting simply can’t match. This high-fidelity data allows for agile workplace management, where decisions are made based on what’s happening right now rather than what was observed three months ago.
Overcoming the Limitations of Manual Audits
Traditional audits are often compromised by the “observer effect.” This happens when employees change their behaviour because they know they’re being watched, leading to skewed data that doesn’t reflect typical daily routines. AI sensors remove human bias and the risk of simple counting errors. Instead of waiting weeks for a retrospective report, managers can use FootfallCam V9 Software to set proactive, real-time alerts. This allows for immediate operational adjustments, such as opening additional zones or redirecting cleaning staff. To understand the underlying mechanics, you can read about the technology behind people counting.
Privacy and Ethics in Automated Tracking
Privacy is a critical concern for Australian businesses. Many organisations hesitate to use standard CCTV for occupancy tracking due to ethical and legal risks. AI-based people counters solve this by using anonymous data processing. Unlike video surveillance, these sensors don’t record identifiable features or personal information. They process movement at the “edge,” meaning the analysis happens on the device itself rather than in the cloud. This ensures compliance with GDPR and local Australian privacy standards while keeping sensitive data secure. By focusing on the narrative of movement rather than the identity of the individual, you can optimise your environment without compromising trust.

Strategic Benefits: Turning Data into Operational Excellence
Actionable data transforms real estate from a passive cost into a strategic asset. When you apply empirical evidence to your Space Utilisation, the first result is a measurable reduction in overheads. Organizations using AI-powered platforms have documented reductions in real estate spend exceeding 40%. With 55% of organizations downsizing their portfolios recently, the ability to identify surplus space is no longer a luxury. It’s a necessity for survival in the Australian commercial market.
Efficiency extends beyond the lease. Aligning cleaning and security schedules with actual traffic peaks prevents wasted labour. Instead of cleaning every room daily, teams focus on high-traffic zones identified by movement data. This targeted approach ensures maintenance resources are deployed where they’re needed most. It also helps in future-proofing your assets. By analyzing historical trends, you can predict future real estate requirements with AI forecasting accuracy of up to 97%, allowing for proactive expansion or consolidation.
Optimising Retail and Public Venues
In the retail sector, Space Utilisation is more than a metric; it’s the difference between a thriving store and a stagnant one. By interpreting the narrative of movement to identify ‘hot zones’ where customers linger and ‘cold zones’ that are consistently neglected, you can refine your layout to maximize exposure to high-margin products. This data also provides leverage during lease negotiations. You can justify rent based on actual visitor volume and dwell times rather than unreliable street traffic estimates. For a deeper look at these strategies, see our guide on Strategic retail footfall analysis.
Enhancing the Smart Office Environment
Creating a workplace people actually want to visit is a challenge. Globally, only 38% of employees believe their company provides a good workplace. Data-driven design bridges this gap by converting underused quiet zones into social hubs or collaborative spaces that reflect actual employee preferences. For hybrid offices, supporting ‘hot-desking’ with real-time availability dashboards reduces the friction of finding a workspace. This optimization helps reach the benchmark hybrid desk utilization rate of 60% to 75%. You’ll also significantly reduce your carbon footprint. By integrating occupancy data with building management systems, you’ll ensure HVAC and lighting only operate in occupied zones, cutting energy waste in the 50% to 60% of office space that remains vacant on any given day.
Ready to turn your spatial data into a competitive advantage? Contact our specialists today to start your optimization journey.
Optimising Your Space with Footfall Australia
Achieving a high-performance environment requires more than just an understanding of metrics; it demands the right technological infrastructure. The FootfallCam Pro2 People Counters serve as the primary tool for precise Space Utilisation analysis. These sensors provide the empirical foundation needed to move away from intuition-based management. For organisations with existing infrastructure, the FootfallCam Centroid offers a powerful alternative. It repurposes existing CCTV cameras into a sophisticated space utilisation engine, allowing for rapid deployment across large portfolios without the need for extensive new hardware installation.
Data is only as valuable as the actions it inspires. The FootfallCam V9 Software serves as the analytical core of this system, converting raw movement data into intuitive 3D heat maps and reporting. This software allows you to visualise the narrative of movement within your building, identifying which zones are thriving and which require reconfiguration. To ensure long-term data integrity, we offer professional support and national Australian maintenance plans, providing the technical stability required for consistent, high-stakes real estate decisions.
Integrating Hardware and Analytics
The transition from raw data to actionable business intelligence happens within the V9 dashboard. This platform provides a seamless interface where complex movement patterns are distilled into clear, functional insights. When choosing the right people counting system, it’s essential to consider how that data will be consumed by different stakeholders. Our reporting is fully customisable, allowing facilities managers to track cleaning triggers while HR and C-suite executives focus on long-term occupational density and portfolio strategy. This ensures every department has the specific utility of information required to drive operational change.
The Footfall Australia Partnership
Success in space optimisation is built on a foundation of experience and reliability. We leverage over two decades of expertise in the Australian market to guide our partners through shifting behavioural trends. If your current system is failing to provide the accuracy required for modern workplace strategy, our Legacy Swap Out Plan offers a structured path to modernise outdated counting systems. We act as an objective partner, ensuring your physical assets are aligned with the actual needs of your workforce. Contact our strategic consultants to audit your space utilisation today and begin the transition toward a data-driven physical environment.
Aligning Your Physical Assets with Future Behavioral Trends
The transition toward flexible, activity-based environments requires a move away from static observations. By replacing manual audits with automated sensors, you gain a continuous stream of actionable intelligence that reflects how your environment is actually used. Mastering Space Utilisation isn’t just a cost-saving measure; it’s a strategic alignment of your physical footprint with human behavior. This data empowers you to eliminate “ghost spaces,” reduce energy waste, and foster a workplace that truly supports collaboration.
We’ve supported Australian businesses since 2004, providing the empirical evidence needed for high-stakes real estate decisions. Our FootfallCam Pro2 People Counters deliver 99.5% counting accuracy, feeding directly into the comprehensive FootfallCam V9 software suite for intuitive reporting and 3D heat mapping. This combination of high-quality hardware and sophisticated analytics ensures your decisions are always backed by stable, long-term data integrity.
Maximise your facility’s potential with Footfall Australia’s analytics solutions. Your physical space is one of your most significant investments. Let’s ensure it delivers the maximum possible value for your organization.
Frequently Asked Questions
What is a good space utilisation rate for a modern office?
A target space utilisation rate for a modern, hybrid-optimized office typically falls between 60% and 75% for desks and 50% to 65% for meeting rooms. While 100% usage might seem efficient, it often leads to a poor employee experience due to a lack of available workstations during peak periods. Aiming for this range ensures that your real estate is active without reaching the 85% to 90% “crunch points” that cause operational friction.
How do people counters differ from motion sensors for space tracking?
People counters provide bidirectional, high-accuracy data on the number of individuals entering or exiting a zone, whereas motion sensors only detect presence without quantifying it. Motion sensors often fail to differentiate between one person or ten, making them unsuitable for density analysis. AI-driven counters like the FootfallCam Pro2 offer 99.5% accuracy, allowing for precise occupancy tracking that motion-based PIR sensors simply cannot replicate for complex spatial planning.
Can space utilisation data help reduce my commercial electricity bill?
Yes, space data allows you to automate building systems so you only condition and light zones that are currently occupied. By integrating occupancy metrics with your HVAC and lighting controls, you can significantly reduce the carbon footprint and energy costs of your facility. This prevents the common waste of cooling or heating the 50% to 60% of office space that remains vacant on any given business day.
Is it possible to track room occupancy without using invasive cameras?
Room occupancy can be tracked with complete anonymity using AI-based people counters that process data at the “edge” rather than recording video. Unlike traditional CCTV, these sensors interpret movement patterns without capturing identifiable facial features or personal information. This approach ensures your business remains compliant with GDPR and local Australian privacy standards, maintaining employee trust while still providing the empirical evidence needed for strategic spatial management.
How many sensors do I need to accurately map a large open-plan office?
The number of sensors required depends on the ceiling height, total square meterage, and the specific zones you wish to monitor. For a large open-plan office, sensors are typically placed at key entry points and above specific clusters to capture the narrative of movement accurately. A professional site audit is usually the best way to determine the optimal density of hardware to ensure there are no data blind spots in your facility.
Does space utilisation software integrate with existing building management systems (BMS)?
Modern software is designed to integrate seamlessly with existing Building Management Systems (BMS) through open APIs. This connectivity allows occupancy data to trigger real-time operational changes, such as adjusting air conditioning in high-density zones or alerting cleaning staff to frequently used areas. Using FootfallCam V9 Software, you can bridge the gap between human behavior data and automated building operations to create a truly smart environment.
What is the ROI timeframe for installing a space utilisation system?
Most organizations see a return on investment within 6 to 12 months, primarily through reduced lease costs and energy savings. By identifying surplus space, businesses can confidently downsize or avoid unnecessary expansions, which often results in savings that far exceed the hardware investment. Additionally, the improved operational efficiency in cleaning and maintenance schedules provides immediate, ongoing reductions in recurring overheads that contribute to a healthy Space Utilisation strategy.
How does hybrid work affect traditional space utilisation metrics?
Hybrid work has shifted the focus from static seat counts to dynamic occupancy peaks and “no-show” rates. Traditional metrics often missed the 25% to 30% of meeting room bookings that result in no-shows, a trend that has accelerated in hybrid environments. Modern analysis now prioritizes frequency of use and duration of stay, helping managers understand not just if a space is used, but how it supports collaboration when staff are on-site.