Measuring Retail Customer Dwell Time in Stores and Shared Spaces
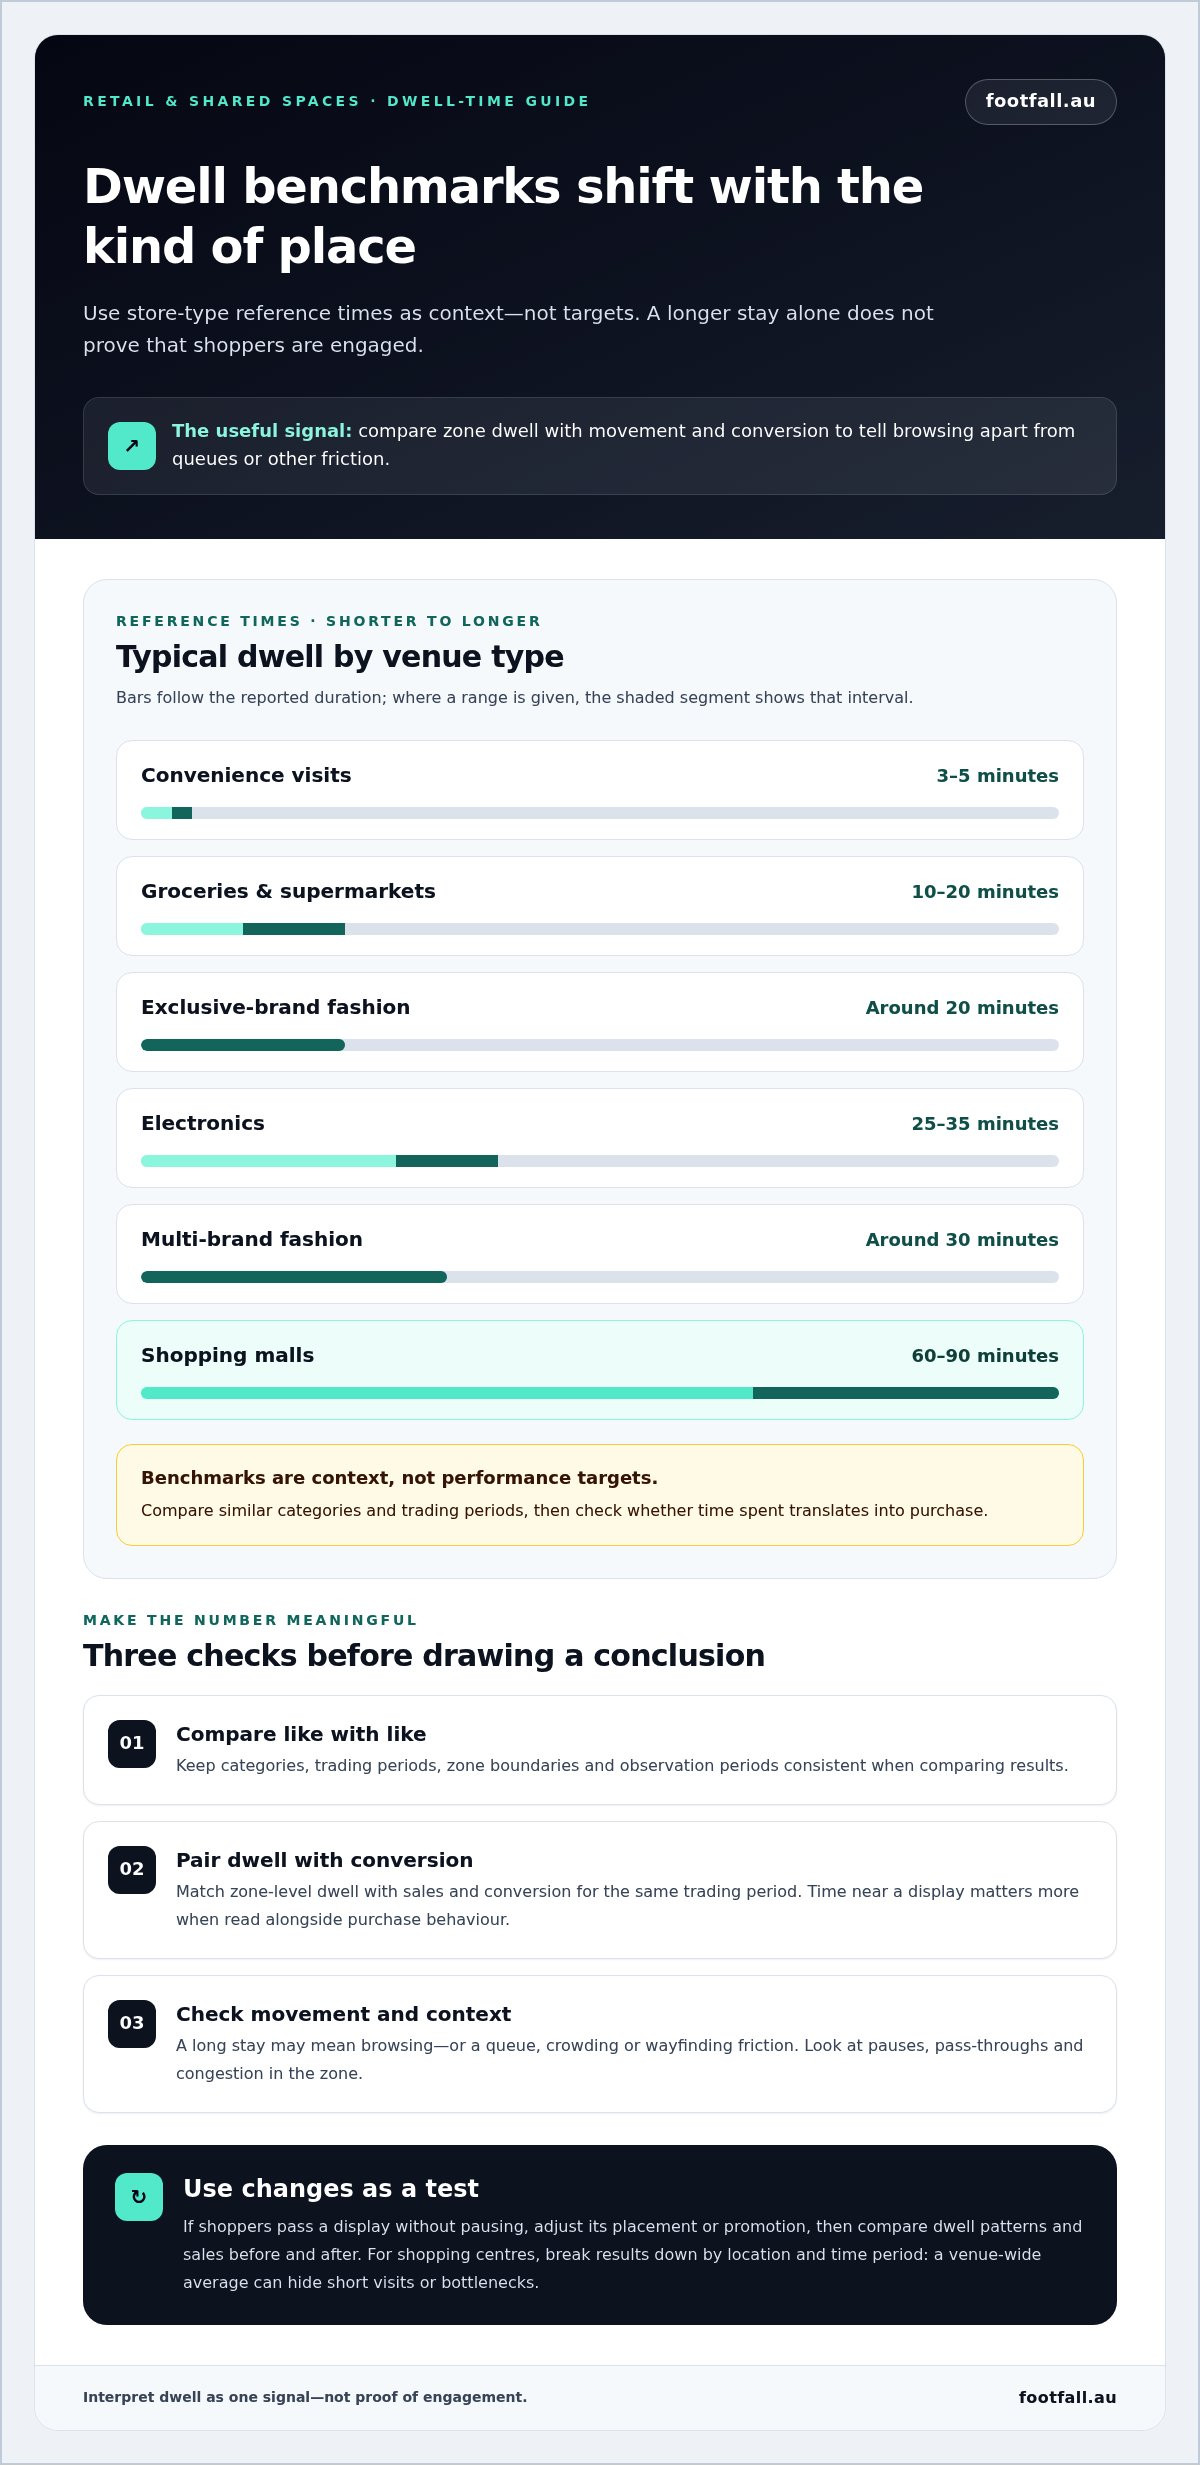
A longer visit can signal friction, not interest. Retail customer dwell time measurement uses sensor-based people-counting systems to record when shoppers enter, exit and move through defined zones; average time in store is total minutes in store divided by total shoppers. For shopping malls, a useful dwell-time benchmark is 60-90 minutes.
Time spent near a display, in a queue and across an entire venue tells different stories. Retail customer dwell time measurement therefore needs context, not just a headline number. Pair dwell patterns with movement and conversion data to distinguish engaged browsing from delays or bottlenecks.
This guide explains how to measure dwell time and use customer movement data to assess store layouts, displays and customer flow. The same approach can help museums and shopping centres understand visitor journeys and identify areas that may need attention.
Key Takeaways
- Compare time spent in a zone with conversion to tell useful browsing apart from queues or other friction.
- Use movement patterns to evaluate display placement, customer pathways and where layout changes may improve exploration.
- Choose measurement methods that suit the space, from direct observation to sensors or wireless signals, and interpret the results in context.
- Apply visitor-flow insights in museums and shopping centres to understand how people use shared spaces and where bottlenecks form.
Using customer movement data to optimise store layout
Movement patterns show where shoppers pause, pass through or encounter friction. Compare dwell time with conversion to see whether a zone supports sales or may need redesign.
In-Store Dwell-Time Sensors
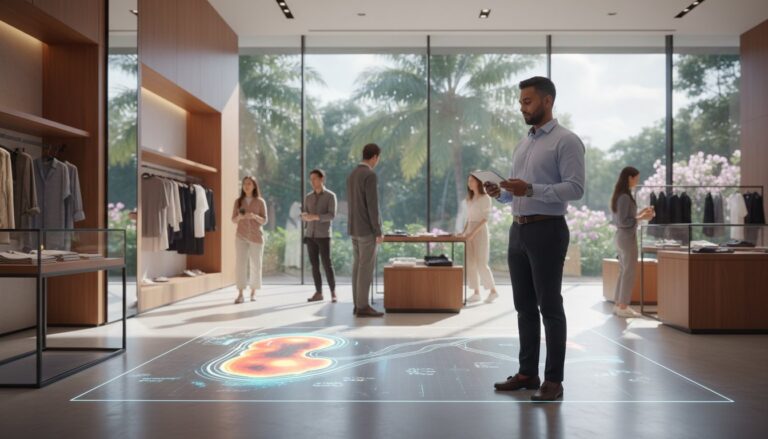
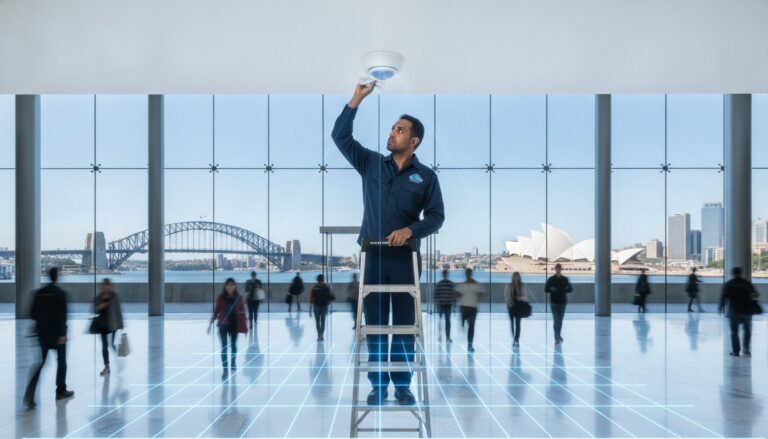
In-store sensors estimate dwell time by detecting movement through defined zones and recording how long people remain there. Overhead 3D sensors or video analytics can track movement as objects, revealing where traffic slows or customers engage. Compare zone results with conversion and view direction to understand the journey. A long stay may reflect browsing, but a queue can indicate friction.
Store-Type Dwell-Time Benchmarks
Typical dwell-time benchmarks vary by store type: convenience visits are around 3-5 minutes, groceries and supermarkets around 10-20 minutes, exclusive-brand fashion around 20 minutes, multi-brand fashion around 30 minutes, and electronics around 25-35 minutes. Use these as context, not targets. Compare similar trading periods and categories, then assess dwell alongside conversion to see whether time spent translates into purchase.
Use zone intelligence to test merchandising changes. If shoppers pass a display without pausing, adjust its placement or promotion, then compare dwell patterns and sales before and after. Consider placing higher-margin products in areas where customer behaviour suggests stronger purchase intent, while checking that the change supports the store’s goals.
Movement data can also inform staffing and store design. Match staff presence to observed traffic patterns, and use pauses or congestion to identify where clearer signage or more accessible pathways could help. In complex retail sectors like dispensaries, connecting store analytics with an all-in-one ERP can further help operators streamline cannabis business operations and inventory flow. Interactive displays, demonstrations, digital kiosks and seating may encourage exploration, but measure their effect rather than assuming longer stays mean better engagement. Align music, lighting and layout with target customers, then assess changes against conversion.
How to measure Dwell Time?
Retail customer dwell time measurement estimates how long visitors remain in a defined area. Manual observation, sensors and wireless signals capture different aspects of a visit, so choose a method that fits the decision you need to make.
Filtering Staff and Passers-By
Filtering removes staff and passers-by from visitor counts, making the resulting metrics more useful. Compare automated counts with a daily 60-second observation of who enters, pauses and engages. Wireless systems may classify devices seen on more than 20% of reporting days or six days, whichever is larger, as staff or regular contractors. A boundary set 1-2 metres inside an entrance can help exclude passers-by.
Connecting Dwell Time and POS Data
Comparing dwell patterns with sales data can show whether time near displays coincides with purchases. Match zone-level dwell with sales and conversion for the same trading period. For retailers seeking to update checkout hardware and software to better integrate transaction insights, resources such as PaySelect help businesses compare and choose compatible POS systems and payment solutions. A dashboard can show whether a display change aligns with shifts in dwell or sales, helping inform stock, staffing and promotion decisions. Keep reporting aggregated rather than linking named visitors to transactions.
Privacy in Dwell-Time Measurement
Privacy-conscious measurement focuses on anonymous, aggregated movement patterns rather than identifying individual shoppers. Retail customer dwell time measurement can use zone-level reporting to assess visitor behaviour without making personal identity the metric. In Australia, consider applicable privacy obligations, limit collection to what the analysis needs, explain its purpose and restrict data access.
Measurement Limitations and Risks
Counts can miss visitors, while wireless tracking may over-represent people whose devices are detected. Sensor placement and sample size also affect reliability. Compare consistent periods across several full weeks, and use more than one measurement approach where suitable. Treat dwell as one signal, not proof of engagement, and interpret it alongside conversion and the purpose of each zone.
Dwell time measurement in museums and shopping centres
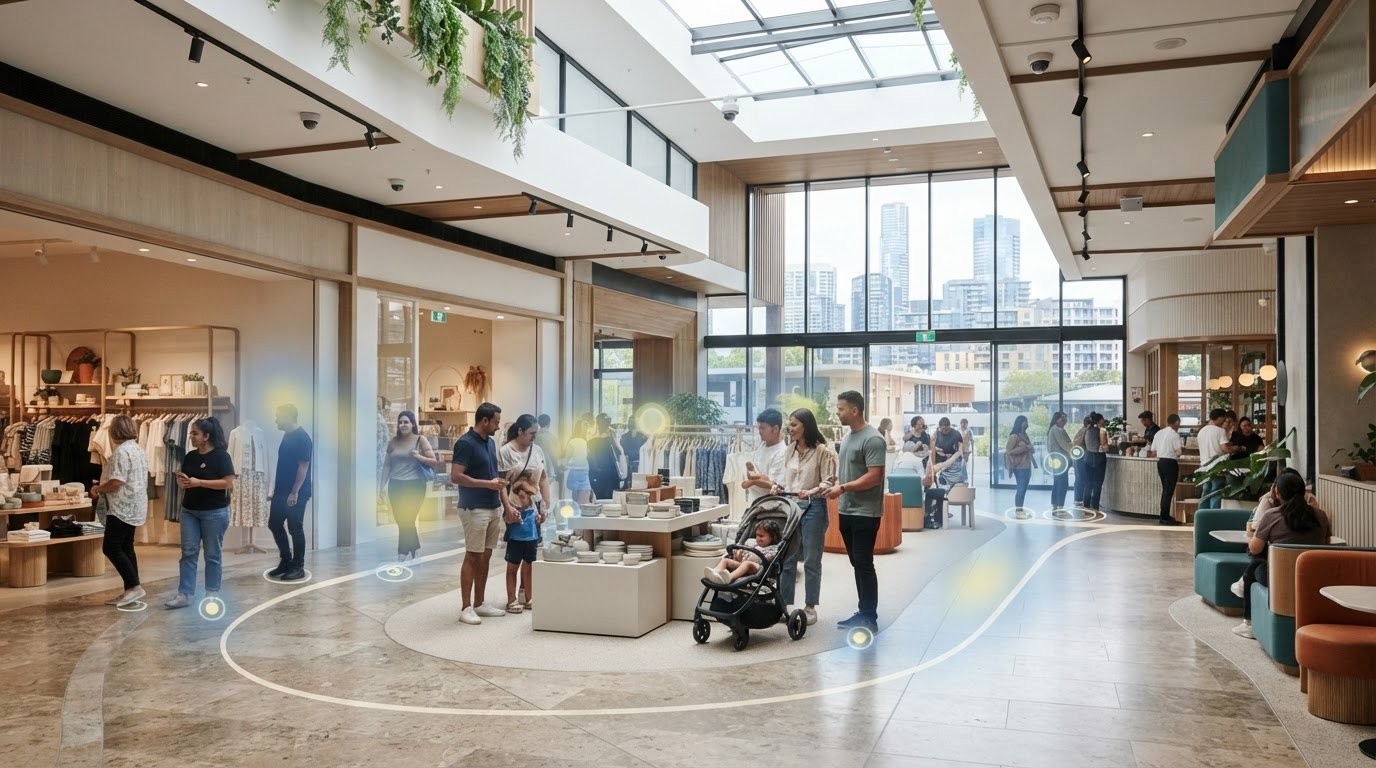
In shared spaces, measure time across meaningful zones, not only from entrance to exit. A shopping centre may track entrances, food courts and corridors, while a museum may compare galleries, exhibits and visitor facilities. These patterns show how people move through distinct environments.
Shopping centres can use sensors at entrances and key locations to estimate movement and time spent in each area. A 60-90 minute dwell-time benchmark is given for shopping malls, but the venue-wide average can hide short visits or bottlenecks. Break analytics down by location and time period to see where traffic builds or disperses.
For museums, zone-level measurement can show which galleries attract longer visits and which routes visitors take between exhibits. Treat dwell as a sign of presence, not proof of interest: visitors may pause because of crowding, seating or wayfinding. Compare movement with exhibit placement and sightlines, then assess whether the visitor journey matches the intended flow.
A practical comparison starts with a baseline for each zone. Then assess a change, such as moving an exhibit or adjusting a shopping-centre seating area, against later movement and dwell patterns in the same location. Keep zone boundaries and observation periods consistent to make the comparison useful. This makes visitor analytics actionable for space planning, traffic management and placement decisions.
Use people-counting technology to turn movement across shared spaces into measurable visitor patterns.
Footfall Australia: FootfallCam Pro2 People Counters
Footfall Australia offers FootfallCam Pro2 People Counters for organisations seeking to measure customer traffic and develop a clearer basis for dwell-time analysis. They can be a practical next step when manual observation no longer provides enough visibility across store zones or shared spaces.
For a measurement approach that includes other listed technologies, Footfall Australia also offers FootfallCam Pro1 IP Cameras, FootfallCam Centroid and FootfallCam V9 Software. Consider the questions your team needs answered, such as how traffic varies by area or whether a layout change alters movement. That focus helps keep measurement tied to operational decisions rather than collecting figures without a purpose.
To discuss people counting for your retail or shared space, contact Footfall Australia.
Turn measurement into your next decision
Start with a focused question, not another dashboard metric. Choose a store zone or shared-space location where a change could improve the visitor experience, then decide which movement or behaviour would show whether it worked. This gives retail customer dwell time measurement a clear purpose and helps teams turn observation into action.
Keep the measure aligned with the decision. A layout test may need zone-level dwell patterns, while a staffing review may need traffic timing. Record the change and compare like-for-like periods so the result can inform the next adjustment. This creates a steady cycle of learning rather than relying on a single snapshot or assumption.
If you’re ready to explore people-counting technology for your environment, contact Footfall Australia. A clear question is a strong place to start, and the resulting evidence can help your team plan with greater confidence.
Frequently Asked Questions
What is Retail Dwell Time?
Retail dwell time is how long a visitor stays in a store or a defined area within it. For example, a retailer might distinguish time spent browsing a homewares section from time spent in the whole store. The measurement boundary matters: a zone-level result can inform decisions about that area, while a store-wide figure describes the broader visit.
How Is Dwell Time Different From Foot Traffic?
Foot traffic measures how many people enter or pass through a location; dwell time measures how long they stay. A store could have steady foot traffic while shoppers move quickly through one department and linger in another. Read the metrics together to distinguish a busy location from one where visitors spend time, then decide which area needs closer attention.
How does it work?
A measurement system detects movement within a defined boundary, notes when a visit begins and ends, then calculates the elapsed time. For a display assessment, compare dwell patterns before and after moving the display. Keep the zone definition consistent across both observations so the comparison reflects customer behaviour, not a changed measurement area.
Questions about Dwell Time?
Start with the decision you want the data to support: are you assessing a display, a service area or a customer route? Then check whether the measure covers the right zone and whether the comparison uses similar trading conditions. These checks help teams focus on a specific operational question instead of treating a single average as a complete explanation.
What does dwell time actually tell you?
Dwell time shows where visitors spend time, but not why. A pause near a display could reflect product interest, difficulty finding an item or waiting for assistance. Treat the result as a clue: identify a plausible explanation, then compare other relevant measures or observe the area before changing the layout or staffing.