How to Increase Retail Sales with Footfall Data: The 2026 Strategy for Australian Retailers
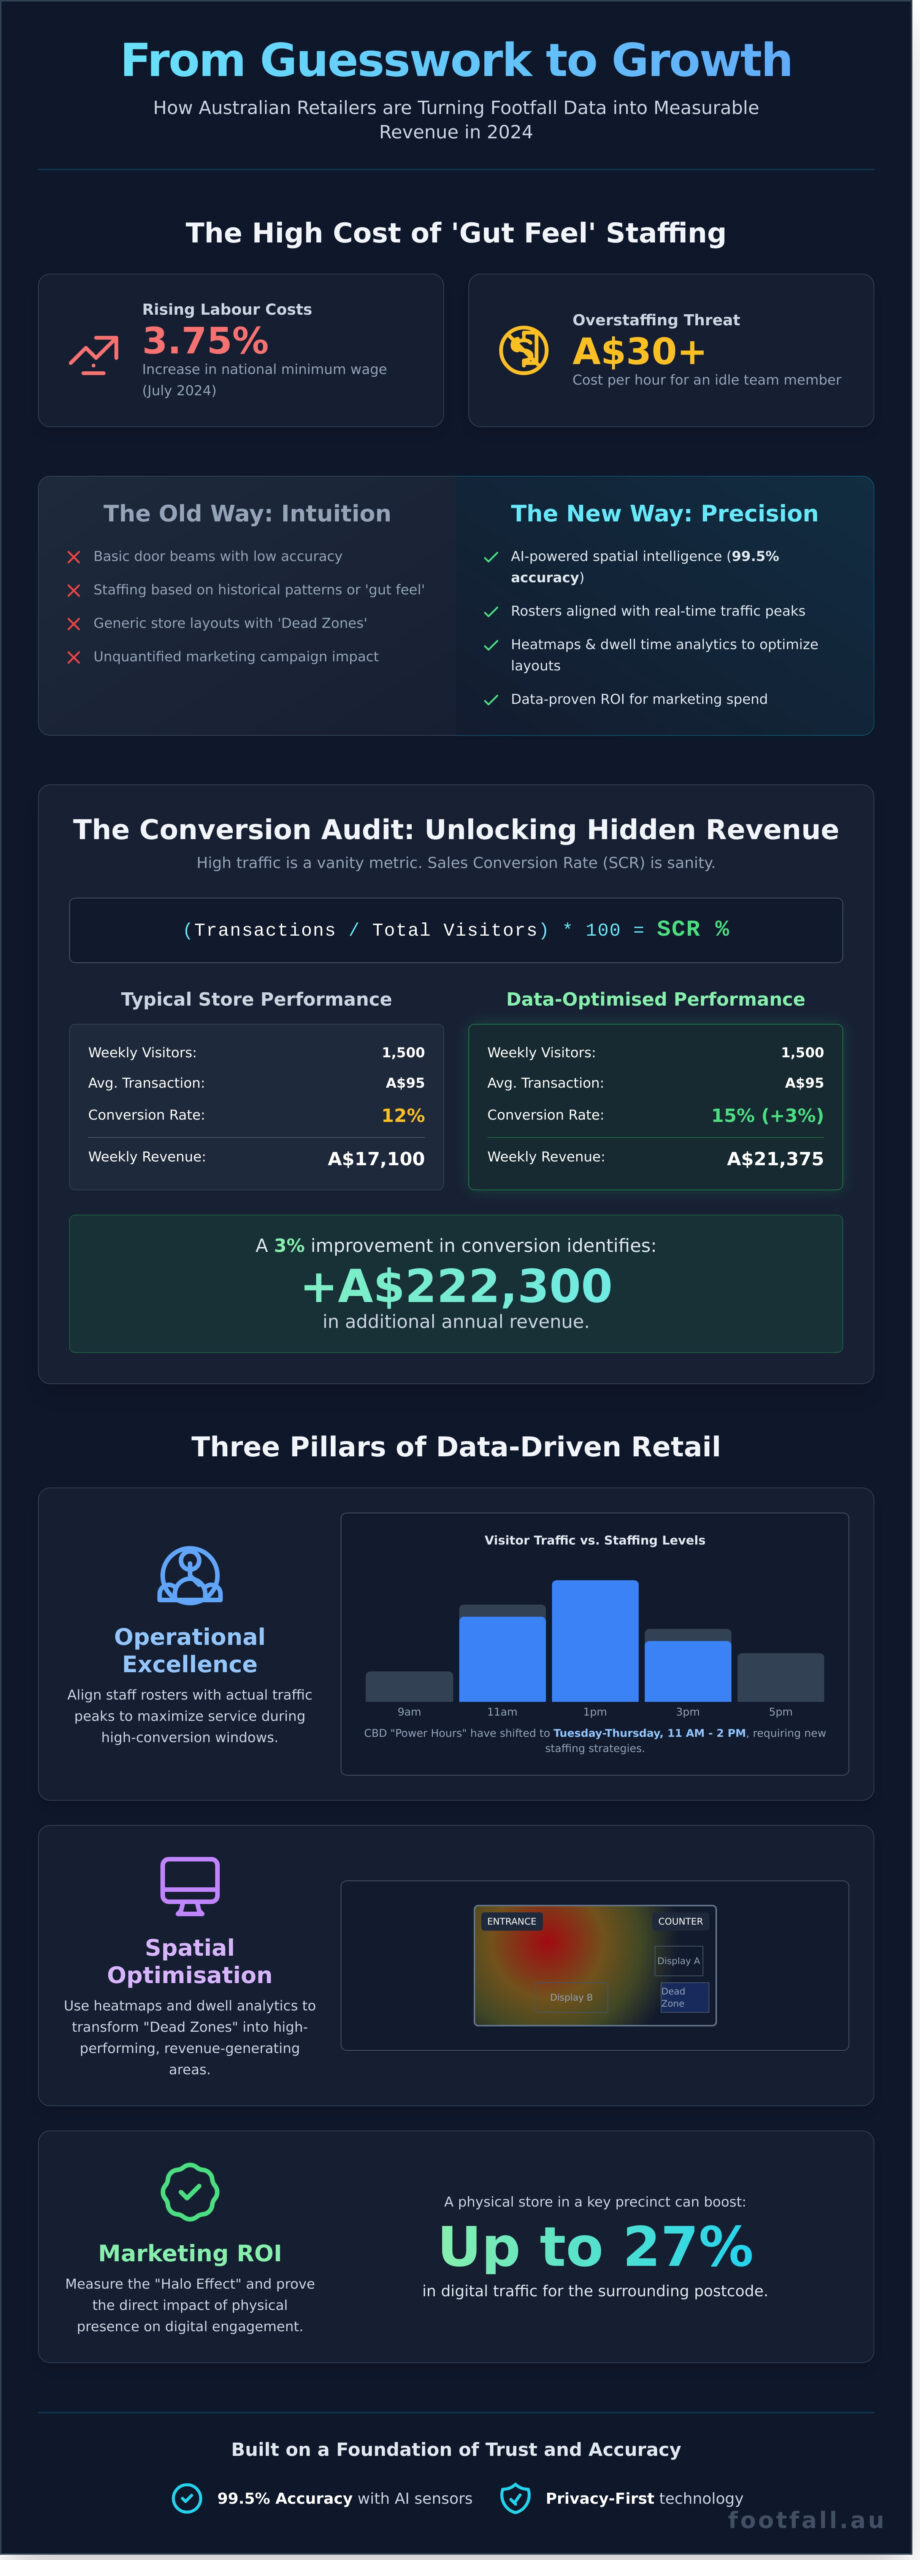
With the Fair Work Commission increasing the national minimum wage by 3.75% in July 2024, can your storefront afford to staff based on gut feel? For many Australian retailers, the cost of an idle team member now exceeds A$30 per hour, making overstaffing a direct threat to your bottom line. You understand that physical retail is no longer about just being present; it’s about being precise. To increase retail sales with footfall data, you need to transform raw visitor counts into actionable intelligence that dictates your daily operations.
We agree that the current climate of declining mall traffic and rising overheads requires a shift from intuition to evidence. This article provides the exact data-driven frameworks used by Australia’s leading retailers to turn foot traffic into measurable revenue growth. We’ll explore how to align your rosters with peak dwell times and use spatial analytics to prove the ROI of your latest marketing campaign. By the end of this guide, you’ll have a clear roadmap to optimize every square metre of your floor space for maximum conversion.
Key Takeaways
- Transition from basic door counters to AI-powered spatial intelligence to identify exactly where revenue is being lost in your store layout.
- Master the specific frameworks required to increase retail sales with footfall data by calculating your true Sales Conversion Rate and identifying missed transaction opportunities.
- Utilise heatmaps and dwell time analytics to transform “Dead Zones” into high-performing areas through data-backed product placement and display optimisation.
- Optimise operational efficiency by aligning staff rosters with predicted traffic peaks to ensure your best team members are present during high-conversion windows.
- Understand the long-term ROI of a hardware-first investment model tailored specifically for the unique dynamics and competitive landscape of the Australian retail market.
The Evolution of Australian Retail: Why Footfall Data is Your Competitive Edge in 2026
Australian retail moved past the era of guesswork in early 2024 as inflationary pressures and rising overheads tightened margins across the board. In 2026, relying on intuition to manage a storefront is no longer just risky; it’s a strategic liability. To increase retail sales with footfall data, modern operators have traded basic infrared door beams for AI-powered spatial intelligence. This shift represents a transition from knowing that someone entered your store to understanding exactly why they stayed or why they left without a purchase.
The “Halo Effect” of physical retail remains a dominant force in the Australian market. Data from 2024 and 2025 confirms that a physical presence in key precincts like Sydney’s Pitt Street or Melbourne’s Bourke Street Mall boosts digital traffic by up to 27% in the surrounding postcode. Leading retailers in these hubs now use business analytics principles to bridge the gap between their online and offline worlds. By treating the physical floor as a live data feed, these businesses are outperforming their less-analytical peers by 15% in overall sales efficiency.
Precision is the new currency. When every square metre of floor space carries a high A$ cost, you can’t afford dead zones. Sophisticated footfall analytics provide the evidence needed to justify rent, optimize layouts, and prove the ROI of marketing spend. It’s about replacing “I think” with “I know.”
From People Counting to Behavioral Intelligence
Modern sensors have moved beyond quantity to focus on quality. In 2026, it’s not enough to count heads; you must decode the visitor journey. High-performance AI sensors now offer 99.5% accuracy, a threshold required for data to be actionable for financial reporting and serious CAPEX decisions. This technology tracks dwell times at specific displays and identifies “hot zones” where engagement peaks. It transforms a simple walk-in into a narrative of human movement, allowing you to increase retail sales with footfall data by placing high-margin products exactly where eyes linger longest.
The Australian Context: Labor Costs and Consumer Shifts
The Fair Work Commission’s wage updates on 1 July 2024 increased the national minimum wage by 3.75%, making labor the most significant variable cost for Australian retailers. Precise staffing is now a survival tactic. You can’t rely on historical patterns when hybrid work has permanently altered peak hours. CBD retailers now see “Tuesday to Thursday” peaks, while suburban hubs in Western Sydney or South-East Queensland experience sustained mid-week growth. Using anonymous AI counting ensures compliance with the Australian Privacy Act 1988 while providing the granular data needed to align staff rosters with actual visitor volume.
- Staffing Optimization: Match employee counts to real-time traffic to avoid A$30+ per hour overspending during quiet periods.
- CBD vs. Suburban Trends: Adapt to the 11:00 AM to 2:00 PM “power hours” that have replaced the traditional 9:00 AM rush in major cities.
- Privacy-First Tech: Deploy LiDAR or AI sensors that process data at the edge, ensuring no personally identifiable information (PII) is ever stored.
The retailers winning in 2026 are those who view their stores as laboratories. They test, measure, and refine. They recognize that every person crossing the threshold is a data point that, when aggregated, reveals the path to sustainable growth. This evidence-based approach provides the quiet confidence needed to navigate a volatile economic landscape with certainty.
The Conversion Audit: Turning Raw Traffic into Real Transactions
High foot traffic numbers often create a false sense of security for retail managers. While a crowded floor looks successful, the only metric that dictates your bottom line is the Sales Conversion Rate (SCR). This figure acts as the pulse of your retail health. It tells you exactly how many visitors actually opened their wallets. To increase retail sales with footfall data, you must stop treating every person who enters your store as a generic statistic and start viewing them as either a converted customer or a missed opportunity.
Quantifying these missed opportunities provides a clear financial target. For instance, if an apparel store in Sydney averages 1,500 visitors weekly with a 12% conversion rate and an average transaction value of A$95, they generate A$17,100. If data analysis reveals the niche benchmark is actually 18%, that store is losing A$8,550 in potential revenue every single week. Using FootfallCam V9 software allows you to automate the integration of your Point of Sale (POS) data with live traffic counts, turning these theoretical losses into visible, actionable targets on a real-time dashboard.
Calculating and Benchmarking Your Sales Conversion Rate
The Sales Conversion Rate (SCR) represents the ratio of total transactions to the total visitor count over a specific period. Linking your POS system with FootfallCam V9 is a three-step process: connect your API, map your transaction timestamps to entry data, and set your reporting frequency. This integration lets you instantly determine if a dip in revenue is a traffic problem or a conversion problem. A traffic problem requires better marketing or window displays; a conversion problem suggests issues with staffing levels, stock availability, or store layout. Recent Australian retail trade data shows that consumer spending can shift rapidly, making it vital to distinguish between external market trends and internal operational failures. You can explore our integration guides to see how this works with your specific POS provider.
Identifying High-Value vs. Low-Value Traffic
Raw numbers are often inflated by “noise” that distorts your SCR. FootfallCam V9 uses advanced AI to exclude staff counts from your totals, ensuring your team’s movements don’t penalize your conversion metrics. Precision improves further through group counting. If a family of four enters a toy store in Brisbane, they usually represent a single buying unit. Treating them as four separate non-converting visitors would artificially crash your SCR. By grouping them as one, your data reflects true buying intent.
- Staff Exclusion: Removes employees from the count to maintain data integrity.
- Group Counting: Identifies families or social groups as a single purchasing entity.
- External Factors: Correlates traffic spikes with local Australian events like the AFL Grand Final or Boxing Day.
Local context is equally important for traffic quality. A massive spike in footfall during the AFL Grand Final in Melbourne might bring thousands of “passers-by” who have zero intent to shop. Similarly, heavy rain in Perth might decrease total traffic but increase the quality of visitors, as only serious shoppers brave the weather. FootfallCam V9 tracks these environmental variables, allowing you to adjust your expectations and staffing levels based on the actual quality of the traffic at your door. This level of detail is how smart retailers increase retail sales with footfall data by focusing energy on the visitors most likely to buy.
Spatial Optimisation: Using Heatmaps and Dwell Time to Drive Sales
Every square metre of a retail floor in high-traffic Australian hubs like Pitt Street Mall or Bourke Street represents a fixed overhead cost. Maximising the return on this space requires more than intuition; it demands spatial analytics. By mapping the science of Dead Zones and Hot Spots, retailers can identify exactly where customers linger and where they vanish. A 2023 study of Australian boutique retailers showed that identifying a single Dead Zone and repositioning inventory led to an 11% increase in department turnover.
Visualising the Customer Journey with AI Heatmaps
The FootfallCam Pro2 uses advanced AI to generate real-time heatmaps, ensuring 100% Australian Privacy Act compliance by processing data locally on the device. These visualisations reveal bottlenecks where crowded aisles frustrate shoppers, often leading to a 15% abandonment rate at the basket stage. Identifying these friction points allows for immediate floorplan adjustments. Retailers must also focus on the Power Lead, the critical first 3 metres of the store. This zone sets the psychological tone. If the heatmap shows shoppers rushing through this area, the entry layout is likely too cluttered or intimidating.
Dwell Time: The Secret Metric of Engagement
Dwell time is the most accurate predictor of Average Transaction Value (ATV). Data from major shopping centres in Sydney indicates that a 10% increase in dwell time translates to an average 1.3% rise in total sales. This metric allows managers to justify the A$15,000 investment in in-store experience zones or comfortable seating areas. Spatial data also empowers tenants during lease negotiations. If you can prove that a specific zone near a secondary entrance attracts 40% of your traffic, you gain significant leverage when discussing A$ per square metre rates with landlords.
Strategic product placement relies on moving high-margin items into the natural flow of traffic revealed by your heatmaps. Don’t guess where customers go. Use this intelligence to increase retail sales with footfall data by aligning your most profitable SKUs with the paths of highest resistance. For instance, placing premium skincare products in an identified Hot Spot near the change rooms can increase grab-and-go purchases by 18%.
Testing store layouts through A/B methodology is the final step in spatial optimisation. Run Layout A for two weeks, then switch to Layout B. By comparing the engagement rates of end-cap promotions between the two periods, retailers often find that a simple 45-degree shift in shelving can boost product interaction by 22%. This evidence-based approach is the most reliable way to increase retail sales with footfall data while minimising the risk of expensive, unproven renovations.
Operational Excellence: Aligning Staffing and Marketing with Demand
Efficiency in retail isn’t just about cutting costs. It’s about maximizing every opportunity that walks through your door. Smart managers use these insights to increase retail sales with footfall data by aligning their most expensive asset, their people, with their most valuable asset, their customers. Precision beats intuition every time. By analyzing historical traffic patterns, managers predict peak periods with 95% accuracy. This eliminates the “Friday Afternoon Rush” panic, where understaffed floors lead to abandoned baskets and frustrated shoppers. Instead of reacting to a crowd, you prepare for it.
The “Power Hour” strategy takes this a step further. It isn’t just about having enough bodies on the floor; it’s about having your best closers present when the traffic-to-conversion potential is highest. If data reveals that your highest average transaction values occur between 11:00 AM and 1:00 PM on Tuesdays, that’s when your top-performing sales staff should be active. To manage this effectively, many retailers use an all-in-one platform like Fyrestone CRM to track sales performance and align staffing with high-value opportunities, ensuring high-intent shoppers receive premium service.
Closing the loop on marketing requires moving beyond digital metrics. You might see a high click-through rate on an Instagram campaign, but did those users actually enter your store? Footfall data provides the missing link. By correlating a specific promotional event or a Sydney Morning Herald print ad with immediate spikes in store entries, you can calculate a true physical ROI. You stop spending on what feels good and start investing in what actually moves the needle. This precision is the most direct way to increase retail sales with footfall data while simultaneously protecting profit margins.
Data-Driven Staff Rostering for Australian Retailers
Australian retailers face high labor costs, often exceeding A$30 per hour for casual staff. You can reduce over-staffing by matching rosters to the Shopper-to-Staff Ratio (SSR). Maintaining a consistent SSR of 1:10 during peak times prevents lost sales. Conversely, identifying “hidden” peaks allows you to improve customer service scores before shoppers feel neglected. For city-specific insights, consider how retail staff optimisation Sydney strategies differ from regional trends.
Quantifying Marketing Success Beyond the Click
Attribution modelling for physical stores transforms the “Store Visit” into a concrete conversion metric. You can compare the effectiveness of local community partnerships against broad-reach advertising by monitoring entry surges. Using FootfallCam Centroid, you can leverage existing CCTV infrastructure to conduct wider-area marketing analysis. This technology tracks movement patterns across entire precincts, providing a 360-degree view of how external campaigns influence local consumer behavior. Evidence-based marketing ensures every dollar spent contributes to measurable growth.
For a deeper analysis of the external transport planning and pedestrian flow that brings customers to a retail precinct in the first place, consulting a specialist in traffic engineering can be beneficial. Resources like mltraffic.com.au provide insights into this broader field of traffic analysis, complementing the in-store data.
Stop guessing how many staff you need or which ads are working. Use hard evidence to optimise your store staffing and marketing ROI today.
Implementing the Solution: Why Footfall Australia is the Strategic Choice
Choosing the right partner determines whether your analytics become a profit driver or a lingering expense. Most providers trap retailers in “SaaS gravity” where monthly subscriptions erode the ROI of your intelligence. Footfall Australia breaks this cycle through a hardware-ownership model. You pay for the sensor once; you own the data forever. This approach eliminates the recurring A$50 to A$150 monthly per-device fees that often plague enterprise budgets. It’s a strategic shift that ensures you increase retail sales with footfall data without sacrificing your margins to permanent overheads.
Local context remains our greatest asset. Retail dynamics in Sydney’s Pitt Street Mall differ vastly from the high-street vibe of Melbourne’s Chapel Street or the rapid expansion in Brisbane’s CBD. We provide the regional expertise that offshore providers can’t replicate. Our team understands the impact of Australian public holidays, local weather patterns, and specific Southern Hemisphere seasonal shifts. This proximity allows us to offer nuanced advice that transforms raw numbers into a localized competitive advantage.
The FootfallCam Pro2 serves as the foundation for this precision. It delivers 99.5% accuracy by using edge-based AI processing to distinguish between adults, children, and staff members. This hardware integrates seamlessly with the V9 software suite, providing a unified dashboard for your entire fleet. To ensure your investment remains relevant, our Legacy Swap Out Plan allows you to upgrade older hardware at a fraction of the cost. This prevents technical debt from accumulating as sensor technology evolves toward 2026 and beyond.
The Footfall Australia Installation & Support Ecosystem
Our national network of certified technicians operates in every Australian postcode. We handle the complexity of cabling, mounting, and calibration to ensure your sensors capture every visitor journey accurately. You don’t have to worry about DIY setups or misaligned sensors that skew your conversion metrics. We offer two distinct tiers of protection:
- Basic Support: Covers essential firmware updates and remote troubleshooting to keep your data flowing.
- Premium Support: Includes proactive health checks and priority response times for high-volume environments.
You can find detailed technical specifications on the FootfallCam Pro2 product page to see how our hardware outperforms standard CCTV-based counting.
Your Roadmap to a Data-Driven 2026
Transitioning to a data-led strategy doesn’t require an overnight overhaul of your entire network. Most successful retailers start with a single pilot store to benchmark performance. Once the ROI is proven, scaling to a national fleet becomes a repeatable process. This phased approach allows you to increase retail sales with footfall data while refining your internal response to the insights gathered. To see how these analytics apply to your specific floor plan, we recommend requesting a live demonstration. We’ll show you exactly how to identify bottlenecks in your store layout through the eyes of our AI sensors.
Future-Proof Your Australian Storefront
The retail landscape in 2026 demands a shift from intuition to evidence. You’ve seen how spatial analytics and dwell time patterns transform floor plans into high-performance sales environments. By aligning your staffing rosters with peak traffic periods, you eliminate missed opportunities and ensure every visitor receives the attention they deserve. The ability to increase retail sales with footfall data isn’t just a technical upgrade; it’s a fundamental shift in how you understand the human movement within your four walls.
Footfall Australia has supported local businesses since 2004, providing the precision required to compete in a tightening market. Our Pro2 hardware guarantees 99.5% accuracy, giving you a crystal-clear view of your conversion rates without the noise of outdated sensors. With local support teams based in every major Australian capital, you gain a strategic partner dedicated to your long-term growth. It’s time to stop guessing and start measuring the metrics that actually drive your bottom line.
Maximise your retail revenue; get a custom Footfall Data strategy for your store today.
Your path to a more profitable and efficient retail operation starts with data you can trust.
Frequently Asked Questions
How can footfall data specifically help me increase my sales conversion rate?
Footfall data increases your sales conversion rate by revealing the exact ratio of store visitors to completed transactions. If your store records 1,200 visitors daily but only 120 sales, your 10% conversion rate highlights a missed opportunity for the other 1,080 people. You can use these insights to increase retail sales with footfall data by adjusting staff rosters during peak hours or optimizing floor layouts to better guide the visitor journey.
Is it possible to integrate footfall data with my existing POS system?
You can integrate footfall data with most modern Australian POS systems through secure API connections. This integration automates the calculation of your conversion metrics by merging real-time traffic counts with transaction logs. It eliminates manual data entry and provides a unified dashboard where you can see how marketing spend impacts both store entry and final revenue. Most cloud-based platforms complete this sync in under 15 minutes.
How do people counters handle staff members so they don’t skew the sales data?
Modern AI counters use height filtering and staff exclusion tags to remove employees from your total visitor count. This technology identifies staff movement patterns or detects specific BLE tags to ensure your data remains 99.5% accurate. By filtering out the 15% of daily traffic often generated by staff breaks and stock replenishment, you get a clean dataset that reflects genuine customer intent rather than operational noise.
Does footfall technology comply with the Australian Privacy Act?
Our sensors comply fully with the Australian Privacy Act 1988 by processing data at the edge and never recording personally identifiable information. The technology converts human shapes into anonymous vector data rather than storing high-resolution facial images. This approach ensures your business meets the Privacy Amendment Act 2017 standards while still providing the deep spatial analytics required for operational growth and long-term strategic planning.
What is the typical ROI for a retail people counting system in Australia?
Most Australian retailers see a full return on investment within 6 to 12 months of implementation. By identifying a 5% gap in peak hour staffing, a mid-sized boutique can capture an additional A$1,200 in weekly revenue that was previously lost to queue abandonment. Over a single fiscal year, this strategic adjustment often results in a A$60,000 uplift in gross sales for a single location.
Can I use my existing CCTV cameras to collect footfall data?
You can leverage your existing IP-based CCTV network by connecting it to an AI-driven analytics platform. While older analog systems lack the resolution for precision, modern 4K security cameras can achieve 90% accuracy when paired with the right server-side processing. This method reduces your initial capital expenditure by A$800 per doorway since you don’t need to purchase and install dedicated hardware sensors to start gathering insights.
How accurate are AI people counters compared to older infrared sensors?
AI-based Time-of-Flight sensors provide 99.5% accuracy, whereas older infrared beam counters often drop to 80% in crowded environments. Infrared systems struggle when two people enter simultaneously, often counting them as a single visitor. AI sensors track individual paths and can distinguish between a shopping trolley and a human, providing the high-fidelity data needed to increase retail sales with footfall data effectively across multiple entrances.
What is the difference between dwell time and simple visitor counting?
Visitor counting tracks the number of people entering a space, while dwell time measures the specific duration a customer spends in a designated zone. A 15-minute dwell time in a high-margin display area suggests strong product engagement, even if it doesn’t result in an immediate sale. Understanding these temporal patterns allows you to refine your merchandising strategies and staff interactions based on how customers actually move through your store.