

People Counter Data Pitfalls That Can Skew Your Findings
A sharp rise in foot traffic may reflect a faulty reading rather than a real surge. Common pitfalls of people counter data interpretation include overlooking outliers, treating correlation as proof of cause, and relying on samples that miss important visitor patterns. Each can turn a plausible chart into a misleading basis for decisions.
It’s reasonable to trust a clear report, but clean visuals don’t guarantee that the underlying data is accurate or representative. Sound interpretation means checking what was measured, how the data was collected, and what else could explain a change.
This article explains how to spot unusual counts, distinguish association from causation, and recognise sampling bias. It also shows how to interpret people-count data in context, so operational decisions rest on evidence rather than an attractive but incomplete trend.
Key Takeaways
- Investigate unusual count changes before treating them as genuine shifts in visitor activity.
- Look for external factors that could explain a relationship before drawing conclusions about cause and effect.
- Assess whether your data reflects the range of visitor behaviours and conditions relevant to the decision.
- Use context and data-quality checks to turn patterns in a report into more reliable operational decisions.
1. Recognising outliers and non-linear relationships
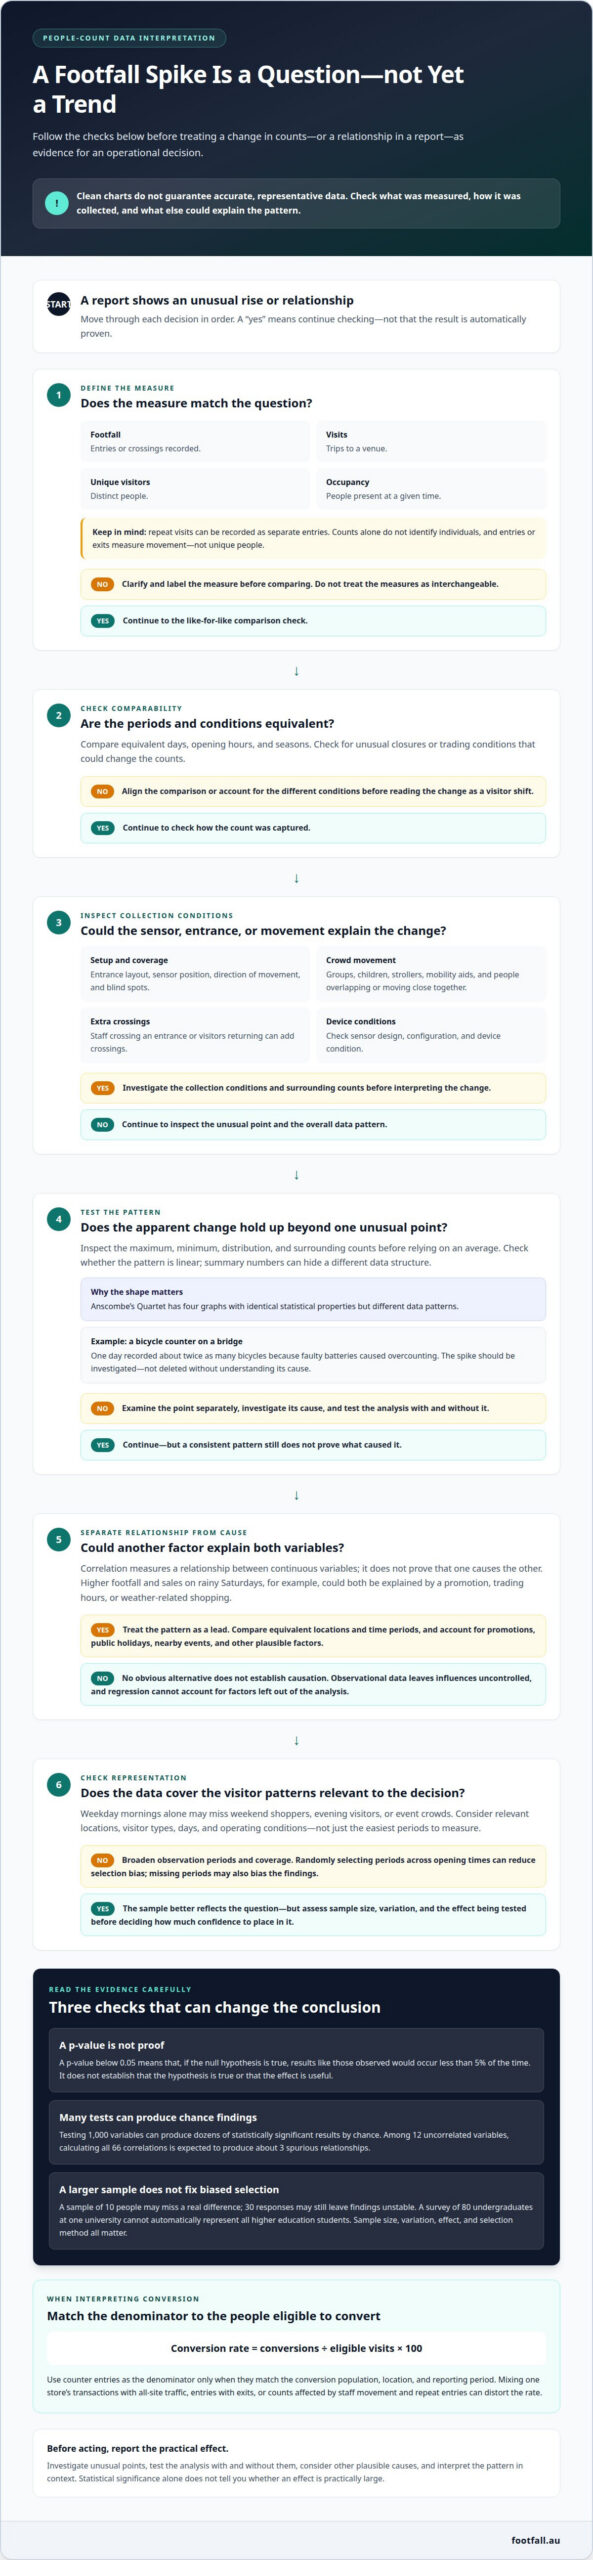
Footfall is the number of entries or crossings recorded; visits are trips to a venue, unique visitors are distinct people, and occupancy is the number of people present at a given time. A counter may record repeat visits as separate entries, so counts alone don’t identify individuals. One common pitfall of people counter data interpretation is treating these different measures as interchangeable.
Accuracy depends on entrance layout, sensor positioning, direction of movement, and crowd overlap. Groups, children, strollers, and mobility aids can affect detection when people overlap or move close together; how they’re counted depends on sensor design and configuration. Staff crossing an entrance and visitors returning can add crossings, while entry and exit counts measure movement, not unique people. Compare equivalent days, opening hours, and seasons, and account for unusual closures or trading conditions.
When analysing outliers, inspect the maximum, minimum, and distribution before acting on an average. A bicycle counter on a bridge recorded about twice as many bicycles on one day because faulty batteries caused overcounting. Investigate the spike against device conditions and surrounding counts; don’t delete it without understanding its cause. Then check whether the pattern is linear. Anscombe’s Quartet contains four graphs with identical statistical properties but different data patterns, showing why summary numbers can hide structure.
Outliers can distort hypothesis tests, especially when they strongly influence averages or model assumptions. A p-value below 0.05 means that, if the null hypothesis is true, results like those observed would occur less than 5% of the time; it doesn’t establish that the hypothesis is true or the effect is useful. Examine unusual points separately, test the analysis with and without them, and report the practical effect before choosing an operational action. Avoiding common pitfalls of people counter data interpretation means investigating the evidence before changing your approach.
2. Correlation versus causation
Correlation measures the relationship between two continuous variables, but it doesn’t prove that one causes the other. A shopping centre might record higher footfall and sales on rainy Saturdays. A promotion, trading hours, or weather-related shopping could explain both changes. Treat the pattern as a lead to investigate, not a reason to act immediately.
Observational data records behaviour as it happens, without controlling for every influence. Compare equivalent locations and time periods. Account for promotions, public holidays, and nearby events, which can affect visits and sales. Regression analysis can help assess measured variables, but it can’t account for factors left out of the analysis. Check whether the proposed explanation fits the evidence, and consider other plausible causes.
Calculate conversion rate as conversions divided by eligible visits, multiplied by 100. Use people-counter entries as the denominator only when they match the conversion population, location, and reporting period. Comparing one store’s transactions with all-site traffic, or mixing entries with exits, creates denominator errors. Staff movement and repeat entries can also distort the rate if the counter’s definition doesn’t match the people eligible to convert.
Chance can create misleading patterns during large-scale analysis. Testing 1,000 variables can produce dozens of statistically significant results by chance. Among 12 uncorrelated variables, calculating all 66 correlations is expected to produce about 3 spurious relationships. A p-value below 0.05 alone doesn’t prove a hypothesis. Use a defined method to test whether the theory holds, and treat unexpected findings as opportunities for further learning. A clear people-counting approach helps keep the traffic measure aligned with the question being tested.
3. Representative sampling and selection bias
A sample should represent the visitor behaviours relevant to your question, not just the easiest periods to measure. If you analyse weekday mornings only, the findings may miss weekend shoppers, evening visitors, or event crowds. Randomly selecting observation periods across opening times can reduce selection bias. Include relevant locations, visitor types, and operating conditions so the results reflect the population you want to understand.
Small samples can produce unreliable results, even when graphs look clear. A sample of 10 people may miss a real difference, while 30 responses may still leave findings unstable. A survey of 80 undergraduates at one university, for example, cannot automatically represent all higher education students. The key issue is whether the sample covers the groups and behaviours behind the decision.
Statistical power depends on sample size, variation in the data, and the effect being tested. A larger sample can help detect a difference, but it won’t correct a biased selection method. Decide which comparison matters, include varied days and conditions, then collect enough observations to distinguish a real pattern from ordinary variation. Treat missing periods as potential sources of bias, not neutral gaps.
Sensor placement and store layout shape which movements are captured. A sensor aimed at a narrow entrance may count more consistently than one facing intersecting paths, where visitors can overlap or pass outside its detection area. Review entrance routes, blind spots, and counter coverage, then compare readings with the question being measured. These steps help prevent sampling errors from distorting the findings.
Explore people-counting options to support more representative measurement across your space.
Random sampling techniques can help produce a representative sample. A sufficiently large sample can help establish statistical significance and reliability. However, a small p-value doesn’t by itself show that an effect is practically large; statistical significance also depends on sample size and study design. A dataset of thirty responses may produce unreliable findings.
Footfall Australia: FootfallCam Pro2 People Counters
Footfall Australia offers FootfallCam Pro2 People Counters for organisations measuring visitor movement across physical spaces. They’re a relevant next step when manual counts or inconsistent records make it harder to assess traffic patterns and plan operations. Counter data still needs careful interpretation: define what counts as an entry, consider how the entrance is used, and compare equivalent periods before acting on a change.
Start with the decision the data needs to support, such as understanding traffic across a retail entrance or public venue. Then consider which locations and movement patterns need to be measured. This connects the measurement approach to the business question, rather than treating every count as a complete account of visitor behaviour.
To discuss FootfallCam Pro2 People Counters for your measurement needs, contact Footfall Australia or visit footfall.au.
Turn better measurement into better decisions
Make each measurement serve a clear operational decision. Before collecting or reviewing counts, define what action the data should inform and who will use the findings. This gives you a practical standard for judging whether a metric is relevant, consistent, and useful over time. Avoiding common pitfalls of people counter data interpretation isn’t about removing every uncertainty; it’s about making assumptions visible and improving how evidence informs decisions.
As your needs change, revisit the question your measurement is meant to answer. A useful next step may be discussing how people-counting technology fits your space and objectives. Contact Footfall Australia to discuss your requirements and take a considered step towards more evidence-led decisions.
Frequently Asked Questions
What are the most common pitfalls when interpreting people counter data?
The main pitfalls are treating an unusual reading as genuine, assuming that two changing metrics have a cause-and-effect relationship, and drawing broad conclusions from unrepresentative observations. Definitions can also differ: a counter may record doorway crossings while a report labels them visits. Before acting, confirm what the metric represents and whether its collection method matches the decision you’re making.
How can people counter data be validated against manual counts or other data sources?
Compare counter readings with manual observations taken at the same entrance and during matching time intervals. Have observers follow the same counting rules, including how they treat staff and people crossing more than once. Then compare totals and note when differences occur, such as during crowded periods. Check operational logs or relevant visitor records for context, ensuring each source measures the same movement over the same timeframe.