

Foot Traffic Metrics for Smarter Weekly Store Decisions
Store visits matter when they inform a decision. Using foot traffic metrics in weekly store meetings means comparing visitor numbers with sales and conversion, then using the pattern to guide staffing and promotions. Counts show how many people enter, while sales and conversion help explain whether those visits lead to results.
It’s easy to rely on intuition when deciding when to roster staff or run an offer. Reviewing visits, sales and conversion consistently gives the team a clearer basis for those choices. This article explains what foot traffic measures, how to interpret it alongside sales, and how weekly patterns can inform practical adjustments without treating any single count as the whole story.
Key Takeaways
- Use foot traffic as a measure of store visits, then interpret it alongside sales rather than treating the count as a complete picture.
- Compare weekly visit patterns with sales and conversion to identify where changes in customer activity may be affecting results.
- Use busier and quieter trading periods to inform staffing plans and decide when a promotion may be most relevant.
- Review the results of staffing or promotional changes against earlier patterns to make the next weekly decision more evidence-based.
What is foot traffic and why measure it?
Foot traffic counts people entering a physical retail store, giving teams a view of visits beyond sales totals. In weekly meetings, comparing this measure with staffing and marketing results helps explain how shopping activity changes.
Visitor Counts, Entry Rates, and Dwell Time
Visitor counts record store entries, entry rates show how visits change over time, and dwell time estimates how long people stay inside. Together, these measures help managers distinguish a quiet trading period from a busy one when sales are not keeping pace. A weekly dashboard can compare visits by day and trading period, with sales alongside them.
Context for Interpreting Traffic Patterns
Weather, public holidays and local events can shift shopping patterns, so compare like-for-like days and note relevant conditions alongside each result. A rainy weekday is not a fair baseline for a sunny weekend. This context helps managers judge whether a change reflects local circumstances or a pattern that may warrant adjusting staffing or a promotion.
Retailers can count visitors manually with clickers or use automatic entrance counters. Video analytics uses cameras to count people entering and exiting. Each method has limitations: crowded doorways, people entering and leaving together, and inaccurate manual tallies can affect results. Treat door-counter figures as estimates, not perfect customer counts.
For privacy, use systems that report anonymous totals where possible. If images or identifiers are collected, assess how Australian privacy requirements apply, and limit access and retention to what the analysis needs.
Australian retail turnover rose 0.8 per cent in November 2024, according to the Australian Bureau of Statistics. In a weekly meeting, show visits, sales and conversion together, with a short note on unusual conditions. Foot traffic alone can mislead: it excludes online sales and says little about whether visitors are likely to buy or what they purchase.
Using foot traffic data to adapt staffing and promotions
Weekly traffic patterns help teams connect customer demand with operational choices. Using foot traffic metrics in weekly store meetings makes staffing and promotion decisions more specific to when people visit.
Forecasting Staffing and Inventory
A traffic forecast estimates future visits from earlier patterns, helping stores prepare staff and stock for expected demand. Compare equivalent trading periods across recent weeks and note recurring peaks or quieter windows. Then consider sales and stock movement alongside the forecast. If Saturday afternoons are consistently busier, managers can plan staff coverage and prepare popular items ahead of time rather than reacting after shelves empty or queues build.
Adapting Promotions and Sales Targets
Promotion planning uses traffic patterns to decide when an offer may reach more visitors and how to assess its performance. If visits tend to rise during a particular period, schedule a relevant promotion then and compare results with similar periods. Set sales targets in context: higher targets may suit periods with more expected visits, while quieter periods may call for a different focus. Using foot traffic metrics in weekly store meetings also helps teams assess whether a promotion matched customer activity.
To schedule staff, map traffic by day and trading period, then align coverage with expected demand. Add staff during recurring busy windows and consider quieter tasks when visits ease. A reporting platform can make patterns from cameras and other counting devices easier to review. Adjust schedules as new patterns emerge.
Keep the dashboard focused on expected visits, staffing coverage and planned promotions. A store traffic analytics approach can help teams connect these choices to observed movement.
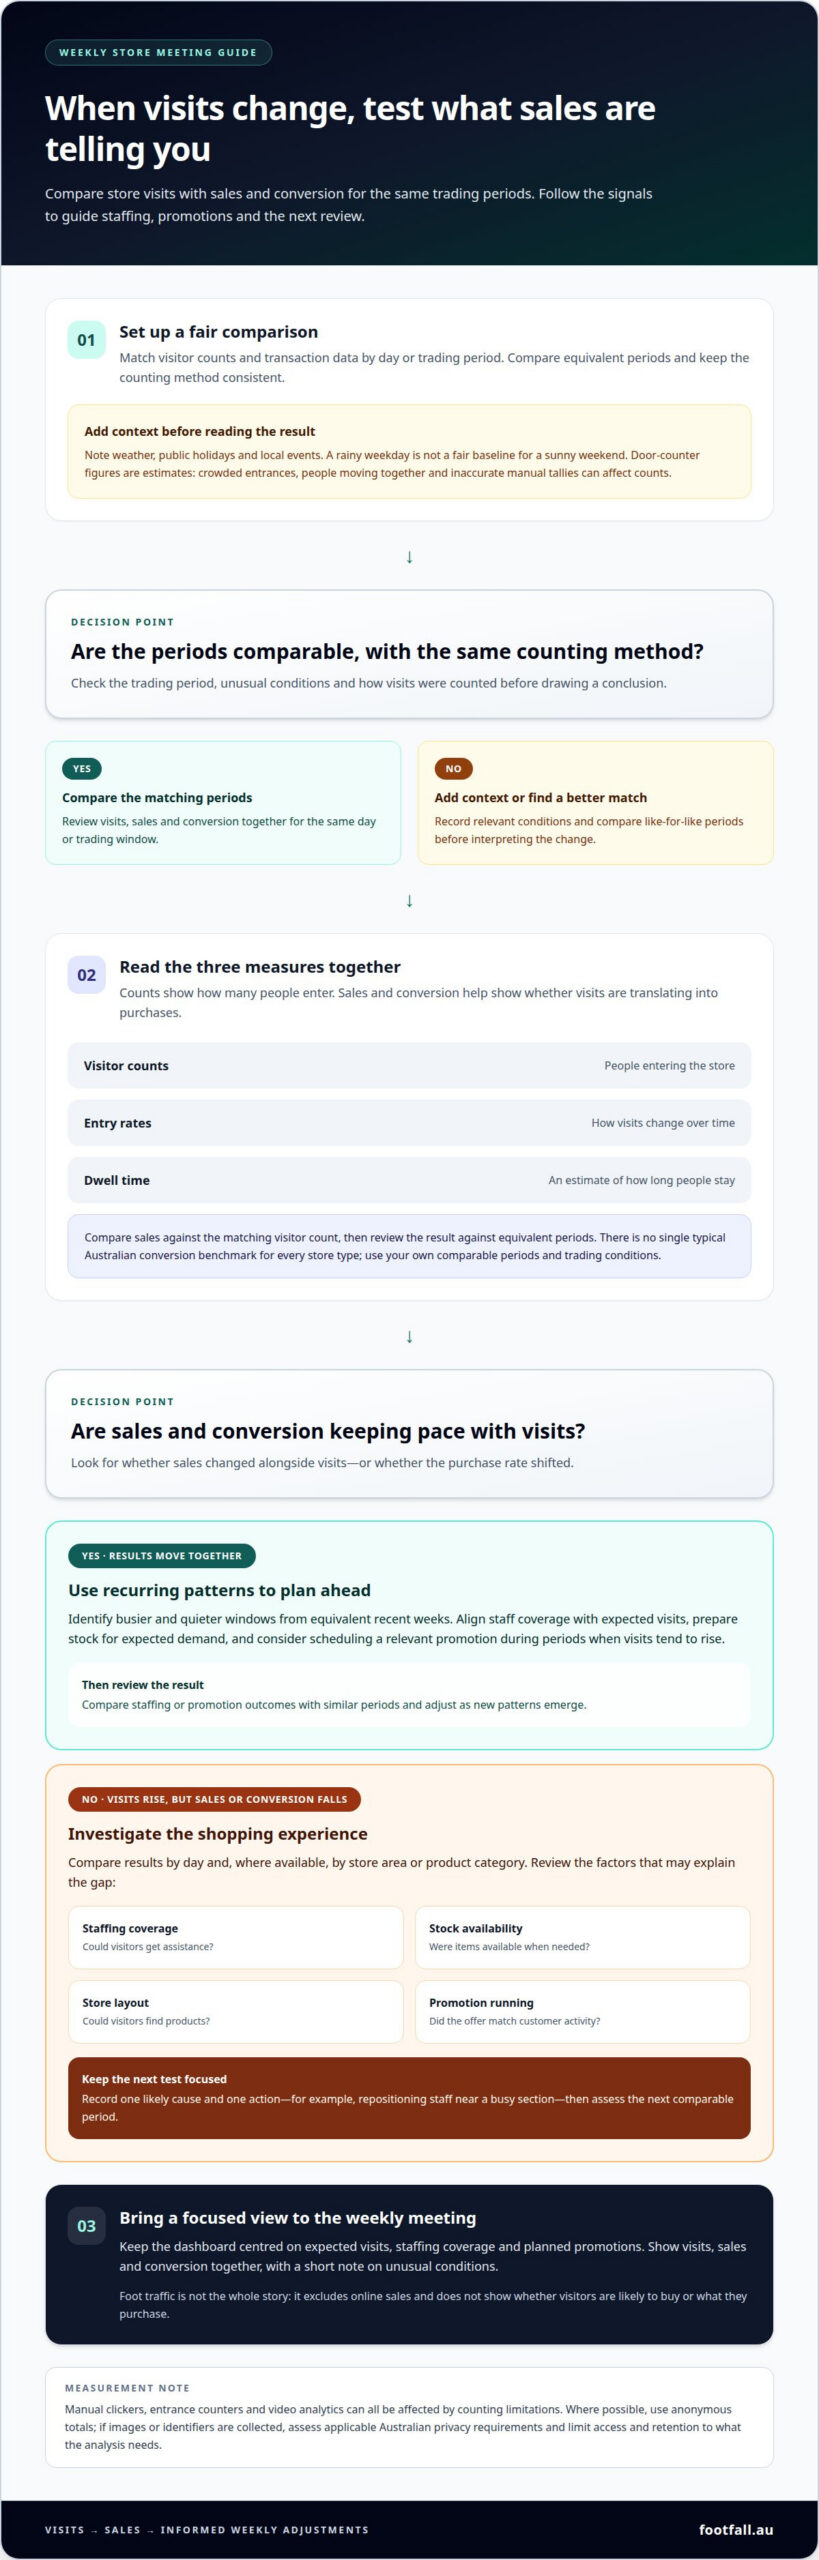
Comparing foot traffic with sales and conversion
Pair visitor counts with sales for matching trading periods to see whether visits are translating into purchases. A disciplined approach to using foot traffic metrics in weekly store meetings helps teams distinguish a change in demand from a change in buying behaviour.
Comparing Visitor Numbers with Sales
Compare visitor numbers with sales, aligning traffic and transaction data by day or trading period. This shows whether sales changed alongside visits or whether the purchase rate shifted. Measure sales against the matching visitor count, then compare the result with equivalent periods. Keep the counting method consistent so changes in tracking do not obscure the trend.
There isn’t one typical Australian conversion benchmark that applies across store types. Set a useful target using your store’s own comparable periods and trading conditions.
Responding to Falling Sales or Conversion
When traffic rises but conversion or sales falls, investigate the shopping experience before changing several strategies. Compare results by day and, where available, by area or product category. Review staffing coverage, stock availability, store layouts and the promotion running during those periods. This can reveal whether visitors struggled to find products, get assistance or respond to the offer.
Record one likely cause and one action, such as repositioning staff near a busy section, then assess the next comparable period. Using foot traffic metrics in weekly store meetings gives the team a consistent way to review that test alongside sales. Sensors can support visit counting, while transaction data shows whether visits became purchases. Consider local community patterns when interpreting unusual traffic, and explore in-store traffic measurement to inform your comparisons.
Footfall Australia
Footfall Australia helps retailers build a clearer view of store visits to support weekly decisions about staffing and promotions. Its offerings include FootfallCam Pro2 People Counters, FootfallCam Pro1 IP Cameras, FootfallCam Centroid and FootfallCam V9 Software.
Consider a people-counting solution when manual tallies make it difficult to compare trading periods or managers need a consistent view of visitor patterns alongside sales data. The aim is to make movement through the store easier to assess and discuss, so teams can connect the numbers with operational choices. A useful weekly review starts with reliable visit information and a clear question about what the pattern means for the store.
Contact Footfall Australia to discuss your store’s foot traffic measurement needs.
Make the next meeting more actionable
Make each weekly review a learning cycle: record the decision, the pattern behind it and the signal to watch next. That turns using foot traffic metrics in weekly store meetings into an operating habit, not a one-off report. It also helps teams distinguish a lasting shift in customer behaviour from a short-lived fluctuation.
Choose one adjustment to test, then review the outcome at the next meeting. If the expected change does not appear, revisit the assumption before making another adjustment. Over time, this measured approach can help store leaders make decisions based on observed customer movement while keeping the in-store experience in view.
For support measuring store visits and interpreting traffic patterns, contact Footfall Australia. Start with a clear question about the decision your data should inform, then build from what the next review reveals.
Frequently Asked Questions
Why is it Important?
Visitor numbers matter because they show whether store performance is changing through demand, purchasing behaviour or both. For example, a store can distinguish a quieter week from one where visits held steady but sales weakened. That distinction helps managers choose a relevant response, such as reviewing product availability or the customer experience, instead of changing staffing or promotions without a clear reason.
Which foot traffic metrics should Australian retailers review in weekly store meetings?
Review total visits, visits by day or trading period, transactions, conversion rate and sales per visitor. Add dwell time or zone activity if the system provides useful, consistent data. A practical meeting view pairs each measure with its comparable prior period and an operational question, such as whether visits to an area changed alongside sales of its products.
How do stores calculate footfall, conversion rate and sales per visitor?
Footfall is the recorded number of store visits during the chosen period. Calculate conversion rate by dividing transactions by visits, then multiplying by 100. Calculate sales per visitor by dividing sales for that same period by visits. For example, align the sales and visit time ranges, and use the same counting method each week so the ratios remain comparable.
How should managers compare weekly foot traffic with the same week last year and budget?
Compare equivalent trading weeks, aligning weekdays and noting differences such as public holidays, local events or unusual trading conditions. Calculate traffic variance against last year as (this year’s visits minus last year’s visits) divided by last year’s visits, then multiply by 100. Compare actual visits with the budget using the same approach, and discuss the operational reason behind each gap.