Retail Staff Optimisation Guide for Australian Retailers
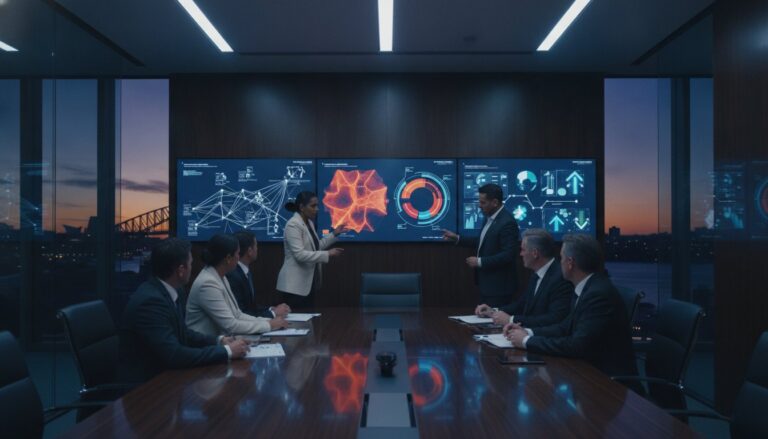
Your staffing roster is costing you sales, and you probably don’t know exactly when or why. Most retail managers in Australia build their schedules around habit, historical guesswork, or a rough sense of when things “tend to get busy.” The result is a familiar and frustrating pattern: too many staff on a quiet Tuesday morning, not enough on a Saturday afternoon when a promotion unexpectedly drives a surge through the door. Benchmarking store performance Australia-wide reveals that this gap between scheduled labour and actual customer demand is one of the most persistent drains on retail profitability.
You already know the pressure this creates. Overstaffed shifts inflate your labour costs without a corresponding return, while understaffed peaks leave customers waiting, dissatisfied, and often walking out. Justifying your headcount decisions to management without concrete data is its own challenge entirely.
This guide gives you a practical framework for aligning your staffing levels to real-time customer traffic, so every shift is built on evidence rather than instinct. You’ll find clear guidance on establishing staff-to-customer ratios, reducing operational overhead, and building the kind of data-backed reporting that makes staffing decisions straightforward to defend and easy to act on.
Key Takeaways
- Traditional gut-feeling schedules create measurable labour leakage — learn how to identify exactly where overstaffed and understaffed shifts are silently draining your store’s profitability.
- Benchmarking store performance Australia-wide consistently points to the staff-to-customer ratio as a critical, yet frequently overlooked, lever for improving both conversion rates and cost efficiency.
- Precise footfall data, captured at the entry and exit level, transforms your scheduling from a reactive habit into a forward-looking, evidence-based strategy built around your store’s actual peak demand windows.
- Optimised staffing directly improves your Cost of Labour percentage on the P&L — discover the framework for aligning headcount to your highest-conversion trading hours rather than historical assumptions.
- FootfallCam Pro2 hardware paired with FootfallCam V9 Software delivers the real-time traffic intelligence Australian retailers need to make staffing decisions that are easy to act on and straightforward to defend.
The Evolution of Retail Staffing: Moving Beyond Intuition
Retail scheduling in Australia has long operated on a foundation of habit. A manager notices the store gets busy on Saturday afternoons, so they staff up every Saturday afternoon. A quiet pattern emerges mid-week, so Tuesday mornings run lean. Over time, these observations harden into fixed rosters that bear little relationship to what’s actually happening on the floor. The problem isn’t that the observations were wrong. It’s that they were never precise enough to act on with confidence.
The 2026 Australian retail environment makes this imprecision increasingly expensive. Shopping behaviour has become genuinely volatile. Promotional campaigns, local events, school holidays, and shifting consumer confidence can compress an entire week’s traffic into a single afternoon. A roster built on last quarter’s patterns can’t anticipate that kind of variability. What’s needed isn’t a better guess. It’s a different approach entirely.
The Cost of Misaligned Staffing
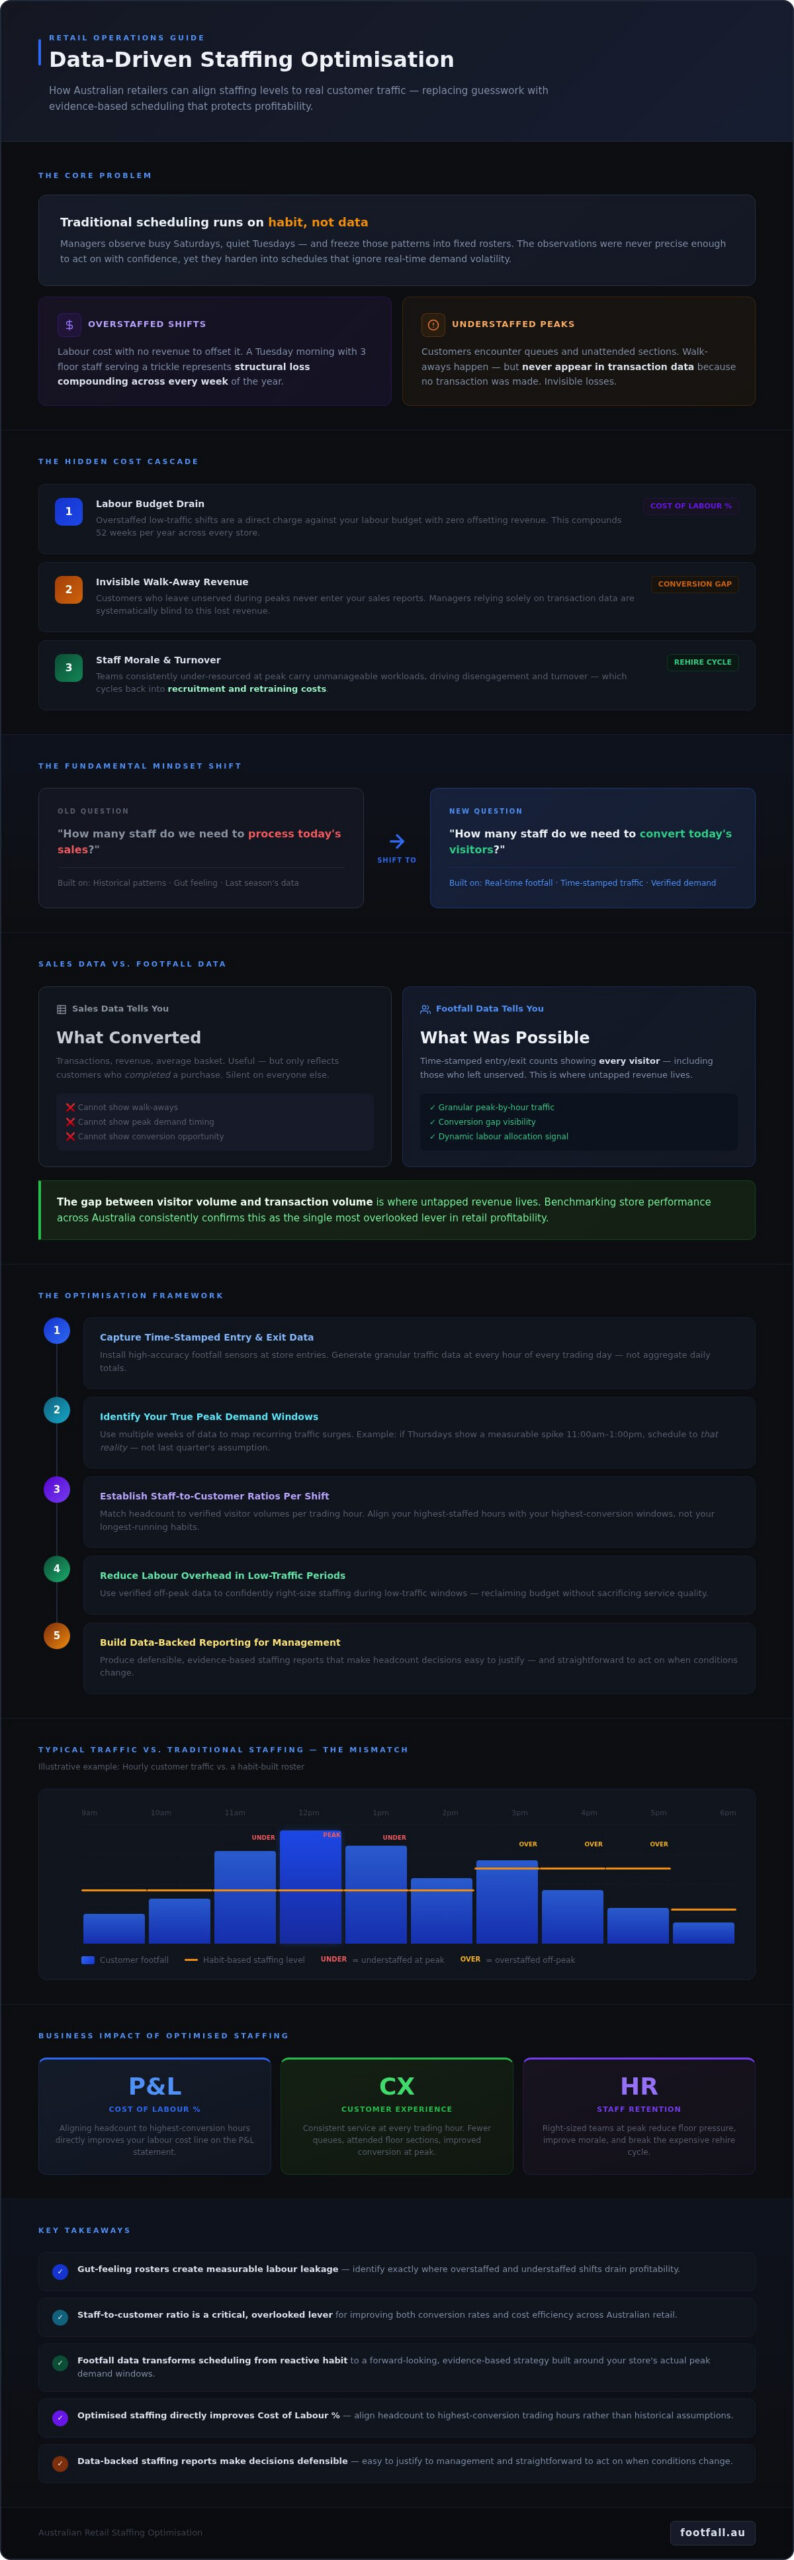
Overstaffing during low-traffic periods isn’t just an inefficiency. It’s a direct charge against your labour budget with no corresponding revenue to offset it. A Tuesday morning shift with three floor staff serving a trickle of browsers represents a structural loss that compounds across every week of the year. The inverse is equally damaging. When customer volumes spike and your team is stretched, service quality deteriorates and patience runs out. Customers who encounter long queues or unattended floor sections frequently leave without purchasing. These walk-aways don’t appear in your transaction data because no transaction occurred, which makes them invisible to managers relying solely on sales reports.
There’s a further cost that rarely makes it onto a spreadsheet: staff morale. Floor teams who are consistently under-resourced during peak periods carry the weight of an unmanageable workload. That pressure drives disengagement, increases turnover, and ultimately feeds back into your labour costs through recruitment and retraining cycles.
Why Footfall Data is the New Retail Standard
Sales data tells you what converted. Footfall data tells you what was possible. The distinction matters enormously when you’re trying to build a staffing model that performs under real conditions. Retail footfall analysis in Australia has shifted from a niche analytics exercise to a core operational discipline, precisely because it reframes the scheduling question. Instead of asking “how many staff do we need to process today’s sales?”, you’re asking “how many staff do we need to convert today’s visitors?”
Benchmarking store performance Australia-wide consistently shows that the gap between visitor volume and transaction volume is where untapped revenue lives. High-accuracy entry and exit sensors provide the granular, time-stamped traffic data that makes dynamic labour allocation possible. When you know that your store receives a measurable surge between 11:00am and 1:00pm on Thursdays, you can schedule to that reality rather than a historical assumption. That shift from reactive to evidence-based scheduling is where the operational advantage begins.
Leveraging Footfall Data for Precision Labor Management
Retail staff optimisation, at its core, is the discipline of matching your human resources to verified customer demand. Not estimated demand. Not last season’s demand. The actual, time-stamped movement of people through your store on any given day. When that alignment is precise, your labour budget works harder, your team performs better, and your customers receive consistent service at every trading hour. The challenge has always been acquiring data granular enough to make that alignment possible.
This is where physical floor management separates itself from digital analytics platforms. CRM tools and omnichannel dashboards tell you a great deal about your customers’ online behaviour, but they’re silent on what happens once someone walks through your door. Benchmarking store performance Australia-wide consistently reveals that the most significant scheduling errors occur not from poor planning, but from planning against the wrong data source.
Capturing High-Fidelity Traffic Metrics
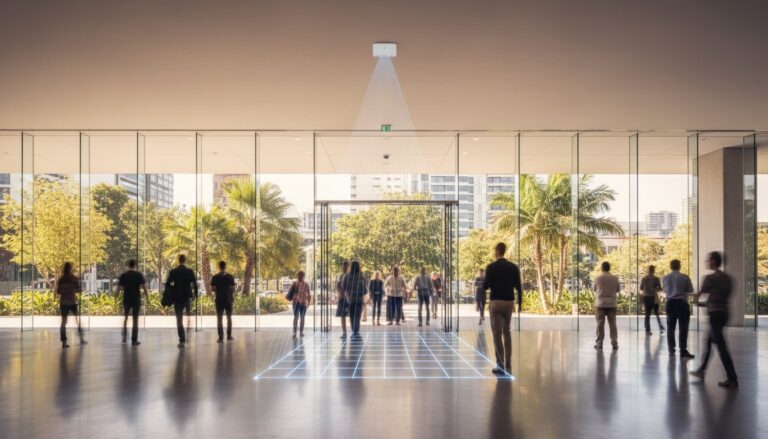
The FootfallCam Pro2 People Counter is built around one non-negotiable requirement: accuracy. When you’re using traffic data to justify staffing decisions on a shift-by-shift basis, even a modest error rate compounds into meaningful miscalculation across a trading week. The Pro2 achieves this precision through overhead 3D stereo vision technology, which distinguishes between adults, children, and staff members to produce a clean count of genuine shoppers. That filtering capacity matters enormously. A raw door count that includes your own team members during a shift changeover, or a group of children accompanying a single purchasing adult, will distort your ratios and lead you back toward the same guesswork you’re trying to leave behind.
People counting technology at this level of fidelity also captures directional flow, which means you’re not just counting entries but understanding the sequence and distribution of movement through your store. That distinction is what makes zone analytics possible.
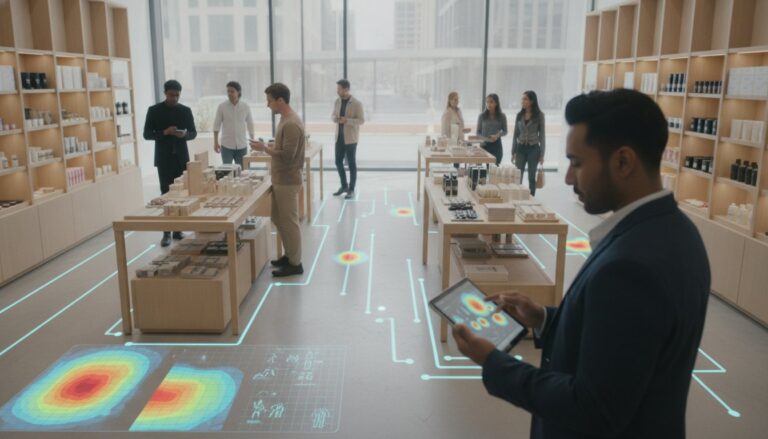
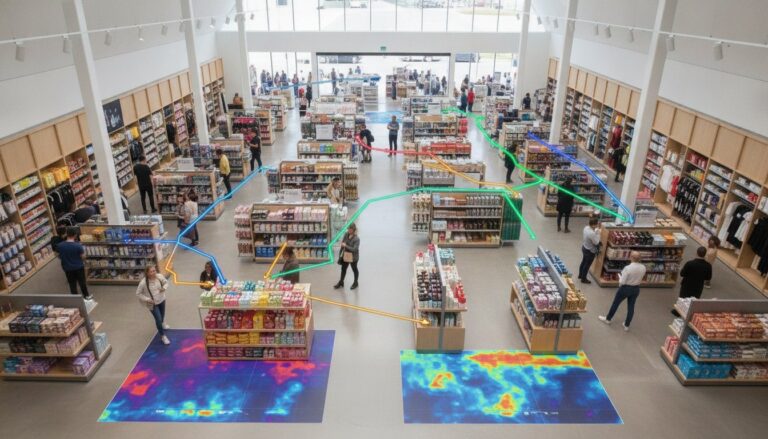
Zone analytics takes your floor plan and maps actual dwell time against specific areas. If your homewares section consistently draws extended browsing between 10:00am and 12:00pm on weekends, that’s where a product specialist should be positioned during those hours, not stationed at a quieter register. Dwell time data transforms staff placement from a general headcount exercise into a targeted deployment strategy.
Turning Raw Numbers into Actionable Schedules
Data only earns its value when it drives a decision. The FootfallCam V9 Software converts raw traffic metrics into visual heatmaps, hourly traffic curves, and comparative reports that make scheduling patterns immediately legible. You can see, at a glance, which hours in a given week are consistently underserved and which are routinely overstaffed.
Historical data within the platform also supports forward planning. Seasonal events, public holidays, and promotional periods in Australia often produce traffic patterns that repeat with reasonable consistency year on year. Using that accumulated data to anticipate a pre-EOFY surge or a post-Christmas clearance peak means your roster is built on evidence rather than a manager’s memory of last year.
For stores already running Workforce Management tools, the V9 Software is designed to integrate with existing operational infrastructure, so traffic intelligence feeds directly into the systems your team already uses rather than creating a parallel reporting burden. If you’re ready to move from intuition-based rostering to a data-led model, exploring how footfall analytics fits your current setup is a practical first step.
Benchmarking store performance Australia requires this kind of layered visibility. Entry counts alone are a starting point. Entry counts combined with zone dwell time, staff filtering, and historical trend analysis give you the complete picture your scheduling decisions actually need.
A Framework for Staffing Optimisation: Ratios and Peak Alignment
Knowing that your staffing is misaligned is one thing. Having a structured method to fix it is another. The five steps below give you a repeatable process for building rosters that reflect what your store actually needs, rather than what a manager estimated it might need last quarter.
Calculating the Ideal Staff-to-Customer Ratio
Your Staff-to-Customer Ratio (STCR) is the primary KPI for labour efficiency: it defines how many concurrent shoppers one floor team member can serve without service quality degrading. Getting this number right is foundational, because every scheduling decision you make downstream flows from it.
The calculation starts with your store’s service model. A high-touch specialty retailer, such as a jeweller or a premium homewares store, will typically operate at a tighter ratio because each customer interaction is longer and more consultative. A low-touch discount or convenience format can sustain a wider ratio because transactions are faster and customers largely self-serve. Neither model is inherently better; they simply require different calibration. Start by tracking how long a typical customer interaction takes on your floor, then use your average concurrent visitor volume during a standard trading hour to set your baseline STCR. From there, benchmarking store performance Australia-wide against comparable store formats gives you a reference point to validate whether your ratio is competitive or needs adjustment.
Aligning Rosters with Traffic Peaks
Hourly scheduling blocks are too blunt an instrument for modern retail. A surge that begins at 12:10pm and peaks at 12:40pm looks like a quiet hour if you’re only reviewing hourly aggregates. Shifting to 15-minute traffic intervals, which FootfallCam V9 Software supports natively, reveals the true shape of your trading day and exposes the specific windows where your STCR is being breached.
Two patterns consistently appear across Australian retail environments: the lunchtime rush, typically concentrated between 12:00pm and 1:30pm, and the after-work surge, which often compresses into a narrow 45-minute window between 5:15pm and 6:00pm. Both are predictable. Both are frequently understaffed because rosters are built around shift start times rather than traffic curves. Scheduling a staggered start for one additional team member at 11:45am costs less than the conversion losses that accumulate across a poorly covered lunch peak every week.
Break scheduling deserves the same precision. Sending two staff members on break simultaneously during a predictable lull at 3:00pm is operationally sound. Doing it at 12:30pm because the shift pattern defaults that way is a structural error. Use your 15-minute traffic data to identify consistent low-volume windows and anchor your break rotation to those periods.
The final step in this framework is the most iterative: compare your conversion rate against your STCR data across different trading periods. You’re looking for the staffing threshold at which conversion stabilises, the point where adding another team member produces diminishing returns. That threshold is your sweet spot, and finding it through evidence rather than assumption is precisely what separates data-led scheduling from the guesswork that benchmarking store performance Australia consistently identifies as the root cause of avoidable labour leakage.
The Business Impact: Balancing Operational Costs and Customer Experience
Every percentage point on your Cost of Labour line has a story behind it. When staffing is misaligned with actual customer demand, that story is one of avoidable waste: hours paid out during quiet periods that generated no corresponding revenue, and peak windows where insufficient coverage quietly suppressed conversion. Correcting that misalignment doesn’t just tighten your P&L. It changes the entire dynamic between your team, your customers, and your trading results.
The mechanism is straightforward. When your roster is built around verified traffic data rather than estimated demand, scheduled hours map to periods where they produce measurable returns. Labour spend during genuine peak windows drives conversion. Labour spend during confirmed quiet periods is reduced or redistributed. The Cost of Labour percentage falls not because you’ve cut headcount, but because the hours you’re paying for are doing productive work.
Maximising Sales Conversion Rates
High traffic with insufficient staff doesn’t produce partial sales. It produces abandoned decisions. A customer who can’t locate assistance during a considered purchase doesn’t typically wait; they leave, and that lost transaction is invisible in your sales data. Footfall data analysis makes those invisible moments visible by comparing visitor volume against transaction volume at a granular level. When you can see that a Thursday lunchtime surge consistently produces a conversion dip, you’re no longer guessing at the cause. You’re identifying a staffing gap that has a direct revenue consequence.
There’s also a psychological dimension worth acknowledging. A well-staffed floor communicates confidence and accessibility to customers. Shoppers who are greeted promptly, assisted without hunting for help, and processed through a queue that moves efficiently are more likely to complete their purchase and spend closer to their original intent. The floor experience shapes the transaction value, not just whether a transaction occurs at all.
Long-term ROI of People Counting Systems
The payback period on a people counting system in Australia is driven by two compounding factors: the operational savings from eliminated labour leakage, and the revenue recovered from better-staffed peak periods. For most retail formats, those combined gains begin to offset hardware investment within the first trading year, though the exact timeline depends on store size, traffic volume, and current scheduling inefficiency.
One application that’s frequently overlooked is lease negotiation. Accurate, time-stamped traffic data gives you an objective record of your store’s actual footfall performance relative to the centre or precinct. That evidence base strengthens your position when renegotiating lease terms, particularly in retail environments where landlord traffic projections and actual shopper volumes don’t always align. Data-backed conversations produce better outcomes than assertions.
The investment in footfall intelligence compounds over time. Each trading cycle adds to your historical dataset, improving the accuracy of forward planning and making every subsequent scheduling decision more defensible. Explore how FootfallCam hardware and V9 Software can be configured for your store format to understand what that return looks like in practice.
Implementing Data-Driven Staffing with FootfallCam Solutions
Understanding the framework for staffing optimisation is one thing. Having the right hardware and software infrastructure to execute it consistently across a retail network is another. FootfallCam Pro2 People Counters, paired with FootfallCam V9 Software, give Australian retailers the technical foundation to move from theoretical alignment to operational reality. The system is built around a single principle: data is only valuable when it drives a specific, defensible decision.
The FootfallCam Pro2 delivers the overhead 3D stereo vision accuracy that staffing decisions genuinely require. Its staff-filtering capability removes your own team members from the visitor count automatically, so the numbers feeding your scheduling model reflect actual customer traffic rather than a combined figure that inflates your apparent demand. For multi-site retailers benchmarking store performance Australia-wide, that clean data integrity is non-negotiable. A single miscalibrated sensor in a network of twenty stores quietly distorts every comparative report you produce.
Addressing the Legacy Sensor Problem
Many Australian retailers are currently making scheduling decisions against data produced by ageing infrared beam counters or first-generation video sensors. These systems were never designed to distinguish staff from customers, can’t filter for children, and frequently undercount during high-traffic periods when queuing disrupts the sensor field. The result is a systematic distortion that no amount of analytical sophistication can correct downstream.
Footfall Australia’s Legacy Swap Out Plan is designed specifically for this situation. Rather than requiring a full infrastructure overhaul, the programme replaces inaccurate legacy hardware with Pro2 units through a managed transition process. Existing cabling and mounting infrastructure is assessed and, where viable, retained to reduce installation complexity. The outcome is a clean data environment without the operational disruption of a ground-up installation. For retailers who’ve been working around unreliable counts for years, the improvement in data quality is immediate and measurable from the first trading week.
Nationwide installation and support is delivered through Footfall Australia’s partner network, which means consistent hardware performance and maintenance coverage regardless of where your stores are located. Data integrity doesn’t degrade at the edges of your network.
Why Footfall Australia is the Preferred Strategic Partner
Operating in the Australian retail market since 2004, Footfall Australia brings two decades of local market knowledge to every engagement. That tenure matters because Australian retail has distinct trading rhythms, including EOFY surges, state-based public holiday variations, and regional shopping centre dynamics, that a generalist international vendor won’t understand at the operational level.
Store managers receive structured training on the V9 platform, so the transition from installation to active use doesn’t stall at the reporting stage. Reporting configurations are customisable to your specific business goals, whether that’s tracking STCR compliance across a national network, isolating conversion performance by zone, or building the labour cost reporting your finance team needs at month-end. To further streamline these back-office processes, Financial Foothold provides outsourced accounting operations and payroll administration for growing businesses seeking to optimise their financial operations.
Next Steps for Your Retail Business
Getting started is a practical process, not a lengthy procurement cycle. Three entry points suit different stages of readiness:
- Site survey for national store networks: A structured assessment of your current sensor infrastructure, floor layout, and traffic patterns across multiple locations, producing a clear hardware and configuration recommendation.
- Pro2 configuration consulting: For stores with specific layout challenges, including multi-entry formats, mezzanine levels, or high-volume concourse positions, consulting on the optimal Pro2 placement ensures you capture complete traffic data from day one.
- Data-readiness assessment: If you’re unsure whether your current data environment is reliable enough to build scheduling decisions on, a readiness assessment identifies the gaps and maps the path to clean, actionable traffic intelligence.
Contact Footfall Australia to discuss which entry point fits your current situation. The conversation starts with your store, not a generic product pitch.
Your Next Roster Should Be Built on Evidence, Not Estimates
Staffing decisions made on instinct carry a hidden cost that compounds quietly across every trading week. The framework covered in this guide gives you a structured path from that guesswork to a scheduling model grounded in verified customer traffic, precise staff-to-customer ratios, and forward-looking peak alignment.
Three things are worth carrying forward. First, your conversion rate is directly tied to how well your floor coverage matches actual visitor demand. Second, benchmarking store performance Australia-wide consistently identifies labour misalignment as a controllable cost, not an inevitable one. Third, the data quality underpinning those decisions matters as much as the decisions themselves.
Footfall Australia has been helping Australian retailers build that data foundation since 2004. With 99% counting accuracy from the FootfallCam Pro2 and V9 Analytics Software included as standard, the intelligence your scheduling needs is closer than you might expect.
Optimise your retail staffing with Footfall Australia today and start building rosters your whole team can work with confidently.
Frequently Asked Questions
How do people counters help with retail staff optimisation?
People counters give you verified, time-stamped data on exactly when customers enter and move through your store, replacing scheduling guesswork with evidence. Instead of rostering based on historical habit, you can align staff deployment to confirmed traffic curves, including specific 15-minute windows where demand consistently peaks or drops. That precision means scheduled hours are working productively rather than sitting idle during quiet periods or stretched thin when volume surges.
Can people counting systems distinguish between staff and customers?
Modern overhead 3D stereo vision systems, including the FootfallCam Pro2, filter out staff members automatically, producing a clean count of genuine shoppers only. This distinction is critical for scheduling accuracy. A raw door count that includes your own team during a shift changeover inflates your apparent customer demand and distorts every ratio calculation downstream. Staff filtering ensures the data feeding your scheduling model reflects actual visitor behaviour, not a combined figure you then have to manually adjust.
What is the most accurate people counter for Australian retailers in 2026?
The FootfallCam Pro2 is positioned as the benchmark for counting accuracy in the Australian retail market, using overhead 3D stereo vision to distinguish adults, children, and staff members with a high degree of precision. For retailers serious about benchmarking store performance Australia-wide, data integrity at the sensor level is non-negotiable; even a modest systematic error compounds into significant miscalculation when you’re comparing traffic patterns across multiple sites or building forward-looking scheduling models.
How does footfall data integrate with my existing payroll or scheduling software?
FootfallCam V9 Software is designed to integrate with existing Workforce Management tools, so traffic intelligence feeds into the systems your team already uses rather than creating a separate reporting workflow. The platform exports hourly and 15-minute interval traffic data in formats compatible with common scheduling platforms. If you’re running a specific payroll or rostering system, it’s worth discussing your current setup with Footfall Australia directly to confirm the integration pathway that suits your infrastructure.
Is it worth upgrading my old infrared counters to a video-based AI system?
For most retailers, yes. Legacy infrared beam counters can’t distinguish staff from customers, struggle with high-traffic periods when queuing disrupts the sensor field, and frequently undercount during the exact moments when accurate data matters most. Any scheduling or conversion analysis built on that data carries a systematic error that no downstream analysis can correct. Footfall Australia’s Legacy Swap Out Plan manages the transition to Pro2 hardware through a structured process that assesses your existing cabling and mounting infrastructure to reduce installation complexity where possible.
How can I use traffic data to improve my store’s conversion rate?
Conversion rate improvement starts with identifying the gap between visitor volume and transaction volume at a granular level. When you can see that a specific trading window consistently draws high footfall but produces a conversion dip, you’ve identified a staffing or floor coverage problem rather than a product or pricing one. Benchmarking store performance Australia-wide confirms this pattern repeatedly: understaffed peaks produce abandoned purchase decisions that never appear in sales data, because no transaction occurred. Closing that gap with targeted staffing is a direct conversion lever.
Do people counters work in stores with complex layouts or multiple entrances?
Yes, and multi-entry formats are a common configuration for Australian retailers. FootfallCam Pro2 units can be deployed across multiple entry points and internal zones simultaneously, with all data consolidated within the V9 platform to give you a unified view of total traffic and zone-level dwell time. For stores with specific layout challenges, including mezzanine levels or high-volume concourse positions, Footfall Australia offers Pro2 configuration consulting to determine optimal sensor placement before installation begins.
What is the typical ROI for a retail people counting system?
ROI is driven by two compounding factors: operational savings from eliminating labour leakage on overstaffed shifts, and revenue recovered through better floor coverage during peak trading windows. The exact timeline depends on your store’s size, current scheduling inefficiency, and traffic volume, so a single figure wouldn’t be meaningful across different retail formats. What’s consistent is that the dataset grows in value over time; each trading cycle adds historical intelligence that makes forward planning more accurate and every subsequent scheduling decision easier to defend.