Store Layout Optimisation for Australian Retailers
While national retail spending reached $38.63 billion in early 2026, in-store purchases are projected to decline to just 41% of total sales this year. This shift suggests that simply getting people through the door is no longer a guarantee of commercial success. You’ve likely noticed the frustration of seeing steady foot traffic that doesn’t translate into revenue, or watched customers abandon their journey due to congested aisles and confusing dead zones. It’s a common challenge for Australian retailers who rely on intuition rather than evidence. This guide shows you how to implement effective store layout optimisation by replacing guesswork with empirical footfall data. We’ll explore a clear framework for layout redesign using the FootfallCam Pro2 and V9 Software to increase dwell time, improve customer flow, and drive higher conversion rates across your entire floor space.
Key Takeaways
- Identify how psychological anchors like the “Decompression Zone” and the “Right-Hand Rule” influence initial customer engagement and product interaction.
- Adopt a rigorous “Measure, Analyse, Implement, Validate” framework to ensure your store layout optimisation strategy remains responsive to shifting consumer behaviours.
- Utilise pathing metrics and heatmaps to transform underutilised floor space into high-performance zones that maximise customer dwell time.
- Deploy AI-driven sensors and the FootfallCam Centroid to convert existing CCTV into a sophisticated data network that distinguishes between staff and customer movement.
The Science of Retail Movement: Why Layout Optimisation Matters
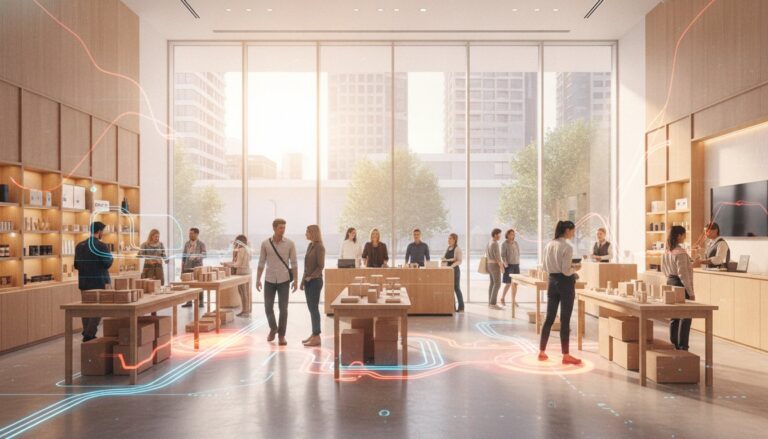
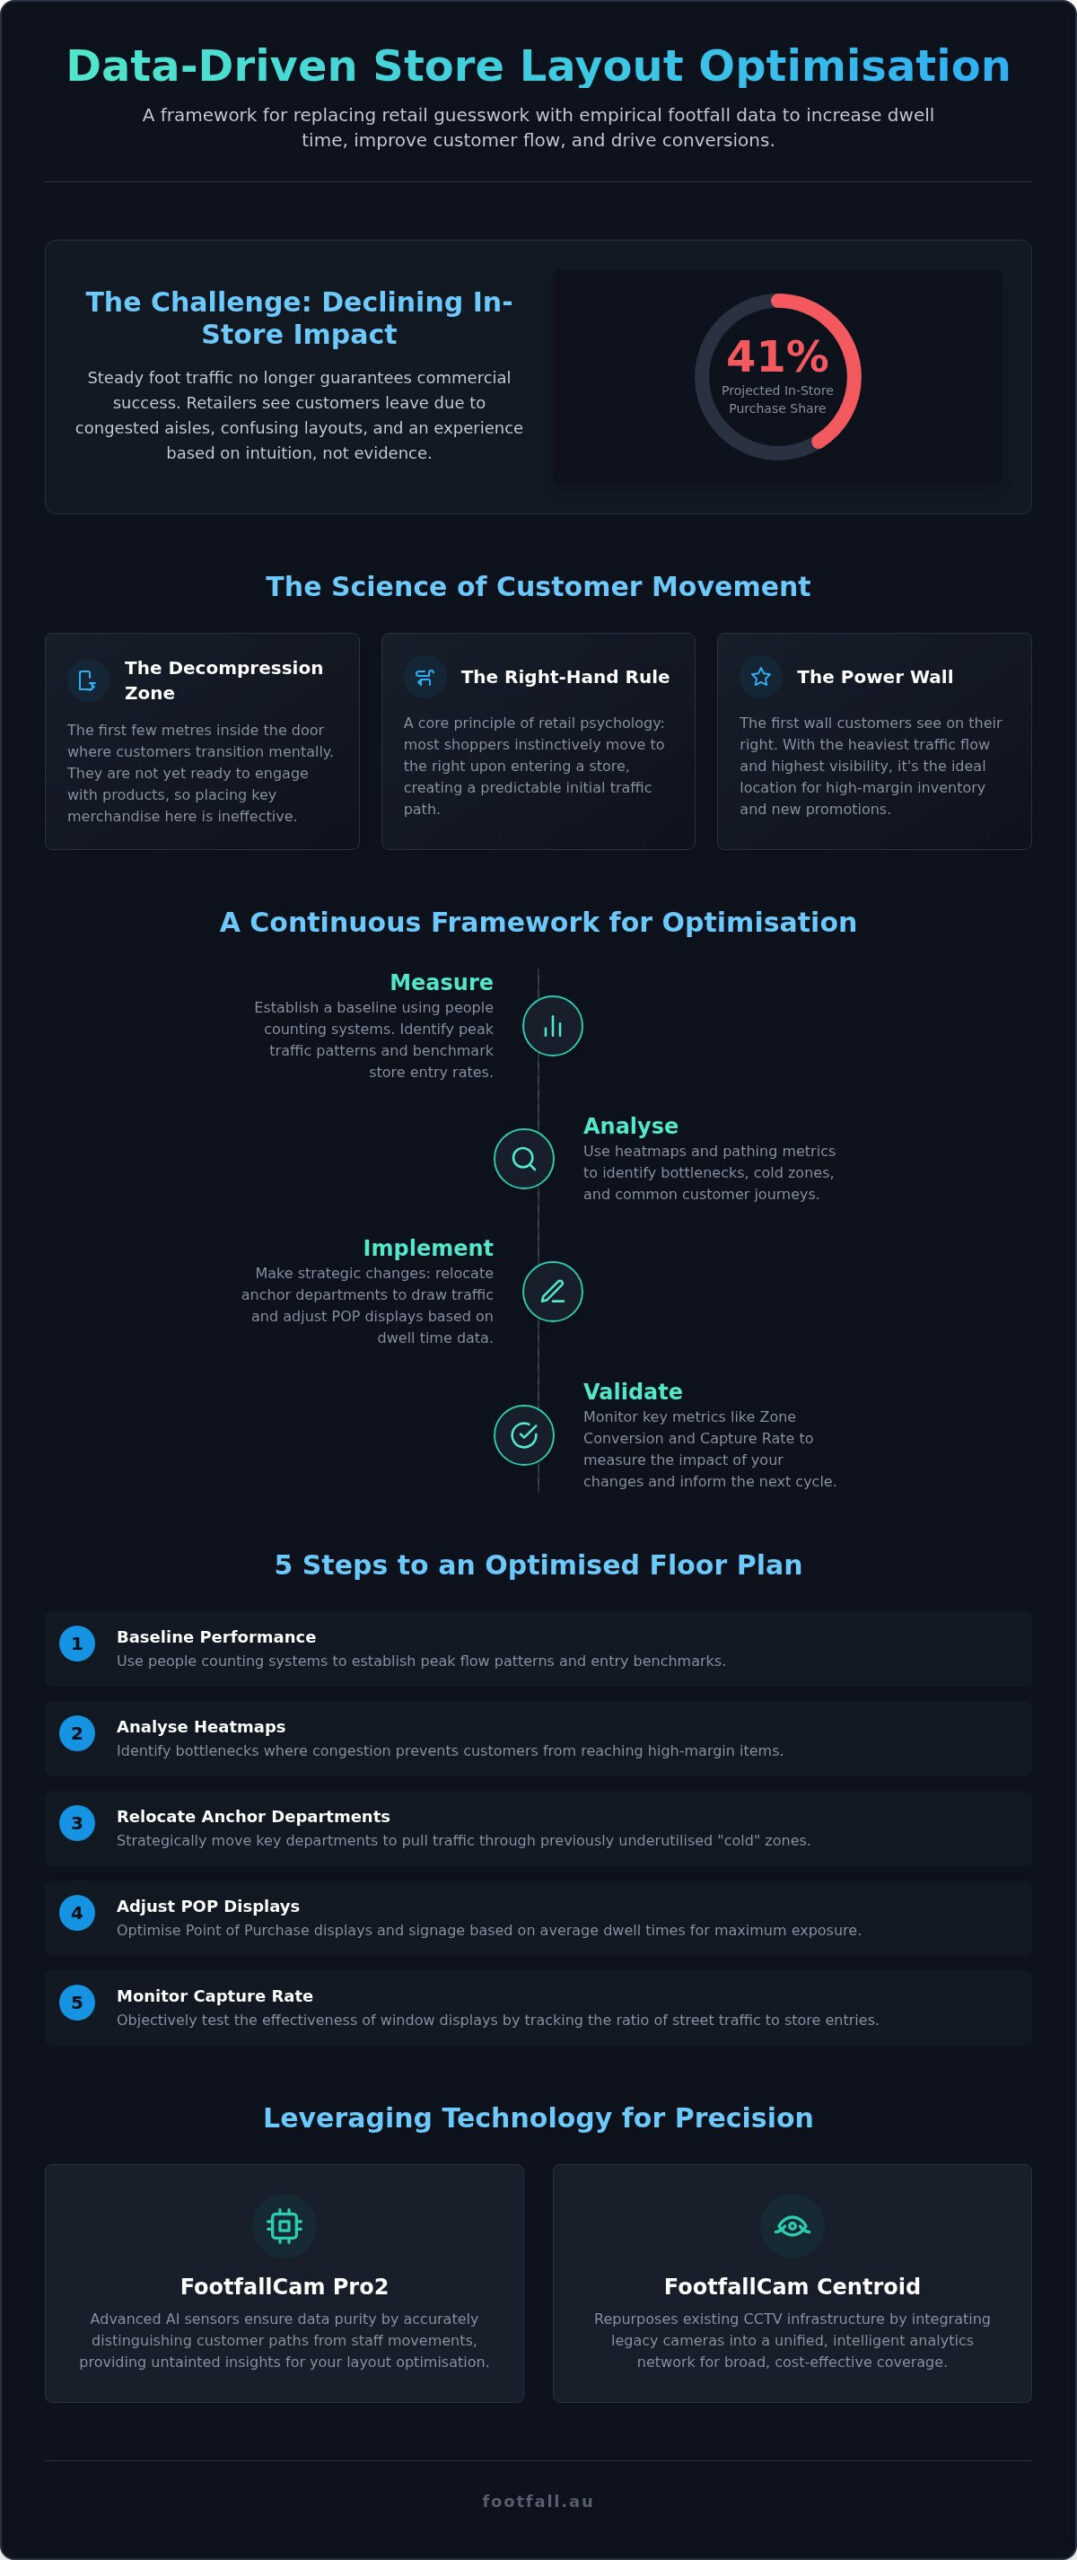
Retail success is rarely accidental; it’s the result of applying The Science of Retail Movement to every aisle. The first few metres of your store, the “Decompression Zone,” serve as a critical mental transition for shoppers. Placing key merchandise or signage here is often a wasted effort, as customers aren’t yet ready to engage with specific products. Once settled, the “Right-Hand Rule” of retail psychology takes over, as most Australians instinctively move to the right. This creates the “Power Wall,” a prime location where traffic flow is heaviest and visibility is highest, making it the ideal spot for high-margin inventory.
Moving beyond intuition-based merchandising is essential for sustained growth. While a manager might feel a specific shelf is performing well, retail footfall analysis Australia offers objective proof of customer behaviour rather than relying on subjective observation. Without rigorous store layout optimisation, poor flow leads to “basket abandonment” and reduced dwell time. Effective layout strategies focus on:
- Reducing friction in high-congestion corridors.
- Increasing dwell time in high-value product zones.
- Eliminating bottlenecks that lead to early store exits.
Identifying High-Traffic Zones and Profitable Dead Spots
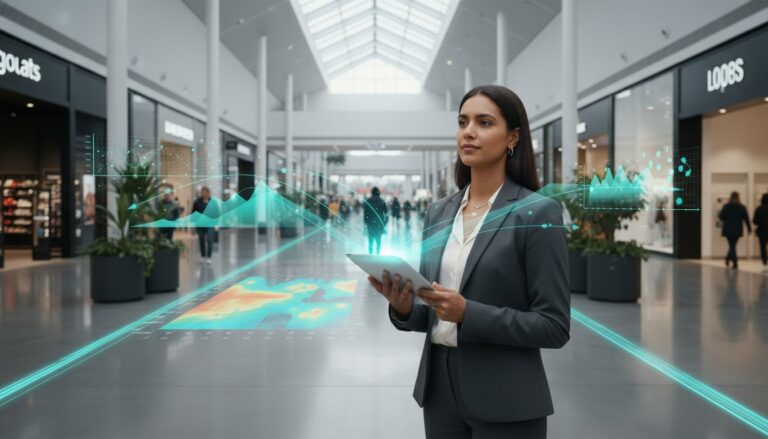
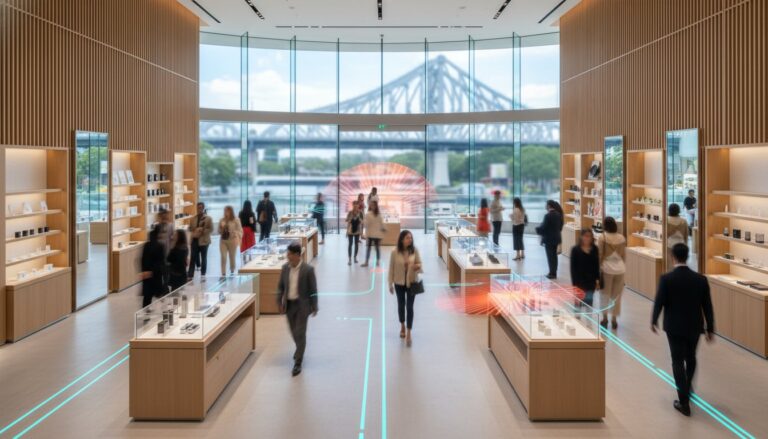
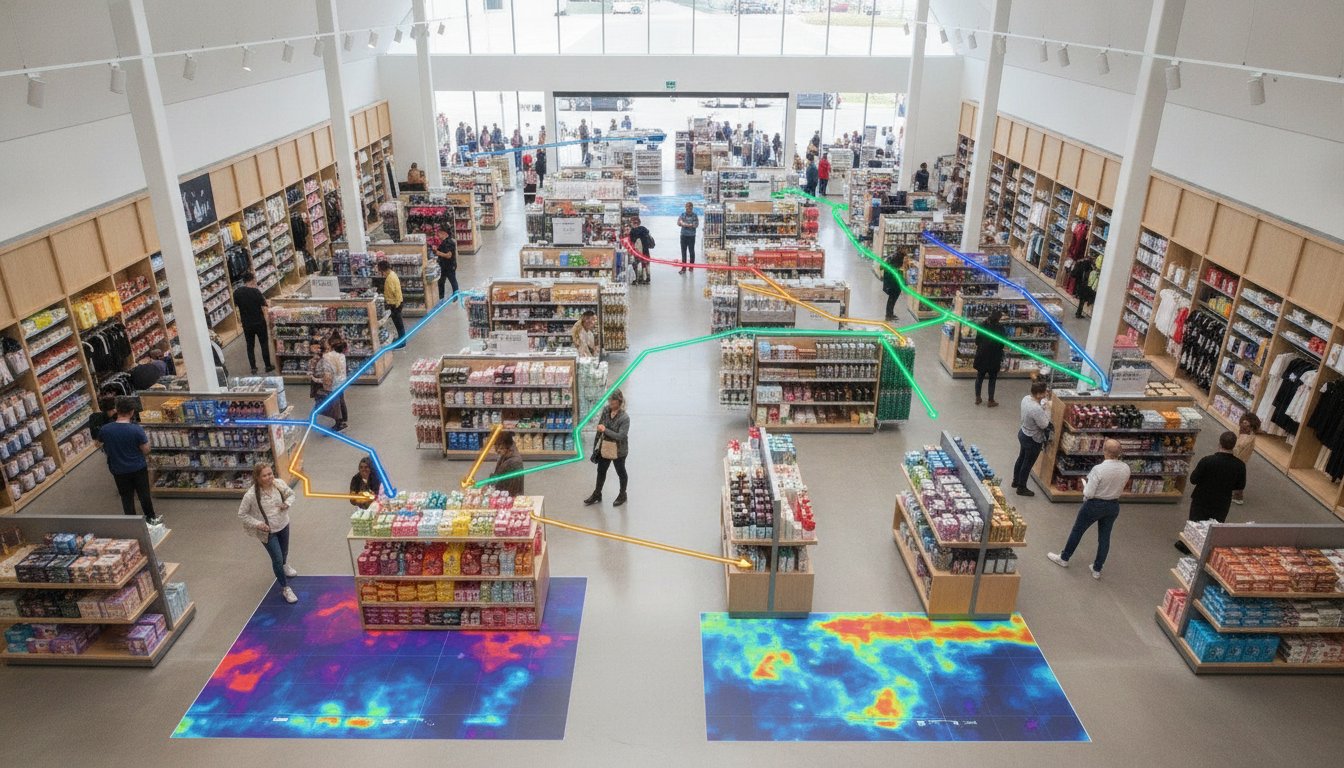
Visualising movement through “Hot Zones” and “Cold Zones” reveals the true efficiency of your floor plan. Hot Zones show where engagement peaks, whereas Cold Zones identify dead spots that customers consistently ignore or bypass. By integrating people counting technology, retailers gain access to real-time heatmaps that distinguish between areas where customers rush and where they linger. Misallocating premium inventory to these low-traffic areas carries a heavy opportunity cost. Data-driven store layout optimisation allows you to reclaim these dead spots, ensuring that every square metre is designed to maximise conversion and enhance the overall shopping experience.
A Strategic Framework for Data-Driven Store Redesign
Effective store layout optimisation requires more than a one-time change; it demands a continuous, iterative cycle of “Measure, Analyse, Implement, and Validate.” At the heart of this framework is the “Pathing” metric. This data point reveals the specific sequence of departments a customer navigates, highlighting the natural logic of their journey. By merging these movement patterns with your existing POS records, you can determine “Zone Conversion Rates,” which quantify the financial productivity of every aisle. Technical precision is vital here. Maintaining clear sightlines and generous aisle widths isn’t just about customer comfort; it ensures high people counting accuracy for AI sensors. Leveraging Technology to Future-Proof Your Retail Space allows management to transition from reactive fixes to proactive, data-led strategy.
Five Steps to Optimising Your Floor Plan
- Step 1: Baseline current performance using people counting systems Australia to establish peak flow patterns and entry benchmarks.
- Step 2: Analyse FootfallCam V9 heatmaps to identify bottlenecks where congestion prevents customers from reaching high-margin items.
- Step 3: Strategically relocate “Anchor Departments” to pull traffic through previously underutilised or “cold” zones.
- Step 4: Adjust “Point of Purchase” (POP) displays and promotional signage based on average dwell times to ensure maximum exposure.
- Step 5: Monitor the “Capture Rate” (the ratio of street traffic to store entries) to objectively test the effectiveness of window displays.
Implementing these changes creates a measurable feedback loop. You can explore our data integration tools to begin mapping your store’s movement patterns with greater precision.
Leveraging Technology to Future-Proof Your Retail Space
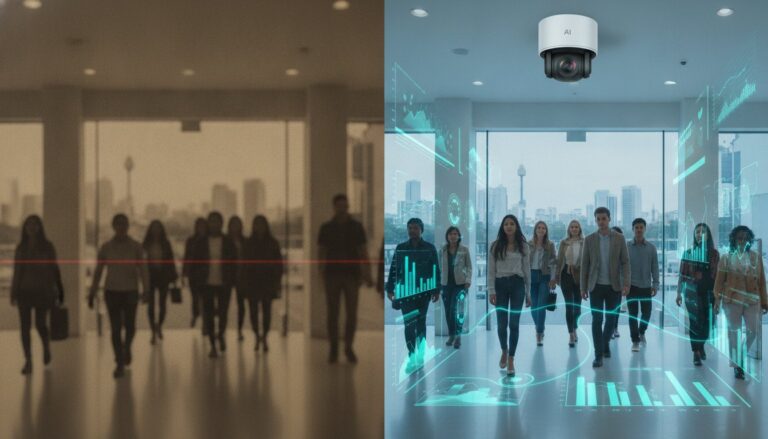
Modern retail environments require high-precision sensors to distinguish meaningful customer interactions from routine operational movement. The FootfallCam Pro2 achieves this through advanced AI, filtering staff paths to ensure the data driving your store layout optimisation is untainted by internal activity. For retailers seeking broader visibility across expansive floor plans, the FootfallCam Centroid repurposes existing CCTV infrastructure, integrating legacy systems into a unified analytics network. This technological layer transforms a static physical space into a dynamic, measurable environment where every movement tells a story.
Maintaining this level of insight requires more than hardware installation. It demands consistent people counter support to recalibrate sensors as fixtures move and traffic patterns evolve. Successful retailers treat layout design as a continuous evolution rather than a one-off project, using empirical evidence to stay ahead of shifting consumer behaviours. This proactive approach ensures that data remains accurate and actionable throughout the lifecycle of the store.
Validating Layout Changes with Real-Time Analytics
Transforming Insights into Floor Plan Performance
Movement within a retail environment is no longer a matter of guesswork. By understanding the psychological drivers behind customer flow and applying a rigorous framework of measurement, you can turn underutilised floor space into high-performing assets. Continuous store layout optimisation ensures your physical environment remains responsive to the evolving habits of the Australian consumer. It’s about translating human behaviour into actionable strategy to improve the overall shopping experience.
Our team provides a national Australian support and installation network to help you deploy these insights with confidence. With the AI-driven accuracy of the FootfallCam Pro2 and the comprehensive V9 analytics suite, you gain the reliable business intelligence needed to drive growth. Optimise your store layout with the FootfallCam Pro2 today and build a retail space that performs with precision. We’re ready to help you navigate the future of physical retail with clarity and confidence.
Frequently Asked Questions
How does a people counter help with store layout?
A people counter provides empirical evidence of how customers navigate your physical space, replacing subjective observations with hard data. By tracking entry counts and zone engagement, devices like the FootfallCam Pro2 allow managers to identify bottlenecks and underutilised areas. This objective insight is essential for effective store layout optimisation, as it highlights which aisles drive engagement and which fixtures obstruct natural movement patterns.
What is the difference between pathing and heatmaps in retail?
Heatmaps visualise the density of activity within specific zones, showing where customers linger or congregate over time. Pathing, however, tracks the sequential journey a shopper takes through various departments. While a heatmap identifies “hot” and “cold” spots on your floor plan, pathing reveals the narrative of movement. This helps you understand the logical flow and the relationship between different product categories.
Can I use my existing CCTV cameras for store layout optimisation?
Yes, you can integrate existing IP cameras into a sophisticated analytics network using the FootfallCam Centroid. This hardware repurposes your current CCTV infrastructure by applying AI processing to the video feed. It allows for wider layout coverage without installing new sensors in every aisle. It’s a cost-effective way to gain granular movement data and heatmaps across expansive retail environments using your legacy hardware.
How often should I review my store layout data?
Data review should be a continuous process rather than an annual event. High-level traffic patterns should be monitored weekly to catch immediate operational issues, while deeper layout performance analysis is recommended quarterly or after any major merchandising shift. This rhythmic approach ensures your space remains responsive to seasonal trends and changing consumer behaviours, allowing for iterative improvements that protect your long-term ROI.