
Presenting Footfall Data to the Board: 2026 Guide
A board of directors doesn’t care about the total number of people who entered a building; they care about how those people influenced the bottom line. Most executive reports fail because they present raw data without a narrative, leading to disengagement and rejected budget requests. Mastering how to present footfall data to the board is about bridging the gap between physical movement and financial performance. You know data should drive decisions, but translating visitor metrics into a clear ROI story remains a significant hurdle.
This 2026 guide provides a framework to transform technical metrics into high-impact executive summaries that justify investments and optimize operational efficiency. You’ll learn to leverage the automated reporting of FootfallCam V9 software to align physical traffic with digital KPIs. We’ll examine how to use accurate FootfallCam Pro2 insights to secure buy-in and drive evidence-based growth across your Australian portfolio.
Key Takeaways
- Connect physical traffic metrics directly to sales conversion rates to provide the board with a clear picture of operational efficiency and revenue potential.
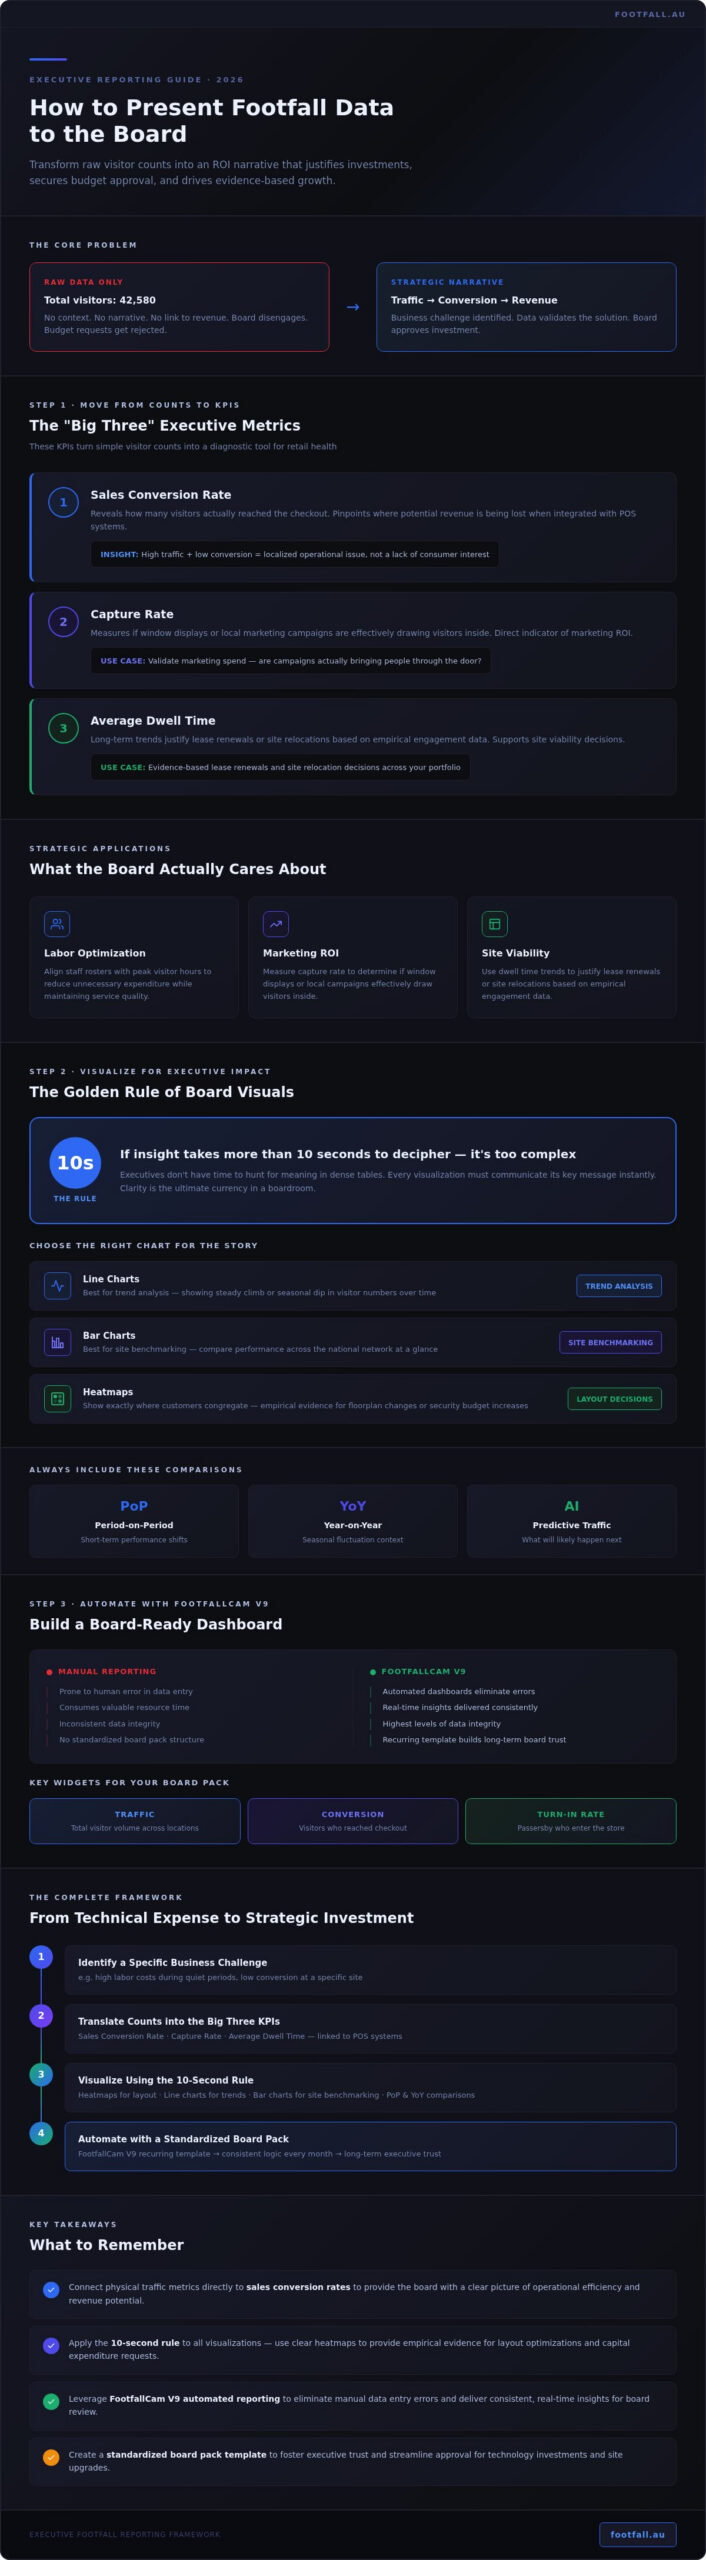
- Apply the 10 second rule to your visualizations; use clear heatmaps to provide empirical evidence for layout optimizations and capital expenditure requests.
- Master how to present footfall data to the board by leveraging FootfallCam V9 software to automate reporting and remove the risk of manual data entry errors.
- Create a standardized board pack template that fosters executive trust and streamlines the approval process for new technology investments or site upgrades.
Framing Footfall as a Strategic Business Driver
Board members prioritize fiscal health and operational efficiency above all else. To master how to present footfall data to the board, you must shift the conversation from volume to value. Raw numbers representing footfall traffic are mere observations; they only become strategic once linked to revenue or cost-saving initiatives. Start your presentation by identifying a specific business challenge, such as high labor costs during quiet periods, then use the data to validate your solution. This approach ensures your metrics serve as a catalyst for action rather than just another slide in the deck.
Moving from Raw Counts to Strategic KPIs
Executive decision-making relies on the “Big Three” metrics: Sales Conversion Rate, Capture Rate, and Average Dwell Time. These KPIs transform simple counts into a diagnostic tool for retail health. By integrating footfall data analysis with your POS systems, you can pinpoint exactly where potential revenue is being lost. It’s about demonstrating how many visitors actually reached the checkout, providing a clear picture of store performance across the national network.
Benchmarking these figures allows the board to identify outliers. If a specific site shows high traffic but low conversion, it signals a localized operational issue rather than a lack of consumer interest. Use these strategic applications to build your case:
- Labor Optimization: Align staff rosters with peak visitor hours to reduce unnecessary expenditure while maintaining service quality.
- Marketing ROI: Measure the capture rate to determine if window displays or local campaigns effectively draw visitors inside.
- Site Viability: Use long-term dwell time trends to justify lease renewals or site relocations based on empirical engagement data.
Mastering how to present footfall data to the board effectively turns a technical expense into a strategic investment.
Visualizing Footfall Trends for Maximum Executive Impact
Clarity is the ultimate currency in a boardroom. When considering how to present footfall data to the board, follow the golden rule of visuals: if an insight takes more than 10 seconds to decipher, it’s too complex. Executives don’t have time to hunt for meaning in dense tables. Instead, use heatmaps to provide immediate, empirical evidence for store layout optimisation. These visual representations show exactly where customers congregate, making the case for floorplan changes or security budget increases undeniable. Highlighting peak hour trends similarly supports arguments for staffing adjustments, ensuring your operational expenditure aligns with actual retail foot traffic trends observed across the industry.
Choosing the Right Visual for the Narrative
Selecting the appropriate chart type is essential for storytelling. Line charts are best for trend analysis, showing the steady climb or seasonal dip in visitor numbers over time. Conversely, bar charts work perfectly for site benchmarking, allowing the board to compare performance across the national network at a glance. Always include Period-on-Period (PoP) and Year-on-Year (YoY) comparisons to contextualize growth and account for seasonal fluctuations.
Modern reporting has evolved beyond historical data. AI-driven insights now allow you to present predictive traffic patterns, moving the conversation from what happened to what will likely happen next. This forward-looking approach positions you as a strategic partner. To ensure your hardware supports these advanced analytics, you might consider the FootfallCam Pro2 for high-accuracy data capture. By using these tools, you transform a simple report into a roadmap for future success.
Leveraging FootfallCam V9 for Automated Board Reporting
Automated reporting is the final step in mastering how to present footfall data to the board. Manual data entry is prone to human error and consumes valuable resource time. FootfallCam V9 software eliminates these risks by providing automated dashboards that deliver consistent, real-time insights. By standardizing your “Board Pack” with a recurring template, you build long-term trust with directors who come to rely on the same structured logic every month. If your current systems are outdated, the Legacy Swap Out Plan offers a strategic path to upgrade your infrastructure. This plan ensures the data you present maintains the highest levels of integrity for executive review.
Building a Professional Board-Ready Dashboard
Creating a high-impact presentation starts with selecting the right widgets within the V9 environment. Focus on high-level metrics like Traffic, Conversion, and Turn-in Rate to provide a comprehensive view of retail health. The software allows you to export high-resolution charts directly into PowerPoint or PDF formats, ensuring your director packs remain polished and professional. This automation saves hours of manual preparation, allowing you to focus on the strategic narrative rather than spreadsheet formatting.
True executive confidence stems from the reliability of the underlying people counting technology. Relying on estimates or legacy hardware can undermine your credibility during critical budget discussions. By deploying the AI-driven FootfallCam Pro2, you ensure that every decision the board makes is backed by empirical facts. This level of technical integrity is what separates a standard report from a strategic business case, providing the quiet confidence needed to drive organizational change across the Australian market.
Elevating Your Executive Reporting Standards
Transforming visitor metrics into strategic assets requires a shift from reporting volume to demonstrating value. You now understand that mastering how to present footfall data to the board involves linking physical traffic to sales conversion and operational savings. By utilizing high-impact visuals and the automated reporting capabilities of FootfallCam V9, you’ll eliminate manual errors and build long-term executive trust.
Footfall Australia has been a trusted partner for Australian retailers since 2004, providing AI-powered accuracy through the FootfallCam Pro2 and seamless POS integration. It’s this technical foundation that ensures your board-level decisions are always rooted in empirical evidence. Book a demo of the FootfallCam V9 Software to see our board-ready reporting in action. Start your journey toward more impactful, evidence-based leadership today.
Frequently Asked Questions
How often should footfall data be presented to the board?
Footfall data should be presented monthly to provide a consistent pulse on operational health. This frequency allows directors to observe seasonal shifts and the impact of recent marketing campaigns. For larger strategic planning, a deep-dive quarterly review is recommended. This schedule ensures the board remains informed about traffic trends without becoming overwhelmed by short-term fluctuations or minor data noise.
What is the most important footfall metric for a retail board?
The sales conversion rate is the most critical metric for a retail board. It directly links visitor volume to revenue, providing an empirical measure of store performance and staff effectiveness. While raw traffic volume indicates brand reach, conversion tells the true story of retail health. Presenting this metric helps you master how to present footfall data to the board in a way that justifies operational expenditure.
How do I explain a sudden drop in footfall to the directors?
Explain a sudden drop by contextualizing the data with external factors like local infrastructure changes or broader economic shifts. Use FootfallCam Pro2 data to show if the drop is localized or network-wide. If conversion remains stable despite lower traffic, you can reassure the board that the store is still performing well with the visitors it receives. This approach focuses on objective analysis rather than speculation.
Can footfall data help in justifying a lease renewal or store closure?
Footfall data provides the empirical evidence needed to justify significant real estate decisions. By analyzing long-term traffic trends and dwell times, you can demonstrate a site’s future revenue potential or lack thereof. If a location shows a persistent decline in capture rates, it provides a logical foundation for store closure. Conversely, strong traffic growth supports a confident case for lease renewals across your national portfolio.