Retail Foot Traffic KPIs: The Essential Monthly Review Checklist for 2026
Your point-of-sale registers record every completed transaction, but they remain completely blind to the prospective buyers who walked out empty-handed. Tracking the right retail foot traffic KPIs changes that dynamic, transforming physical movement into actionable operational intelligence. You likely already know the frustration of reviewing monthly revenue reports without knowing whether an underperforming store suffered from weak pedestrian footfall, misaligned staffing rosters during unexpected traffic surges, or window displays that failed to pull shoppers through the door.
Mastering these essential retail footfall metrics empowers you to evaluate store performance accurately, diagnose conversion bottlenecks, and drive data-backed growth across every trading period. Here is your structured monthly review checklist for 2026, providing the exact framework required to benchmark physical locations, optimise floor coverage, and capture missed revenue across your network.
Key Takeaways
- Master the core retail foot traffic KPIs, including storefront capture rate, to separate external pedestrian volume from internal merchandising performance.
- Implement a structured monthly review framework covering customer acquisition, dwell time engagement, and operational labour efficiency.
- Diagnose hidden conversion drops by auditing shopper-to-associate ratios against high-traffic trading windows.
- Standardise performance benchmarks across your store network to evaluate physical locations on empirical visitor data rather than top-line revenue alone.
Core Retail Foot Traffic KPIs: The Top-of-Funnel Foundation
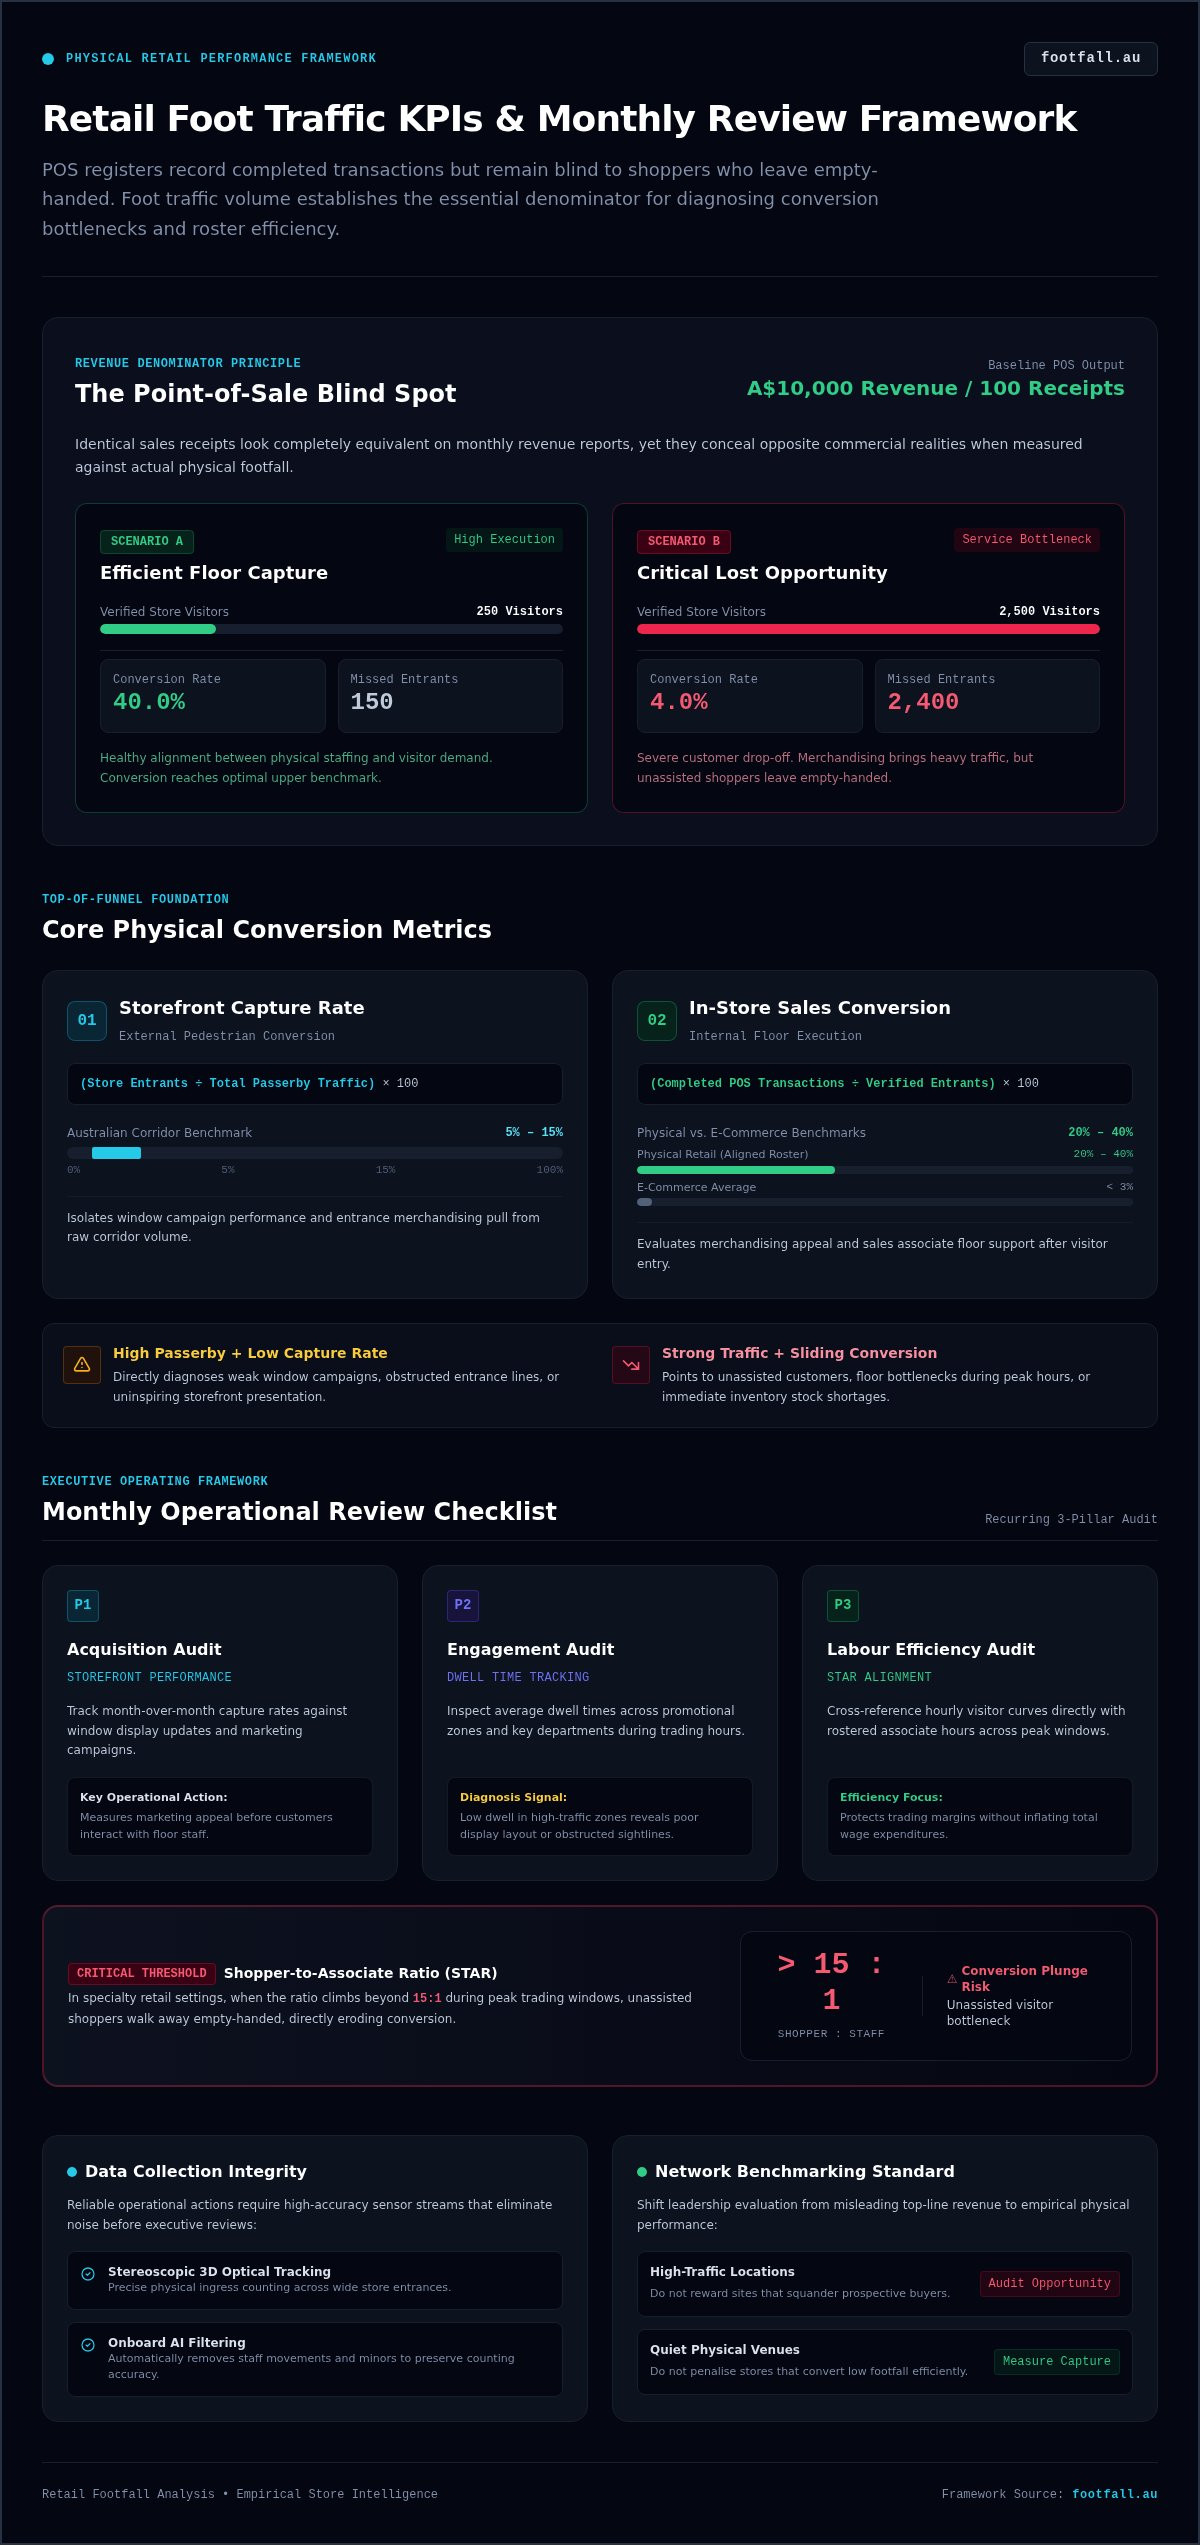
Sales revenue records completed transactions, but it reveals nothing about lost opportunity. When a store generates A$10,000 across 100 sales receipts, that total looks identical whether 250 or 2,500 people visited the store. Evaluating performance solely through point-of-sale figures blinds retail leadership to actual footfall demand. To evaluate true commercial performance, foot traffic volume serves as the essential denominator for physical retail intelligence.
Tracking the relationship between passing pedestrian volume and physical store entries separates marketing appeal from sales floor execution. Without this boundary, operators routinely misdiagnose weak sales as merchandising failures when low corridor footfall is the real culprit.
Defining Capture Rate and Storefront Conversion
Establishing clarity across physical conversion metrics begins with two foundational retail foot traffic KPIs:
- Storefront Capture Rate: Calculated as (Store Entrants / Total Passerby Traffic) × 100. Benchmarks for Australian retail corridors typically range between 5% and 15%. This metric isolates the visual pull of window campaigns and entrance merchandising.
- In-Store Sales Conversion Rate: Formulated as (Completed POS Transactions / Verified Entrants) × 100. While e-commerce averages under 3%, physical retail benchmarks typically land between 20% and 40% when floor staffing aligns with visitor flow.
Applying the core principles outlined in retail footfall analysis Australia ensures that external footfall shifts are never confused with internal operational friction. High passerby counts paired with poor capture point directly to ineffective window displays, whereas strong foot traffic paired with sliding conversion rates highlights unassisted shoppers or stock shortages on the floor.
The Monthly Business Review Checklist for Retail Traffic Metrics
Monthly executive meetings often collapse into post-mortem debates over sales variances. Structuring these reviews around core retail foot traffic KPIs shifts the discussion from subjective intuition to precise operational diagnosis. A disciplined monthly review evaluates three distinct operational pillars: customer acquisition, in-store engagement, and labour efficiency.
Auditing hourly traffic curves alongside transaction volumes highlights exactly where your stores lost revenue. If footfall surges while conversion rates plunge, you don’t have a merchandise problem; you have an unassisted customer bottleneck on the sales floor.
Step-by-Step Monthly Operational Review Metrics
- Acquisition Audit: Compare month-over-month capture rates against window changes and marketing campaigns to measure storefront effectiveness.
- Engagement Audit: Inspect average dwell times across promotional zones and key departments. Abnormally low dwell times in high-traffic paths signal poor product presentation or obstructed sightlines.
- Labour Efficiency Audit: Cross-reference hourly visitor counts with rostered associate hours. Calculate the shopper-to-associate ratio (STAR) across peak windows. When this ratio climbs beyond 15:1 in specialty settings, unassisted shoppers walk away empty-handed, directly eroding conversion during your busiest trading periods.
Aligning floor rosters to verified footfall distributions protects trading margins without inflating total wage expenditures. Implementing these recurring audits through advanced foot traffic monitoring equips management teams with the objective clarity required to roster floor teams effectively and resolve store layout friction.
Translating Foot Traffic Insights into Operational Retail Actions
Data delivers commercial value only when it produces concrete operational adjustments. Integrating high-accuracy sensor streams into systematic footfall data analysis bridges the divide between physical presence and bottom-line growth. Reliable operational decisions demand dependable data inputs. Deploying enterprise hardware like FootfallCam Pro2 People Counters provides stereoscopic 3D optical tracking with onboard AI filtering, removing staff movements and minors to preserve counting integrity.
With precise ingress data established, retail leaders can standardise performance benchmarks across an entire national store network. Instead of rewarding high-traffic sites that squander prospective buyers or penalising quiet locations that convert efficiently, leadership can objectively evaluate physical venues on empirical sales capture.
Automating Traffic Audits and Executive Reporting
Centralised platforms eliminate the administrative drag of manual spreadsheets. Integrating entry sensors with existing POS transaction records via FootfallCam V9 Software automates the calculation of essential retail foot traffic KPIs across every trading hour.
- Automated Anomaly Alerts: Set instant notifications for sudden shifts in conversion efficiency, alerting area managers to layout friction or understaffing in real time.
- Network Benchmarking Dashboards: Consolidate multi-site performance into standardised executive reporting, streamlining monthly business reviews with clear, defensible metrics.
This automated cadence ensures operational decisions regarding visual merchandising, stock replenishment, and staffing allocations remain consistently grounded in empirical store evidence.
Transform Your Monthly Store Reviews into Data-Backed Growth
Relying purely on transaction receipts leaves your business vulnerable to unseen operational friction. By evaluating core retail foot traffic KPIs across customer acquisition, dwell engagement, and sales floor coverage, you transform monthly reviews from reactive discussions into strategic diagnostics. You can pinpoint underperforming display windows, resolve staffing shortages before they erode conversion, and establish objective benchmarks across your store network.
Operating across Australia since 2004, Footfall Australia pairs high-precision 3D optical hardware with FootfallCam V9 Software to automate multi-store reporting and remove administrative guesswork. Discover how FootfallCam systems streamline your retail KPIs and empower your management team with defensible, empirical intelligence every trading month.
Frequently Asked Questions
How do retail foot traffic KPIs differ from traditional sales metrics?
Traditional sales metrics capture only completed transactions, leaving management blind to unassisted shoppers or lost buying opportunities. Incorporating retail foot traffic KPIs introduces top-of-funnel denominators like passerby traffic and physical footfall. This separation reveals whether fluctuating revenue stems from external footfall shifts or internal store conversion friction.
What is an acceptable sales conversion rate for physical retail stores?
Physical retail conversion rates generally land between 20% and 40%, depending on the specific retail sector. Specialty apparel retailers often operate between 15% and 30%, whereas grocery and mass retailers achieve 20% to 40%. Department stores typically average between 10% and 20% due to higher casual footfall.
Can people counting sensors accurately differentiate between staff and browsing customers?
Yes, modern 3D optical hardware isolates employees from genuine store visitors. Systems like FootfallCam Pro2 People Counters use onboard AI tracking alongside Bluetooth Low Energy badges or lanyard exclusion to filter out staff sweeps. They also apply height thresholds to exclude small children from commercial conversion calculations.
How do I calculate the storefront capture rate for my retail location?
Calculate capture rate by dividing total store entrants by external passerby traffic, then multiplying by 100. For Australian high-street and shopping centre locations, standard capture rates typically range from 5% to 15%. This calculation serves as a primary retail foot traffic KPI to evaluate window displays and front-of-house merchandising draw.