Student Traffic Flow Analysis: Optimising Campus Efficiency in 2026
Campus spatial efficiency is a data problem, not just an architectural one. You’ve likely witnessed the friction of overcrowded lecture halls or the inefficiency of maintenance teams cleaning empty corridors while other zones reach capacity. It’s frustrating to manage high-traffic environments when you’re relying on intuition rather than hard evidence. We understand that your goal is to create a seamless environment where students feel safe and resources are used with maximum utility. This guide explores how student traffic flow analysis serves as the foundation for modern campus management, moving beyond guesswork to provide a clear picture of how your space actually functions.
You’ll learn how data-driven insights from the FootfallCam Pro2 and V9 analytics software can transform your approach to safety and resource allocation. We’ll discuss how to identify peak usage times, optimize cleaning schedules, and gather the empirical evidence required for future infrastructure funding. This article provides a strategic overview of how precise movement metrics lead to better student experiences and more efficient operations in 2026. By shifting your focus to the narrative of human movement, you can ensure your campus stays prepared for evolving behavioral trends.
Key Takeaways
- Transition from intuition-based planning to a data-driven spatial discipline that accurately reflects how your campus is used.
- Discover why AI-powered sensors provide the precision required for student traffic flow analysis, far exceeding the capabilities of traditional CCTV.
- Maximise operational efficiency by aligning cleaning, maintenance, and staffing schedules with actual peak usage periods.
- Gather the empirical evidence needed to justify infrastructure funding and facility expansions based on verified over-utilisation metrics.
- Learn how to select the right hardware and software to future-proof your campus environment for shifting student behaviours.
What is Student Traffic Flow Analysis in 2026?
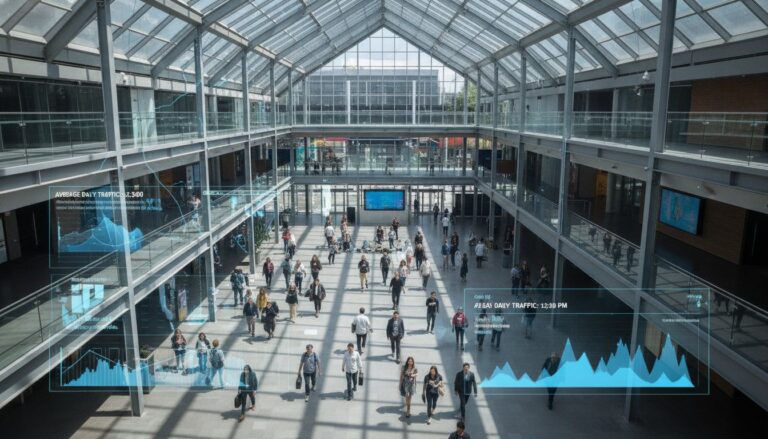
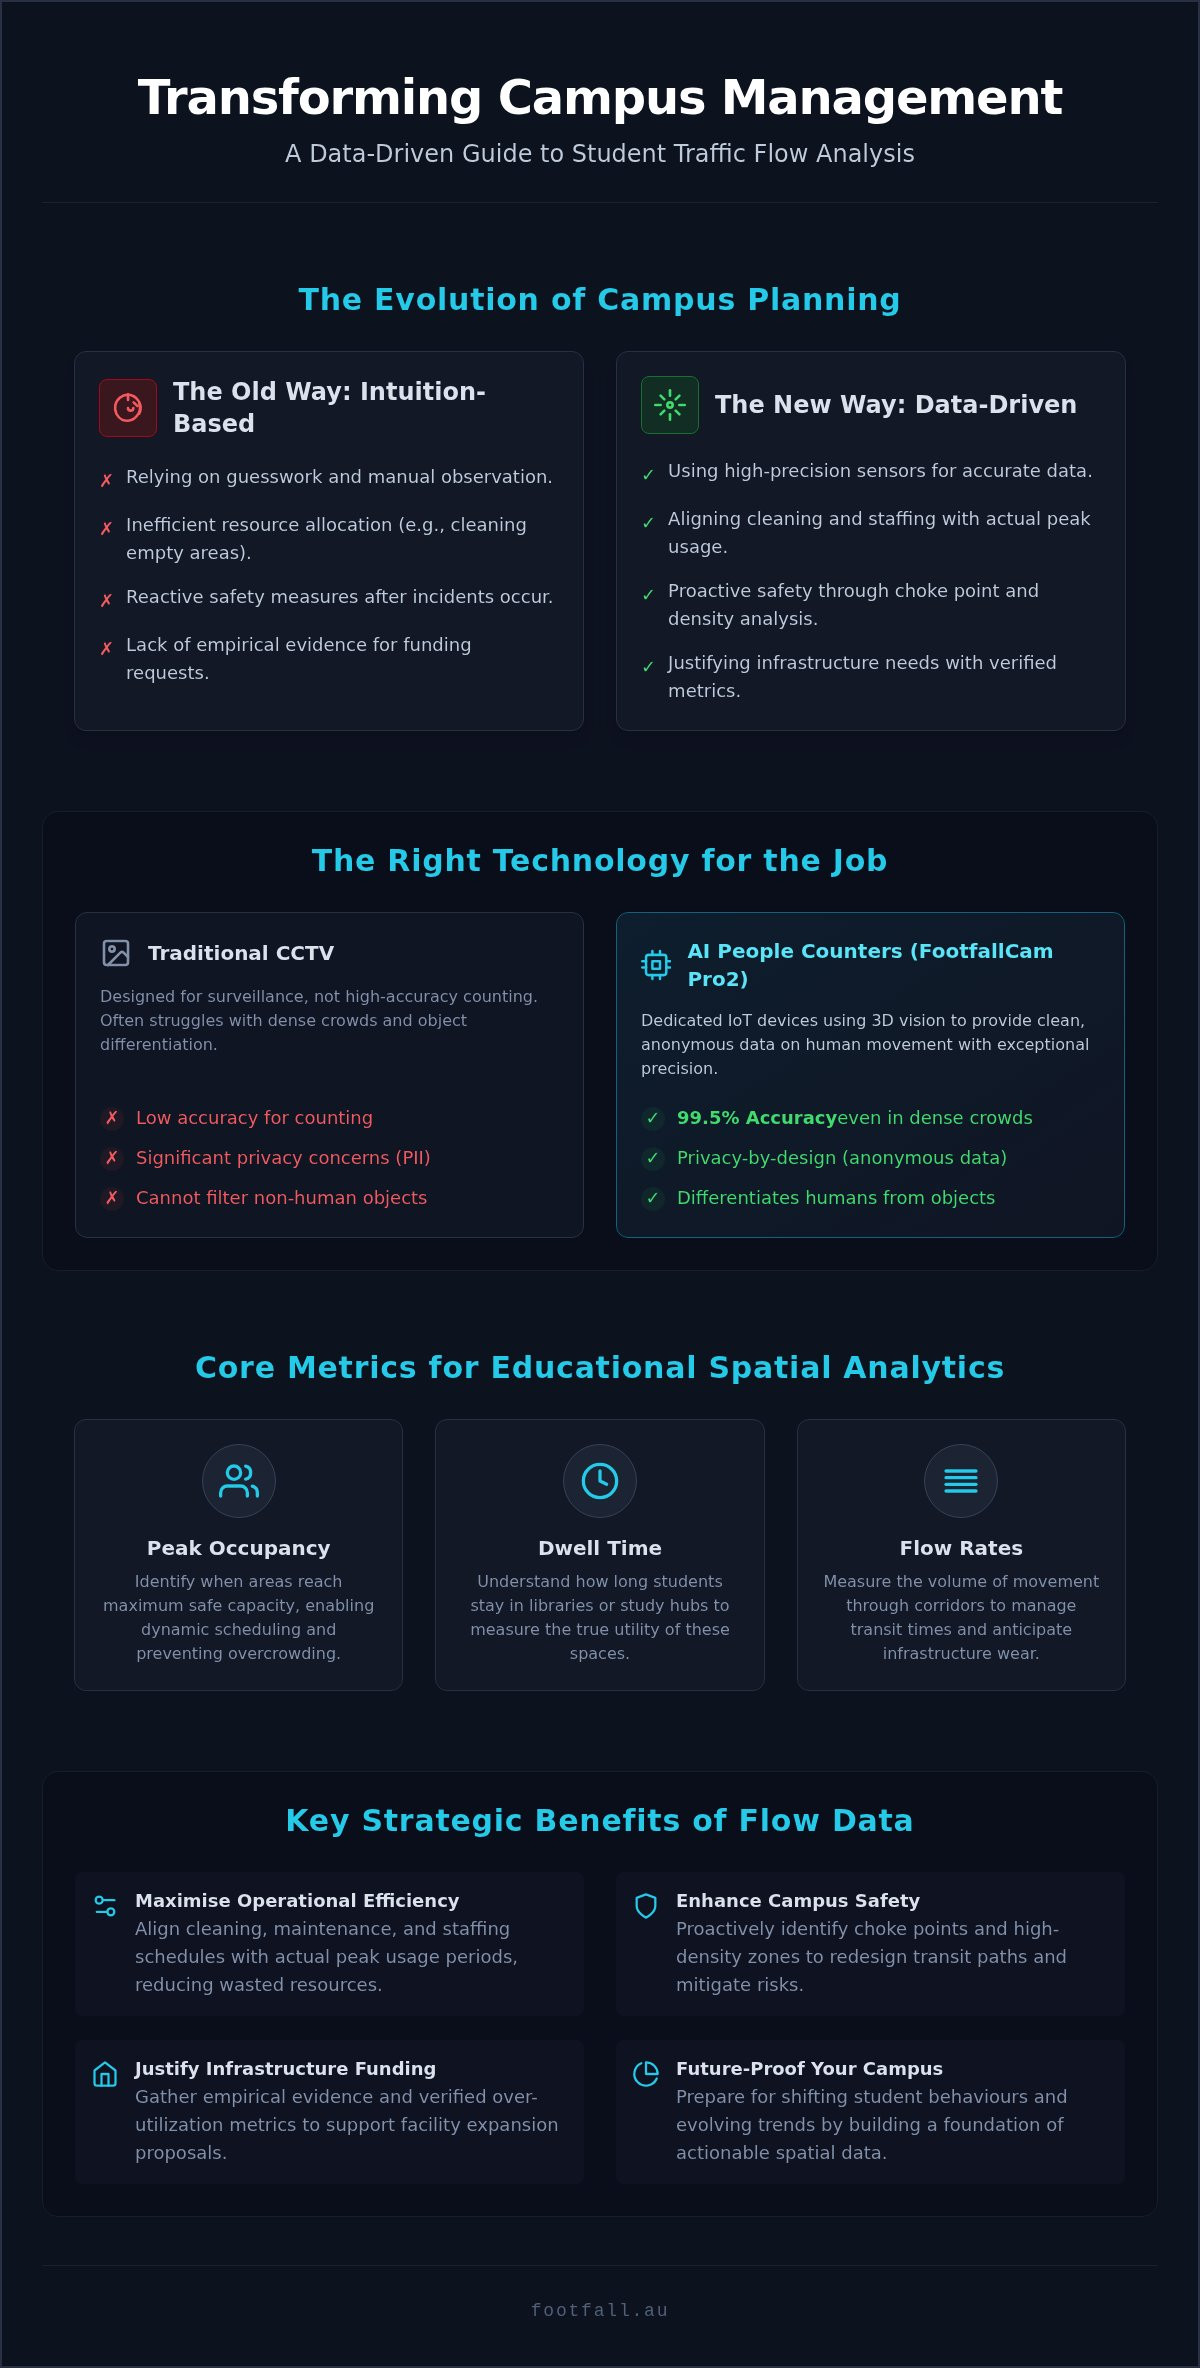
In 2026, student traffic flow analysis has evolved from a simple administrative task into a sophisticated spatial data discipline. It represents a systematic approach to understanding how students interact with the physical campus environment. Traditional methods often relied on manual observations or gut feelings about which areas were busy. However, intuition-based planning is becoming obsolete as modern education demands higher levels of accountability and efficiency. Today, facility managers use high-precision sensors like the FootfallCam Pro2 to capture a comprehensive narrative of movement, rather than just isolated numbers.
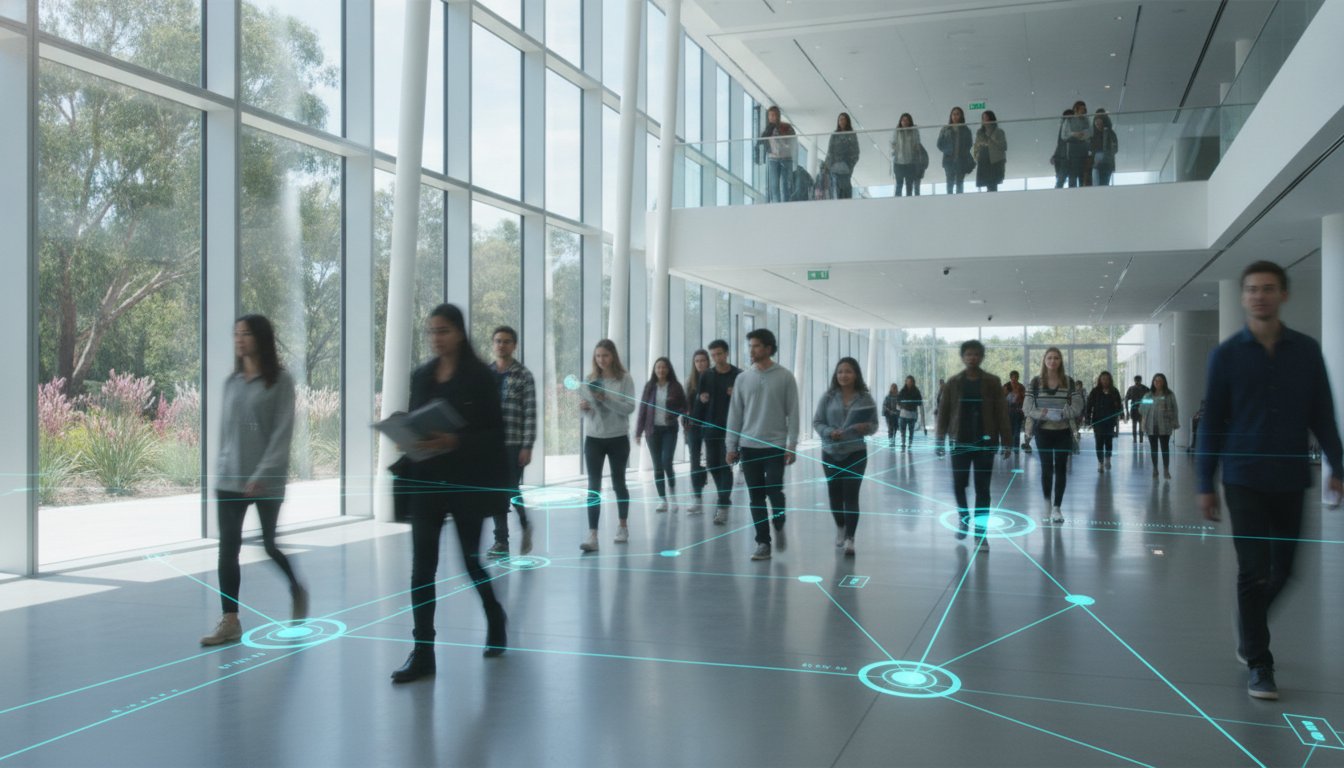
This transition shifts the focus from basic headcounting to deep path and dwell analysis. It’s no longer enough to know how many people entered a building. Strategic experts now examine where students linger, which routes they prefer, and where bottlenecks occur. This data bridges the gap between facility management and student experience. It ensures that every square metre of a campus serves a specific, measurable purpose. By interpreting physical presence as a sequence of human actions, institutions can align their physical assets with actual student behaviour.
Key Metrics in Educational Spatial Analytics
Effective spatial analytics rely on several core variables that mirror the fundamentals of traffic flow such as speed, volume, and density. These metrics provide the empirical evidence needed for growth:
- Peak occupancy: This identifies the exact moments when lecture halls or common areas reach their maximum safe capacity, allowing for dynamic scheduling.
- Dwell time: Understanding how long students stay in libraries or study hubs reveals the true utility of these spaces and helps in resource allocation.
- Flow rates: Measuring the volume of movement through corridors helps managers anticipate wear and tear on infrastructure and manage transit times.
The Role of Data in Campus Safety
The Technology Behind Modern Student Movement Analysis
The shift toward data-driven campus management relies heavily on the quality of the hardware deployed. Traditional methods, such as manual counting or basic infrared beams, lack the precision required for complex student traffic flow analysis. Even existing CCTV systems often fall short. While security cameras are excellent for surveillance, they’re not designed for the high-frequency, high-accuracy processing needed to distinguish between a student and a trolley. CCTV also raises significant privacy concerns, whereas dedicated sensors process data locally to ensure complete anonymity.
Privacy-by-design is a non-negotiable standard in 2026. Educational institutions must adhere to strict regulations like the Australian Privacy Principles (APP) and GDPR. Modern sensors avoid capturing personally identifiable information (PII) by converting human movement into anonymous digital coordinates. This methodology provides a comprehensive view of modern student movement analysis without compromising individual rights. Integrating these sensors with cloud-based platforms allows for real-time reporting that helps facility managers respond to live conditions as they happen.
AI People Counters: The FootfallCam Pro2 Standard
Achieving 99.5% accuracy in dense crowds requires more than simple motion detection. The FootfallCam Pro2 is a dedicated IoT device designed for campus-wide deployment, utilizing 3D stereoscopic vision to perceive depth. This technology allows the sensor to differentiate between humans and inanimate objects like cleaning equipment or delivery trolleys. It ensures that your metrics reflect actual student behaviour rather than background noise. By filtering out non-human movement, the system provides a clean dataset that’s essential for making informed infrastructure decisions.
Software Integration with FootfallCam V9
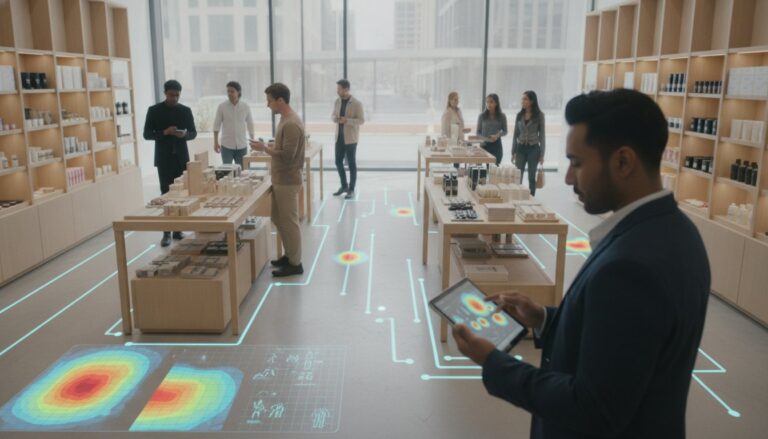
Hardware is only half the equation. The raw data captured by sensors must be translated into actionable intelligence through sophisticated software. The FootfallCam V9 platform turns these counts into visual heatmaps and dynamic flow charts. Facility managers use these tools to identify underutilised zones or high-pressure areas that require immediate attention. The V9 software is essential for any comprehensive student traffic flow analysis, as it provides the automated reporting features needed for executive board updates. For a deeper look at how to use these metrics, consult our guide on Footfall Data Analysis. You can explore how these integrated systems scale across large campuses by visiting Footfall Australia.
Strategic Benefits: Why Educational Institutions Need Flow Data
Data transforms campus management from a reactive struggle into a proactive strategy. While the hardware provides the metrics, the true value lies in how this information reshapes operational logic. Many institutions still rely on static schedules for essential services, leading to wasted resources in empty wings while high-traffic zones suffer. Implementing a rigorous student traffic flow analysis allows facility managers to align their operations with the actual rhythm of the student body. This shift ensures that every dollar spent on maintenance, energy, and staffing is backed by empirical evidence of need.
Operational efficiency extends beyond simple cost-cutting. It’s about enhancing the environment where students live and learn. For instance, commercial zones on campus, such as dining halls and retail outlets, thrive when managers understand peak transit times. By analysing movement patterns, universities can optimise tenant placement and service hours to match student demand. This data-driven approach also supports sustainability goals. Integrating occupancy data with building management systems allows for the dynamic adjustment of HVAC and lighting, significantly reducing energy waste in under-utilised lecture theatres or laboratories.
Resource and Staffing Optimisation
Data-Driven Campus Design
Future-proofing a campus requires a deep understanding of natural human behaviour. When planning a campus pedestrianization strategy, historical flow data is indispensable. It allows architects to test the effectiveness of new walkway layouts or building entrances before construction begins. By observing natural student paths, planners can create more intuitive navigation systems that reduce congestion. A comprehensive student traffic flow analysis provides the necessary justification for infrastructure funding, proving facility over-utilisation with hard numbers rather than anecdotal reports. This objective foundation ensures that future building expansions are designed to solve real-world bottlenecks, creating a more seamless and efficient campus environment.
Implementing a Student Traffic Analysis Strategy
Implementing a successful strategy for student traffic flow analysis requires a structured approach that balances technical precision with operational goals. You don’t need to instrument every square metre of the campus simultaneously. Instead, start by defining the scope. Focus on high-traffic zones and critical entry points where congestion is most visible. Choosing between wired (Power over Ethernet) and Wi-Fi enabled sensors often depends on your existing infrastructure. Wired connections offer the highest stability for permanent installations, while Wi-Fi options provide flexibility for temporary studies or heritage buildings where cabling is restricted.
Pilot testing is a vital step in the implementation process. Running a trial in a single building, such as the main library or a student service hub, allows you to calibrate the system and verify data accuracy before a wider rollout. Once the hardware is in place, data integration becomes the priority. Connecting flow data directly with your facility management systems ensures that insights lead to immediate action. This isn’t a “set and forget” project; continuous improvement involves reviewing analytics quarterly to adjust your campus strategy based on shifting student behaviours.
Selecting Optimal Sensor Locations
Entry and exit points are merely the beginning of a comprehensive flow analysis. To truly understand movement, you must monitor internal transition zones and common areas where students dwell. If you already have an extensive security network, technology like the FootfallCam Centroid can repurpose existing campus cameras into AI-powered counting tools. This approach maximises your current investment while providing the granular data needed for spatial optimisation. For detailed technical specifications on sensor placement, refer to our People Counting Technology Guide.
Managing Privacy and Stakeholder Expectations
Transparency is essential when introducing new technology to an educational environment. You should clearly communicate to the student body that the system collects strictly anonymised data. Ensuring compliance with the Australian Privacy Principles (APP) is not just a legal requirement but a foundation for building trust. When presenting findings to executive boards, avoid technical jargon. Focus on result-oriented formats that highlight how the data reduces costs or improves safety. If you’re ready to design an implementation plan tailored to your institution, contact the experts at Footfall Australia to discuss your requirements.
Future-Proofing Your Campus with Footfall Australia
Selecting a partner for campus-wide spatial analytics requires more than just hardware procurement. It demands a collaborator with a deep understanding of the Australian educational landscape. Footfall Australia has been a strategic leader in the people counting market since 2004, providing the expertise needed to turn movement into actionable intelligence. We offer an end-to-end solution that encompasses everything from proprietary AI hardware to sophisticated V9 analytics software. This comprehensive approach ensures that your student traffic flow analysis remains accurate, reliable, and relevant as your campus evolves.
Modernising a large-scale environment often involves navigating existing infrastructure. Our Legacy Swap Out Plan allows institutions to upgrade outdated sensors to the latest FootfallCam Pro2 technology without the friction of a total system overhaul. This transition is supported by our national network of local partners, ensuring that installation and technical support are always accessible. By choosing a partner with two decades of local experience, you gain the quiet confidence that your spatial data decisions are backed by a foundation of empirical success.
Comprehensive Support and Maintenance
Data is only valuable if it remains consistent and accurate over the long term. Footfall Australia provides tailored support structures to meet the specific needs of educational institutions. Our Basic and Premium Support Plans offer varying levels of engagement, but both prioritise the utility of your information. We conduct remote health checks to ensure 99% data integrity, identifying potential issues before they impact your reporting. For campuses with unique requirements, we provide custom software configurations in the V9 platform, allowing you to generate reports that align perfectly with your internal KPIs and executive board expectations.
Taking the Next Step
The transition to a data-driven campus begins with a clear understanding of your current spatial performance. Requesting a campus-wide spatial audit allows our specialists to identify high-priority zones and recommend the most efficient hardware placement. Whether you’re planning a new building or optimising existing facilities, our team provides the strategic consulting required for large-scale infrastructure projects. This proactive approach ensures that your student traffic flow analysis serves as a reliable guide for the future of your institution. Contact Footfall Australia for a tailored student traffic analysis solution.
Leading the Evolution of Campus Management
Transforming your campus into a high-efficiency environment requires a shift from observational guesswork to empirical certainty. By integrating student traffic flow analysis into your operational strategy, you gain the clarity needed to optimise staffing, enhance safety, and justify future infrastructure investments. We’ve explored how dedicated AI-powered sensors provide the precision required to interpret human movement as a sequence of actionable insights rather than just static figures. This transition ensures your facilities are prepared for the demands of modern education.
Footfall Australia has been serving the Australian market since 2004, providing proprietary AI-powered hardware and a national support network of local partners. We ensure your data remains accurate and your systems stay future-proof through consistent technical innovation. It’s time to replace intuition with evidence to create a more seamless experience for your students and staff. Request a Professional Campus Traffic Audit today to begin your journey toward a data-driven campus. We look forward to helping you stay ahead of shifting behavioural trends with reliable, strategic insights.
Frequently Asked Questions
Is student traffic flow analysis privacy-compliant?
Yes, this methodology is fully compliant with Australian Privacy Principles (APP) and GDPR. The FootfallCam Pro2 processes data at the edge, meaning video feeds are never recorded or stored. Instead, the system converts human movement into anonymous digital coordinates, ensuring that personally identifiable information is never captured. This approach allows institutions to gather high-level insights without compromising the anonymity of the student body.
How accurate are people counters in busy campus environments?
Dedicated 3D stereoscopic sensors achieve up to 99.5% accuracy even in high-density campus environments. Unlike traditional infrared beams, these sensors use depth perception to distinguish between individuals walking in close proximity or groups entering simultaneously. This precision is essential for a reliable student traffic flow analysis, as it ensures your data reflects actual occupancy rather than counting errors caused by overlapping shadows or inanimate objects.
Can we use our existing CCTV cameras for traffic analysis?
You can repurpose existing CCTV cameras by integrating them with the FootfallCam Centroid. This AI-powered processing unit applies sophisticated algorithms to your current video feeds to track movement and counting. While dedicated sensors like the Pro2 offer the highest precision, the Centroid provides a cost-effective way to expand the scope of your analysis across large areas without the need for extensive new hardware installations.
What is the difference between a simple counter and flow analysis?
A simple counter only records the number of entries and exits, whereas flow analysis tracks the entire narrative of movement. Student traffic flow analysis examines dwell times, path preferences, and how students transition between different campus zones. This deeper level of insight allows facility managers to identify bottlenecks and underutilised spaces, providing a strategic map of human behaviour rather than just a total headcount.
How does traffic data help with campus energy efficiency?
Traffic data enables building management systems to adjust HVAC and lighting based on real-time occupancy. Instead of running climate control in a lecture hall on a fixed schedule, the system can dynamically reduce energy consumption when the room is empty or at low capacity. This data-driven approach significantly lowers operational costs and helps educational institutions meet their sustainability targets by eliminating energy waste in under-utilised facilities.
What hardware is required for a university-wide rollout?
A university-wide rollout typically requires a combination of FootfallCam Pro2 sensors for critical entry points and the FootfallCam Centroid for broader spatial tracking. These devices connect to the FootfallCam V9 software, which aggregates the data into a centralised dashboard. Depending on your infrastructure, you can choose between wired Power over Ethernet or Wi-Fi enabled configurations to ensure stable data transmission across the entire campus network.
How long does it take to see actionable insights from the data?
You’ll begin seeing raw data immediately after installation, with meaningful trends typically emerging within the first two to four weeks. This initial period allows the V9 software to establish a baseline for normal campus activity. Once this baseline is set, you can identify anomalies, peak usage times, and flow patterns that inform immediate adjustments to cleaning schedules, staffing levels, and security patrols.
Can this data be integrated with our existing building management systems?
Yes, the data from FootfallCam V9 software can be seamlessly integrated with existing building management systems (BMS) via API. This connectivity allows for the automation of campus operations based on live occupancy metrics. For example, your BMS can use flow data to trigger maintenance alerts for high-traffic restrooms or to optimise elevator dispatching during peak class transition times, ensuring maximum operational efficiency.