The Ultimate Guide to Retail Sales Conversion Rate in 2026
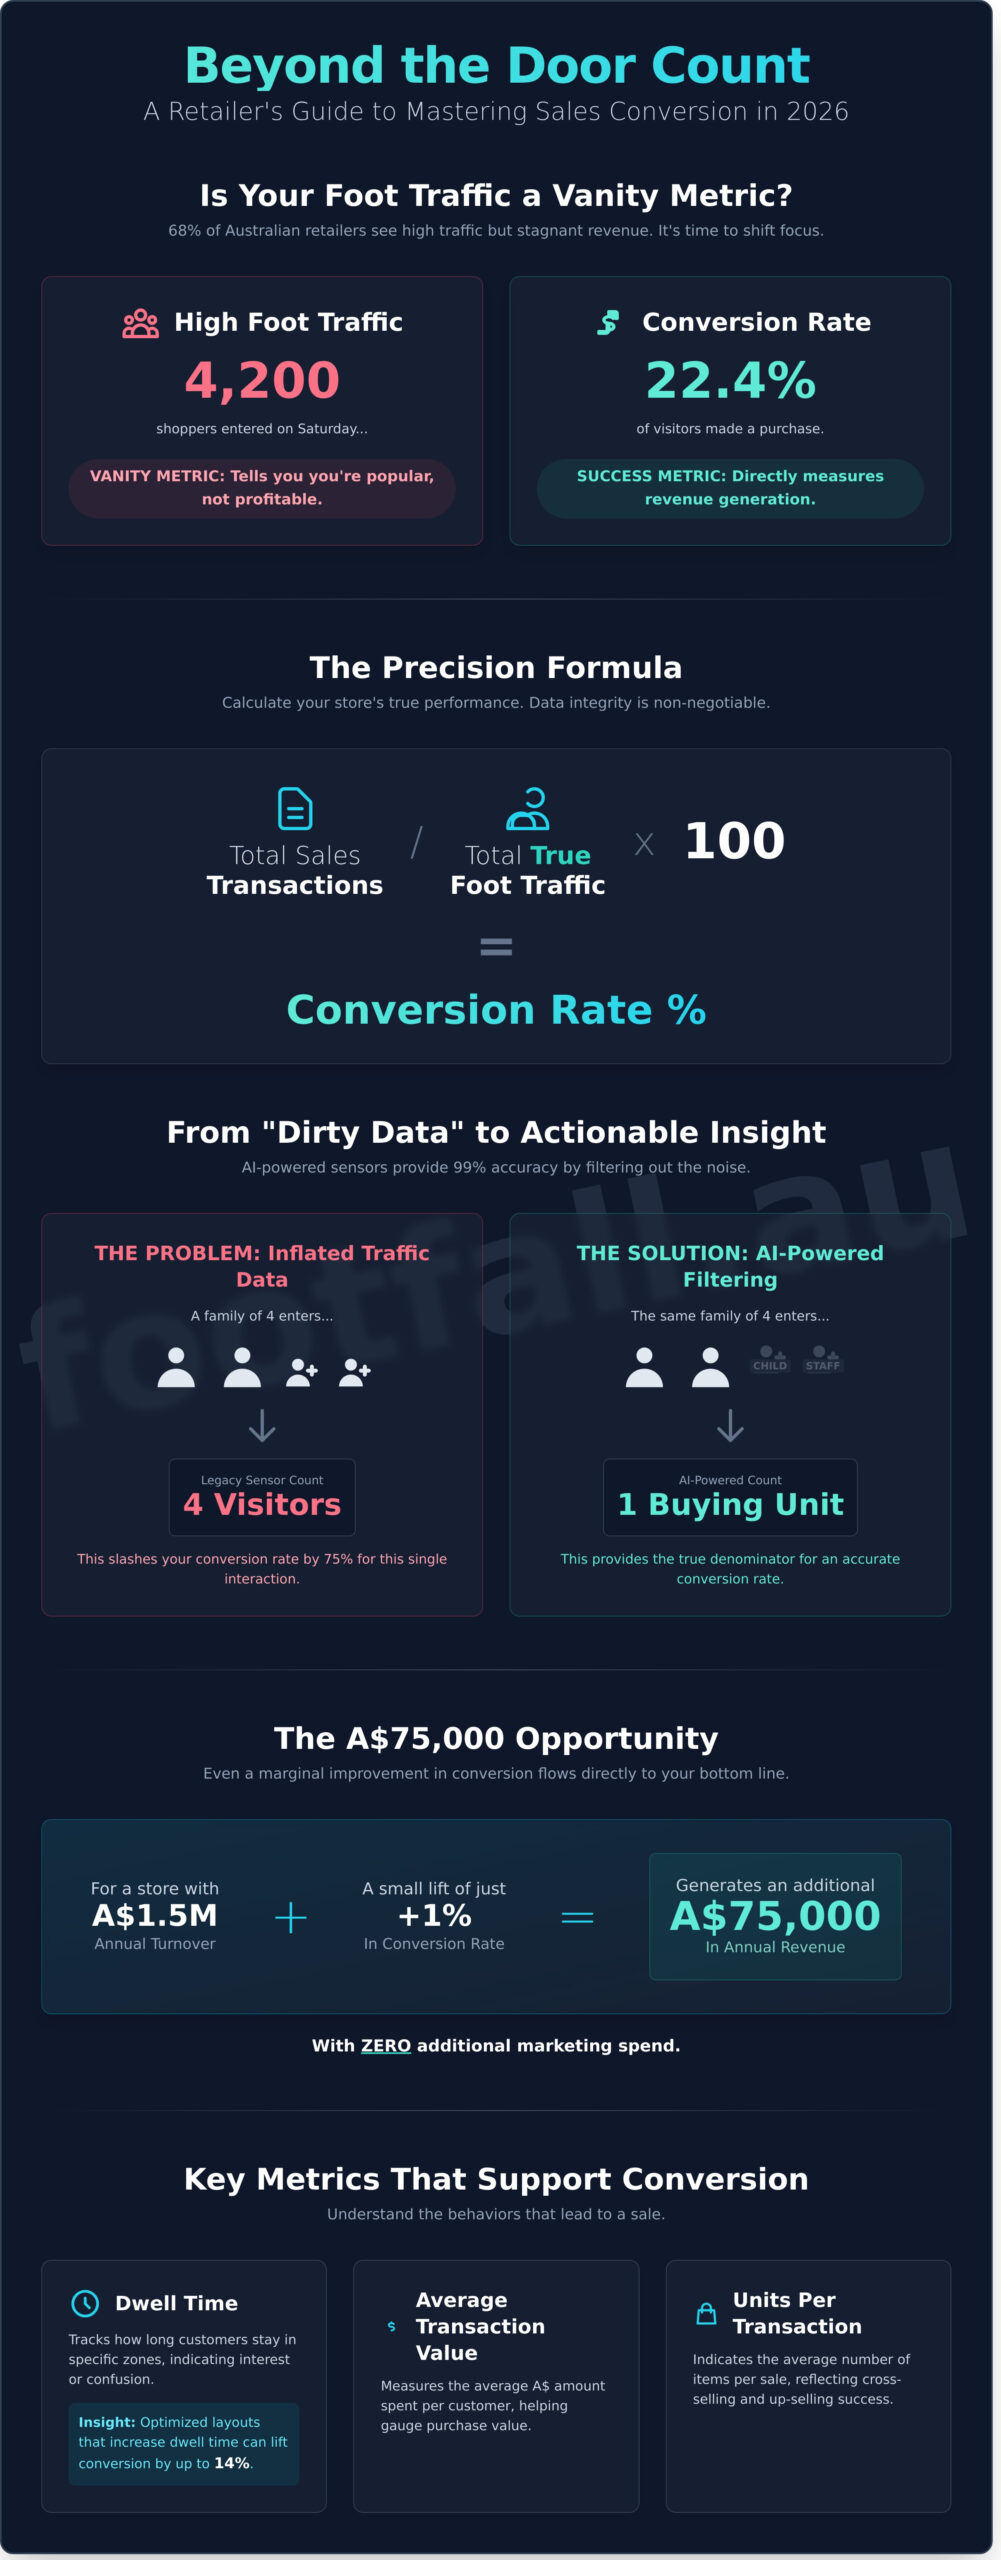
What if the 4,200 shoppers who entered your CBD flagship store last Saturday weren’t a sign of success, but a hidden indicator of lost revenue? It’s a frustrating reality for 68% of Australian retailers who see bustling aisles but daily totals that haven’t shifted since early 2024. You likely agree that high foot traffic is a vanity metric if your retail sales conversion rate remains trapped below the 2026 industry average of 22.4%. Legacy sensors often miscount groups. This leads to staffing schedules that waste A$450 in hourly wages while leaving your best sales staff thin during peak hours.
Master the science of conversion by moving beyond guesswork toward AI-driven precision. This guide provides a clear roadmap to increase your revenue by 12.5% without spending a single dollar more on marketing. We’ll explore 2026 benchmarks, provide a definitive calculation formula, and decode the visitor journey into actionable profit.
Key Takeaways
- Identify why foot traffic is a vanity metric in 2026 and how to shift your focus toward measurable revenue growth.
- Master the precision formula for calculating your retail sales conversion rate while maintaining data integrity through staff and group filtering.
- Compare your performance against Australian benchmarks, from high-density Sydney CBD retail to specialized regional WA market trends.
- Discover how to eliminate store “cold zones” and optimize labor costs by aligning staff rosters with identified power hours.
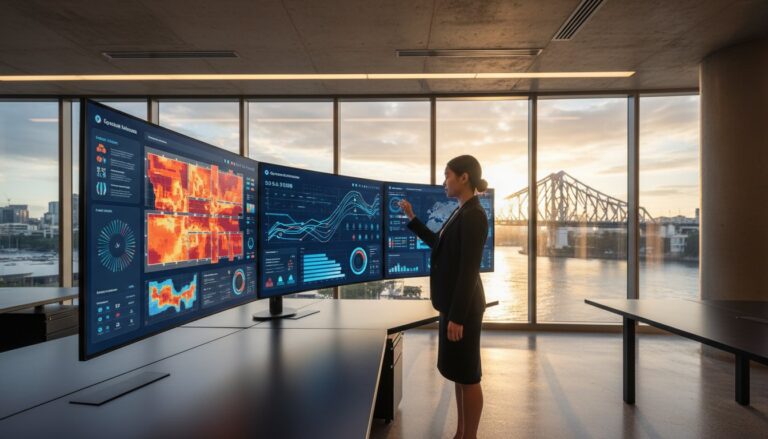
- Leverage AI-driven analytics and FootfallCam Pro2 hardware to move beyond historical reporting into predictive traffic modeling.
What is Retail Sales Conversion Rate and Why It Matters in 2026
The retail sales conversion rate represents the most honest audit of a physical store’s performance. It’s the percentage of total visitors who make a purchase during their visit. While high-level digital marketing often focuses on clicks, physical retail success in 2026 depends on what happens after a person crosses the threshold. Understanding What is a conversion rate? provides the foundation for this analysis; it’s the ratio of transactions to total foot traffic. For Australian retailers, this metric has transitioned from a secondary data point to the primary driver of strategic growth.
The “Retail Shift” of 2026 has officially classified foot traffic as a vanity metric. Raw visitor numbers tell you how much people like your window display, but they don’t tell you if your business is actually making money. High traffic without a corresponding retail sales conversion rate indicates a fundamental disconnect between customer expectations and the in-store experience. Data from 2025 shows that 68% of Australian SMEs that focused exclusively on increasing footfall saw their profit margins shrink due to rising operational overheads. Conversely, those who optimized for conversion saw immediate stability. Focusing on the visitors you already have is significantly more cost-effective than paying to acquire new ones who don’t buy.
The financial implications for Australian business owners are substantial. Consider an SME with an annual turnover of A$1.5 million and a conversion rate of 20%. Lifting that conversion rate by just 1% through better staff placement or inventory alignment can generate an additional A$75,000 in annual revenue. This gain requires zero additional marketing spend. It’s found money that flows directly to the bottom line. Accurate footfall data allows managers to link these financial outcomes to operational efficiency, ensuring that staff are on the floor when the highest-intent shoppers are present.
The Evolution of Conversion Tracking
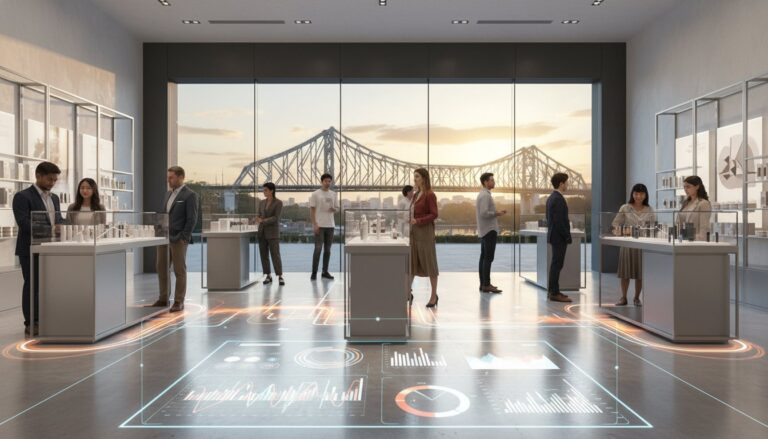
Retailers have moved far beyond the era of manual clickers and staff tallies. In 2026, AI-powered spatial analytics provide a 99% accuracy rate in distinguishing between staff, families, and individual shoppers. Relying on a “gut feeling” about store busyness often leads to poor management decisions; managers frequently overstaff during low-intent periods and understaff during peak buying windows. The modern Smart Strategist in Australian retail uses high-tech sensors to eliminate this guesswork. Precision data replaces intuition, allowing for seamless adjustments to store operations in real-time.
Key Metrics That Support Conversion
- Dwell Time: This tracks how long customers stay in specific zones. Long dwell times in front of a display that yields zero sales suggest a confusing price point or poor product placement.
- Average Transaction Value (ATV): This measures the mean A$ amount spent per customer. It helps determine if your conversion lift is coming from small impulse buys or high-value items.
- Units Per Transaction (UPT): This indicates how many items are in the average basket, reflecting the success of cross-selling strategies.
Extended dwell time directly correlates with a 14% lift in conversion when store layouts encourage proactive staff engagement rather than passive browsing.
The Precision Formula: How to Calculate Conversion Rate Accurately
To calculate your retail sales conversion rate, use the standard formula: (Total Sales Transactions / Total Foot Traffic) x 100. While this equation appears straightforward, its utility depends entirely on the quality of the denominator. Many Australian retailers struggle with “dirty data” that inflates traffic numbers and artificially deflates conversion metrics. If your traffic data includes staff members, delivery drivers, or children who aren’t primary decision-makers, your conversion percentage is a fiction rather than a functional KPI.
Data integrity remains the most significant hurdle in modern retail analytics. If a family of four enters your store in Sydney’s CBD, they usually represent a single buying unit. Standard infrared beams count them as four separate individuals, which immediately slashes your conversion rate by 75% for that specific interaction. Retailers often look to global benchmarks, such as the latest retail sales data, to understand how shifting economic conditions impact consumer intent. However, these macro-trends only provide value if your internal micro-data is precise.
Achieving this precision requires a seamless integration between your Point of Sale (POS) system and your people counting software. Relying on manual tallies or disconnected reports leads to “data silos” where sales peaks and traffic surges never align. By syncing these two streams, you gain the ability to see exactly how many people were in the store during a specific hour and how many of them actually reached the checkout. The FootfallCam Pro2 acts as the “source of truth” in this ecosystem, providing the granular traffic detail necessary to make sense of your transaction history.
Step-by-Step Calculation Guide
Step 1: Isolate your visitor traffic by using AI-powered sensors to exclude staff and delivery personnel from the total count. Step 2: Sync your POS timestamp data with your hourly footfall reports to ensure sales are mapped against the correct visitor window. Step 3: Apply the 2026 conversion formula to identify peak performance windows; this involves looking at conversion rates during high-traffic hours versus low-traffic periods to determine if your staffing levels are sufficient to handle the load. Integrating these metrics into a centralised retail dashboard allows managers to move from reactive guessing to proactive strategy.
The Role of AI in Eliminating Data Noise
Advanced AI counters distinguish between adults, children, and shopping groups with surgical precision. This technology ensures that a group of three friends is recorded as one potential sales opportunity when appropriate, preserving the accuracy of your retail sales conversion rate. High-stakes retail decisions require 99.5% accuracy; anything less leads to wasted marketing spend and poor labour allocation. A recent case study of an Australian boutique chain showed that precise counting corrected a “false low” conversion rate. Initially reported at 15%, the rate was actually 22% once staff movements and delivery windows were filtered out. This 7% discrepancy had previously led management to believe their sales team was underperforming when, in reality, they were exceeding industry standards. Using scientific evidence to validate staff performance builds a culture of trust and objective accountability.
Benchmarking Success: What is a “Good” Retail Conversion Rate in Australia?
Defining a successful retail sales conversion rate requires looking beyond a single percentage. In the 2026 Australian retail landscape, success is relative. It’s dictated by your sector, your specific location, and the current economic climate. As of mid-2026, Australian household discretionary spending has stabilized at a modest 2.1% growth rate, leading to a shift in consumer behavior. Shoppers are now more likely to use physical stores as “research hubs,” where they interact with products before seeking out high-quality specialty gear online from retailers like The Fight Club. This means a lower conversion rate doesn’t always signal a failing store; it often reflects a change in the visitor journey.
One of the most frequent concerns we address is the “15% anxiety.” Many retailers believe that if they aren’t converting at least 30% of their traffic, their operations are flawed. This is a misconception. If you’re running a high-end boutique in Sydney’s Paddington or a specialty electronics store in the Perth CBD, a 15% conversion rate often indicates a healthy, qualified audience. You don’t need to convert every passerby to remain profitable. You simply need to ensure that the 15% you do convert represents your high-value target demographic. In 2026, the quality of the interaction is becoming just as measurable as the transaction itself.
Industry type significantly alters these benchmarks. Luxury retailers operate on a “low traffic, high intent” model. They might see only 30 visitors a day but convert 8 of them, resulting in a 26% rate. In contrast, Fast-Moving Consumer Goods (FMCG) outlets in high-traffic zones like Sydney’s Town Hall station handle massive volumes of incidental footfall. Their retail sales conversion rate might hover around 8% to 12% because many visitors are simply killing time or seeking shelter from the weather. Both stores are successful, yet their metrics look entirely different on paper.
2026 Industry Benchmarks for Australian Retail
Current data from the first half of 2026 shows distinct corridors of performance across the country. Apparel and fashion retailers currently aim for a benchmark between 15% and 25%. Success in this sector depends heavily on fitting room conversion, which remains the strongest predictor of a sale. Electronics and high-value goods see lower expectations, typically ranging from 5% to 12%, as these items require longer consideration periods. Meanwhile, pharmacy and essential services continue to lead with 40%+ conversion targets, driven by mission-based shopping where the customer enters with a specific, non-negotiable need.
Why Conversion Rates Vary Between Store Locations
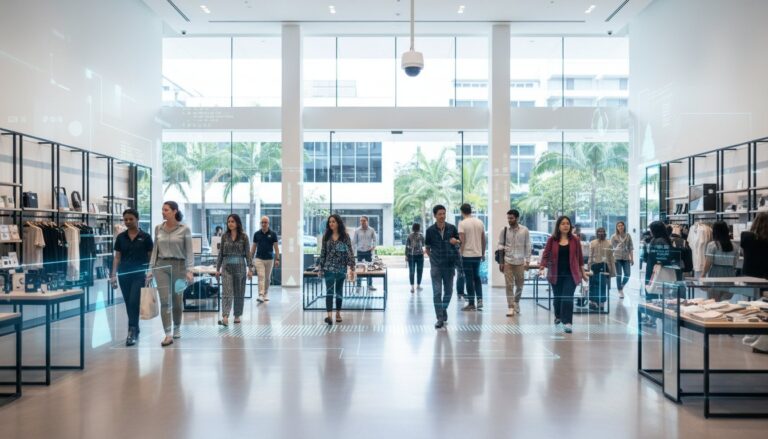
The “Flagship Effect” creates a unique data profile for stores in major hubs like Melbourne’s Bourke Street Mall. These locations act as brand billboards, attracting high volumes of tourists and browsers who may eventually purchase at a suburban satellite store or online. Consequently, their conversion rates are often lower than smaller boutique locations. Geography also introduces environmental variables. In Brisbane, for instance, sudden summer storm patterns in early 2026 caused a 14% spike in “dwell time” as shoppers waited out the rain, which temporarily diluted conversion rates despite steady sales volume.
Managing these variables across a national network is impossible without centralized data. Smart retailers use FootfallCam V9 Software to compare multi-store performance by normalizing for local factors. This technology allows you to see if a dip in a Sydney store is a localized issue or part of a broader trend. By isolating footfall data from sales figures, you gain the precision needed to identify whether your staff, your stock, or simply the weather is the primary driver of your conversion outcomes.
5 Actionable Strategies to Lift Your Store Conversion Rate
Data transforms retail management from a series of guesses into a precise science. Moving the needle on your retail sales conversion rate requires more than just aesthetic changes; it demands a surgical approach to operational efficiency and spatial intelligence. By focusing on the human movement within your four walls, you can identify exactly where sales are being lost and deploy targeted interventions to recover them.
Staffing for Conversion: The Power Hour Method
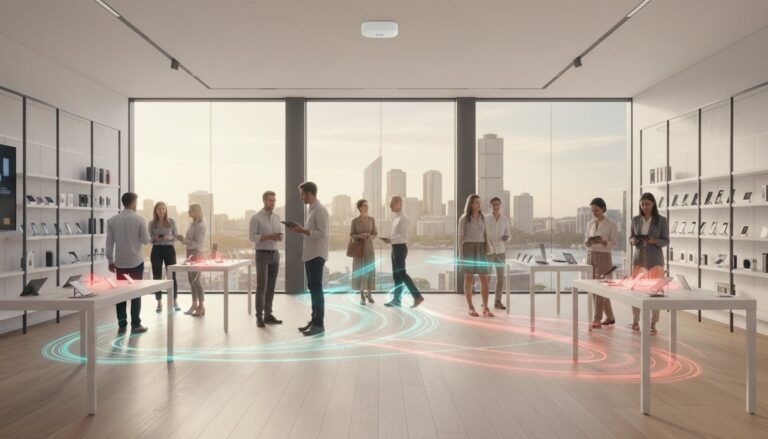
Aligning your most experienced sales staff with high-traffic periods is the most immediate way to boost performance. Data from Sydney CBD retailers shows that traffic often peaks in a sharp 90-minute window during lunch hours, yet many stores maintain flat rosters. This creates a bottleneck where the staff-to-customer ratio exceeds 1:15, leading to a 22% drop in conversion as shoppers fail to find assistance. You should aim for a 1:8 ratio during these “Power Hours” to ensure every visitor receives a high-quality interaction. Training your team to identify “high-dwell” customers-those who spend more than 6 minutes in a single zone-allows them to intervene at the precise moment of high purchase intent.
Layout and Merchandising Optimisation
The first 5 meters of your store, frequently called the decompression zone, is often dismissed as dead space. Evidence suggests this area is critical for setting the pace of the visitor journey. Using heatmaps allows you to identify “cold zones” where customers consistently turn back or move too quickly to engage with products. You can test display changes using A/B footfall testing to see which configurations actually stop traffic. For example, moving a high-margin accessory stand just 2 meters closer to a high-traffic path can increase its engagement rate by 14% without changing the price point.
To further refine the floor plan, consider these data-driven adjustments:
- Identify and eliminate “dead ends” that cause customers to exit the store prematurely.
- Place high-demand items in the rear 30% of the store to draw traffic through multiple “hot zones.”
- Use spatial analytics to ensure wide-aisle clearance, as 68% of Australian shoppers will abandon a browse if they feel crowded.
While these layout optimisations are vital, they build on the foundation of a pristine store environment. A single pest sighting, for example, can instantly nullify merchandising efforts, damage brand reputation, and cause shoppers to leave. Ensuring a clean and welcoming space is a non-negotiable part of any conversion strategy. For retailers looking to safeguard their premises and customer experience, you can visit ABC Pest Control Sydney for professional solutions.
Refining the retail sales conversion rate also involves looking outward. Window display analytics provide a “capture rate” metric, showing how many passersby actually enter the store. If a new display in a Melbourne boutique increases foot traffic by 10% but conversion remains flat, the issue isn’t the window; it’s the disconnect between the window’s promise and the in-store stock. This level of insight prevents wasted marketing spend on displays that don’t translate to sales.
Finally, address the final hurdle: the checkout. Real-time alerts for queue management prevent abandonment before it happens. A wait time exceeding 4 minutes often leads to a 15% drop in transaction volume. Implementing a system that triggers an extra register when more than 3 people are in line protects your revenue at the most vulnerable point of the journey. Every second shaved off a wait time represents a direct win for your bottom line.
Ready to see the invisible patterns in your store? Discover how Footfall Australia’s spatial analytics can transform your retail performance.
Future-Proofing Your Retail Strategy with Footfall Australia
Measuring yesterday’s performance is no longer enough to maintain a competitive edge in the Australian market. Modern retail requires a pivot toward predictive intelligence. By integrating the FootfallCam Pro2 hardware with V9 analytics, retailers gain a forward-looking perspective on shopper behavior. This combination doesn’t just record who walked in; it identifies patterns that allow you to optimize your retail sales conversion rate before the next peak period begins. The transition from reactive reporting to proactive strategy is the hallmark of a data-driven business.
The V9 analytics platform processes complex datasets into simple, actionable insights. It removes the friction of manual data entry and provides a single source of truth for your entire organization. When hardware and software work in tandem, you eliminate the blind spots that lead to overstaffing or missed sales opportunities. You gain the ability to forecast traffic based on historical trends, local events, and seasonal shifts. This level of precision ensures that every operational decision is backed by evidence rather than guesswork.
The Footfall Australia Advantage
Footfall Australia has been a steady presence in the local market since 2004. We understand the specific pressures of the Australian retail environment, from high labor costs to shifting consumer expectations. Many retailers currently rely on aging hardware that will reach end-of-life status soon. Our Legacy Swap Out Plan targets 2026 as the critical year for upgrading these obsolete sensors to ensure data remains accurate and secure. Older 2D and basic 3D sensors often fail to meet the 99.5% accuracy standards required for modern spatial analytics.
Data continuity depends on reliable support. Our network of local partners ensures that your system remains operational regardless of your location. We provide specialized coverage across the country:
- Perth: On-site technical support for Western Australian retail hubs.
- Adelaide: Local installation experts familiar with South Australian commercial regulations.
- Canberra: Dedicated maintenance plans for high-traffic public and retail spaces.
Getting Started with Professional Analytics
Precision starts with a comprehensive site survey for your retail chain. We evaluate ceiling heights, lighting conditions, and entrance widths to ensure optimal sensor placement. This technical rigor is why our clients see a full ROI on their professional people counting systems within the first 6 months of implementation. By identifying the exact moments when your retail sales conversion rate dips, you can implement immediate training or marketing interventions. The cost of the system is quickly offset by the recovery of lost sales and the optimization of staff rosters.
Maintenance plans are a critical component of our service. They ensure that your sensors are always heartbeat-monitored and that your data flow is never interrupted. Without local Australian support, a simple firmware glitch could result in weeks of lost data. Our Brisbane-based team handles the technical heavy lifting so you can focus on strategy. Stop relying on intuition and start leading with confidence. Book a consultation with our Brisbane-based experts today to secure your data future and transform your visitor journey into a narrative of growth.
Mastering Your Retail Future Through Data Precision
Navigating the retail landscape of 2026 requires a shift from simple observation to rigorous optimization. Your retail sales conversion rate stands as the most critical barometer of store health, revealing exactly where your operations succeed and where they falter. Success hinges on your ability to interpret visitor behavior through a lens of high-tech precision. Footfall Australia has partnered with local retailers since 2004, providing the clarity needed to navigate shifting market trends with confidence. Our AI-driven hardware achieves 99.5% counting accuracy, stripping away the uncertainty that often clouds manual reporting or legacy systems.
We provide more than just sensors; we offer a strategic roadmap supported by local experts in all major Australian capital cities. It’s time to turn your floor space into a high-performing asset. By focusing on evidence-based strategies and actionable insights, you’ll ensure your brand remains resilient and profitable in any economic climate. Maximise your store revenue with Footfall Australia: Enquire Now
Frequently Asked Questions
What is the average retail conversion rate in Australia for 2026?
The projected average retail sales conversion rate in Australia for 2026 is approximately 22.5% for physical storefronts. This figure represents a 1.2% increase from 2024 levels as retailers adopt more precise spatial analytics to optimize their floorspace. While specialty stores often see rates reaching 30%, high-volume department stores typically hover around 15% due to higher browsing traffic. Monitoring this metric against the national benchmark helps you identify if your store is capturing its fair share of the local market.
How does a people counter actually help improve sales?
People counters improve sales by providing the essential denominator needed to calculate your exact conversion rate. Without this data, you’re only seeing half the picture of your store’s performance and missing critical opportunities. By identifying periods where traffic is high but sales are low, you can adjust staff scheduling or floor layouts immediately. Retailers using FootfallCam report an average 15% increase in sales within the first six months of data implementation.
Can I integrate my existing POS system with FootfallCam software?
Yes, FootfallCam integrates with over 60 global and Australian POS systems through a seamless API connection. This integration automatically pulls transaction data into your footfall reports to calculate your retail sales conversion rate in real-time. You won’t need to manually export CSV files or use complex spreadsheets. It streamlines your operations by centralizing all performance metrics into a single, intuitive dashboard for faster decision-making and better strategy development.
Why is my conversion rate lower on weekends than on weekdays?
Weekend conversion rates often drop by 5% to 8% because foot traffic shifts from mission-driven shoppers to casual browsers. While your total visitor count increases, the intent to purchase is statistically lower on Saturdays and Sundays. Additionally, if your staffing levels don’t scale with the 40% increase in weekend traffic, customers may leave without purchasing due to long wait times. Balancing your staff-to-visitor ratio is the most effective way to stabilize these fluctuations.
Is it worth installing people counters in a small boutique shop?
Installing people counters in a small boutique is highly profitable, often delivering a full return on investment within 120 days. In a low-traffic, high-value environment, every missed opportunity costs more significantly than in a mass-market store. Accurate data helps you understand if a quiet day was due to low street traffic or poor in-store engagement. It allows you to justify marketing spend and optimize opening hours for maximum efficiency without wasting resources.
How accurate are AI people counters compared to older infrared sensors?
AI-driven 3D sensors achieve 99.5% accuracy, whereas older infrared sensors often fluctuate between 60% and 80% due to environmental factors. Infrared technology struggles with shadows, groups of people, or children, leading to skewed data that misrepresents your true performance. FootfallCam uses advanced stereoscopic vision to distinguish between adults, children, and even staff members. This precision ensures your strategic decisions are based on verified facts rather than unreliable estimates or guesswork.
What is a “Power Hour” in retail traffic analysis?
A Power Hour is the specific 60-minute window where your store experiences its highest volume of foot traffic and sales potential. In Australian CBDs, this typically occurs between 12:30 PM and 1:30 PM as office workers shop during lunch breaks. Identifying these periods allows you to schedule your most experienced sales staff on the floor when they’re needed most. Maximizing conversion during these high-intensity hours can increase your total daily revenue by up to 20%.
Does weather affect retail conversion rates in cities like Melbourne?
Weather significantly impacts shopping behavior, with Melbourne retailers seeing a 10% decrease in foot traffic during rainy days. However, the conversion rate often increases by 5% during these periods because visitors who do enter are highly motivated buyers. On a clear 22°C day, you might see more browsers but lower individual spend per person. Tracking these patterns helps you adjust your inventory and staffing levels based on the Bureau of Meteorology forecasts to maintain profitability.