How to Analyse Customer Traffic Patterns: A Data-Driven Framework for 2026
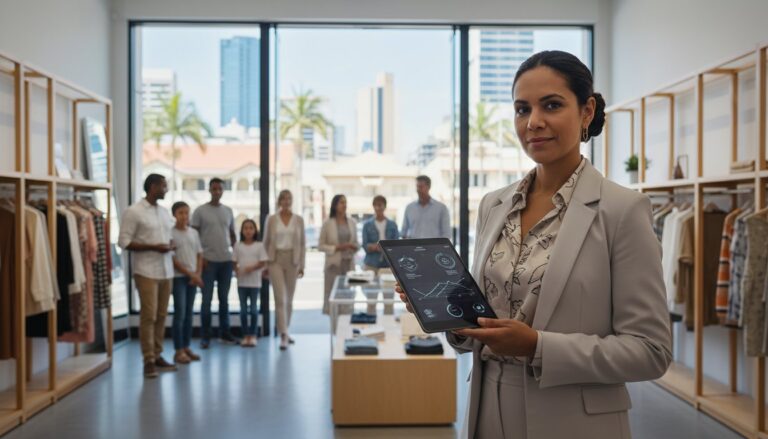
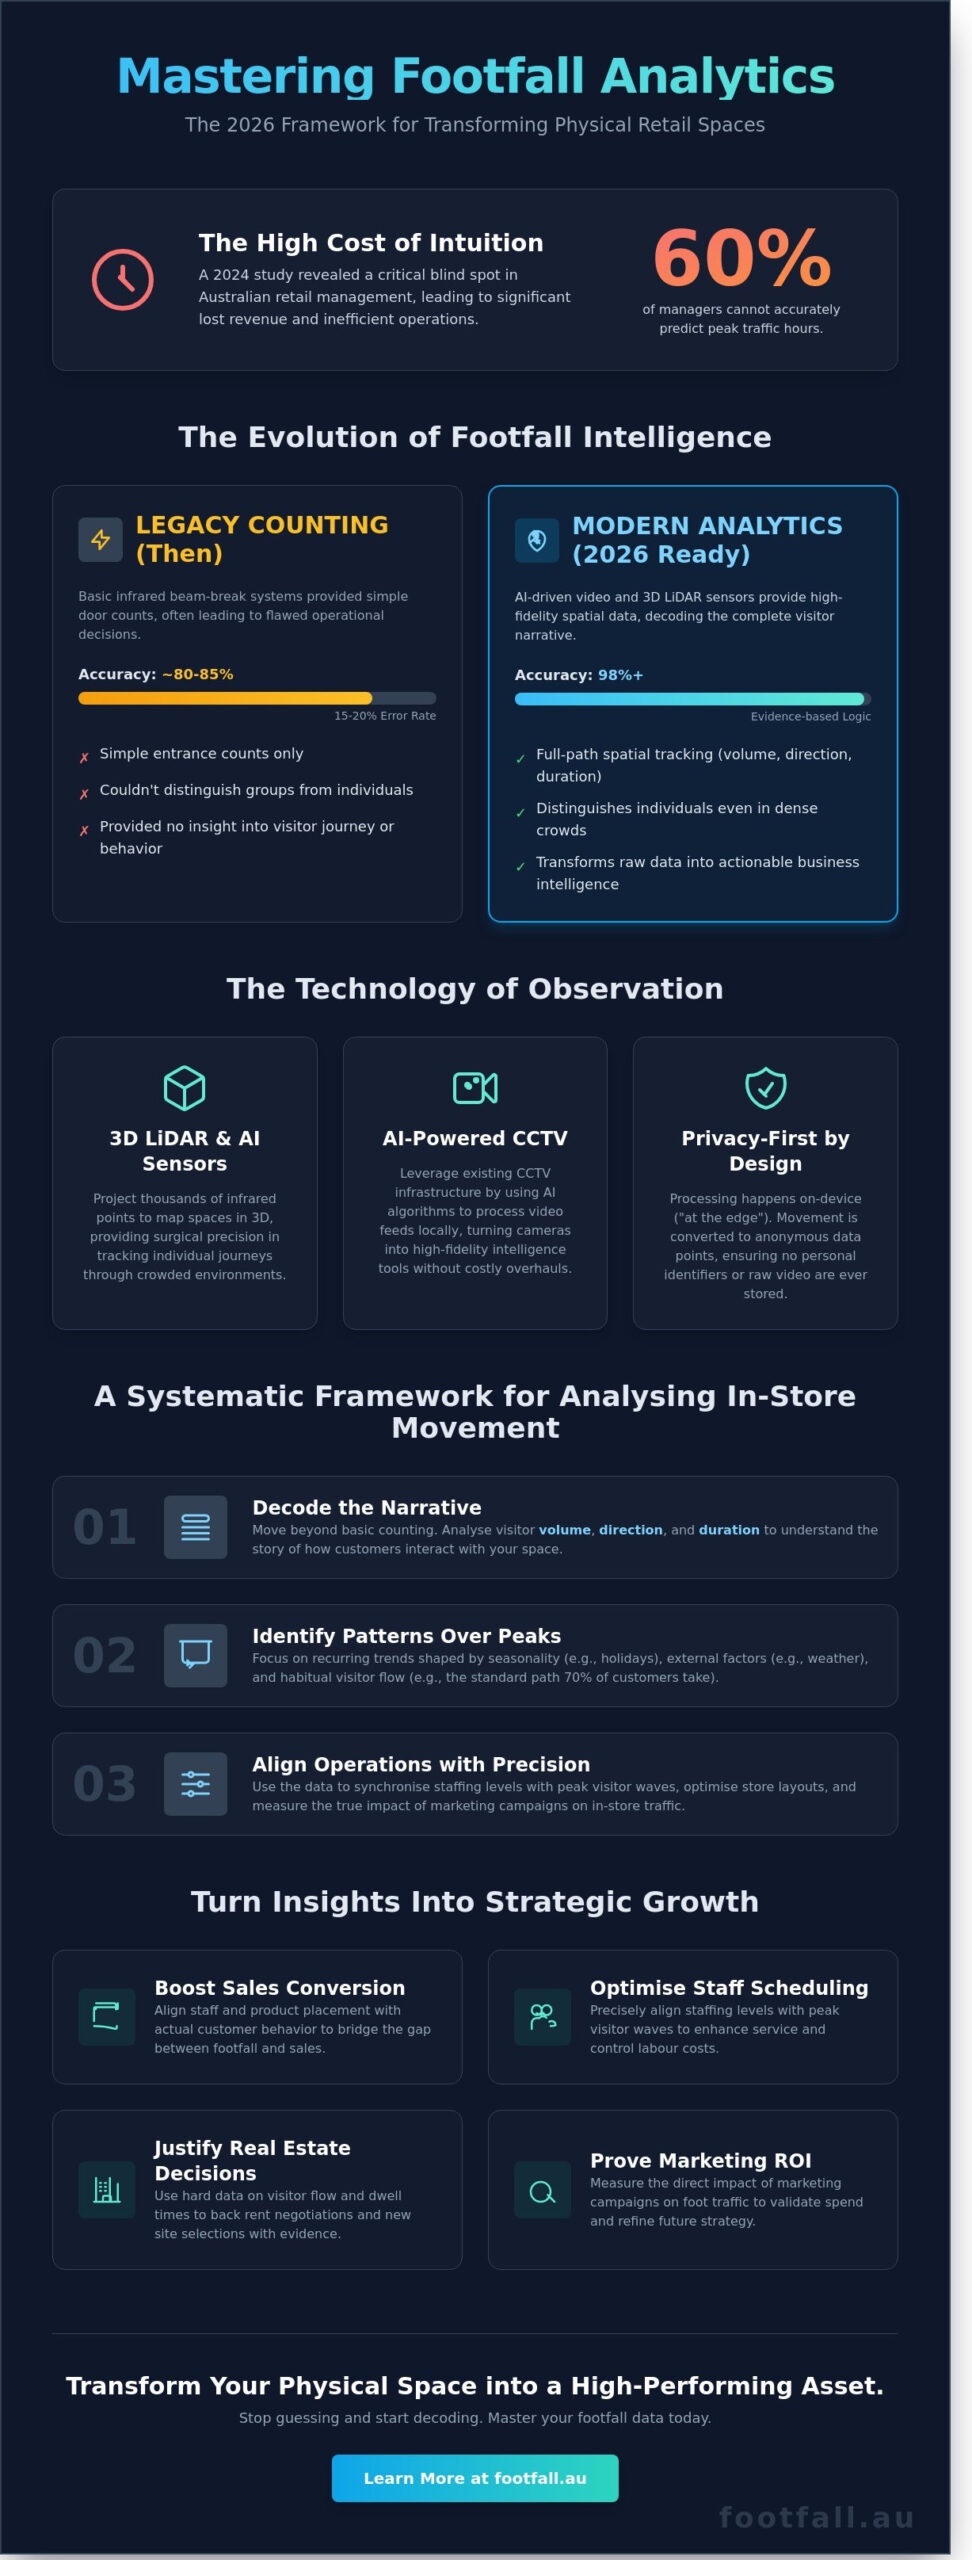
A recent 2024 study of Australian retail environments revealed that nearly 60% of managers cannot accurately predict their peak traffic hours within a two-hour margin, leading to significant lost opportunities. You’ve likely seen the data on your dashboard, but translating it into a roster or a floor plan remains a challenge. Understanding how to analyse customer traffic patterns is the shift from passive observation to active strategic control. It allows you to decode the complex movement of visitors and turn those patterns into a roadmap for higher revenue.
We agree that raw data feels like noise without a clear lens to view it through. You’re tired of inconsistent staffing levels and marketing campaigns that offer no clear proof of success. This guide provides a systematic framework to master footfall analytics for the 2026 landscape. You’ll learn to refine your conversion rates and align your staff scheduling with precision. We will examine the core metrics and implementation strategies that transform your physical space into a high-performing asset.
Key Takeaways
- Transition from basic people counting to strategic spatial analytics by decoding the specific narrative of visitor volume, direction, and duration.
- Learn how to analyse customer traffic patterns using 3D LiDAR and AI-powered sensors to transform existing CCTV infrastructure into high-fidelity intelligence tools.
- Identify the primary KPIs that bridge the gap between raw footfall and sales conversion, turning spatial data into actionable business intelligence.
- Master a systematic framework for synchronising data points and identifying traffic baselines to align staffing levels precisely with peak visitor waves.
- Utilise precise movement insights to justify rent negotiations and site selections, ensuring every A$ invested in your Australian physical footprint is backed by hard evidence.
Beyond Simple Counting: Understanding the Narrative of Customer Traffic Patterns
Analysing customer traffic patterns involves more than watching a doorway. It’s the rigorous study of visitor volume, direction, and duration within a physical space. While many managers rely on raw numbers, true intelligence lies in the distinction between people counting and traffic analysis. Raw data tells you a person entered; strategic analysis tells you why they stayed and where they stalled. Learning how to analyse customer traffic patterns effectively transforms a physical store from a static room into a dynamic, measurable environment.
The Evolution of Footfall Intelligence
The technology behind traffic monitoring has shifted significantly. Legacy infrared systems, which relied on simple beam-breaks, often suffered from a 15% to 20% error rate because they couldn’t distinguish between a single shopper and a group. Modern AI-driven video analytics have replaced these outdated tools, offering 98% accuracy even in high-density areas. This shift allows for more than just entrance counts. It enables full-path spatial tracking, allowing operators to see exactly how visitors navigate through aisles and zones. Precision is vital. When an Australian retailer makes high-stakes operational decisions involving thousands of dollars in labour costs, they need data they can trust. High-tech sensors now provide the granular detail required to justify these investments.
Why Patterns Matter More Than Peaks
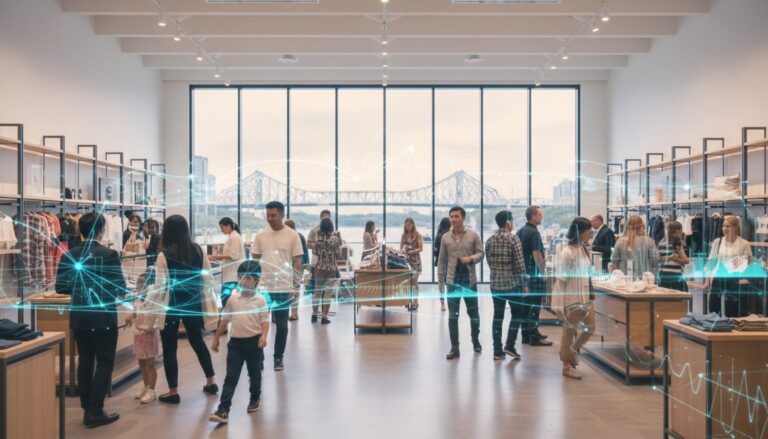
Single spikes in traffic are often anomalies, but recurring patterns reveal the underlying habits of your consumer base. These patterns show how external factors, such as local weather shifts in Melbourne or public transport schedules in Sydney, shape the flow of people. Recognising these trends allows for proactive rather than reactive management. Mastering how to analyse customer traffic patterns allows managers to predict when a surge will occur, ensuring the floor is never understaffed. It’s about moving beyond the “peak” and understanding the rhythm of the day.
- Seasonality: Identifying how traffic shifts during Australian school holidays versus standard work weeks.
- External Factors: Measuring the impact of local events or temperature changes on dwell time.
- Habitual Flow: Recognising the standard paths 70% of your visitors take upon entering the premises.
Traffic patterns are the heartbeat of physical business operations.
The Technology of Observation: Decoding the Visitor Journey with AI
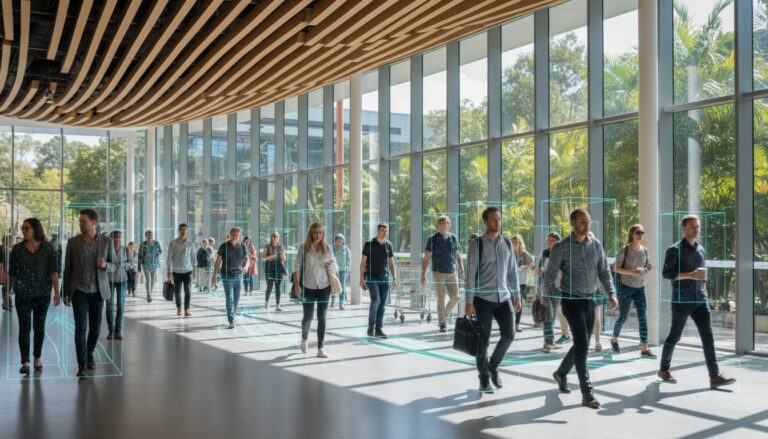
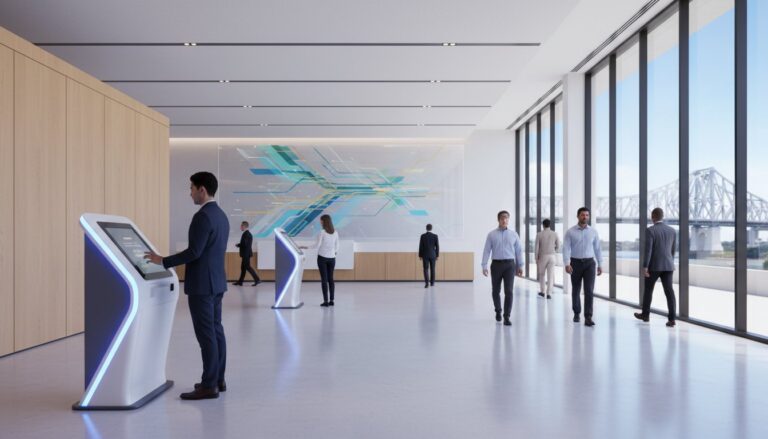
Understanding the mechanics of movement requires more than a simple headcount. 3D LiDAR and AI-powered sensors capture high-fidelity movement data by projecting thousands of infrared points to map a space in three dimensions. This technology provides the depth perception needed to track individual journeys through crowded environments with surgical precision. The “Centroid” approach extends this capability by turning existing CCTV networks into intelligent analytical tools. It uses AI algorithms to process video feeds locally, identifying patterns without the need for expensive structural overhauls or new cabling. This integration allows businesses to leverage their current infrastructure to gain a sophisticated view of visitor flow.
Data security is a non-negotiable standard in modern analytics. Modern systems analyse behaviour at the “edge,” meaning the processing happens on the device itself rather than in a central cloud. They don’t store personal identifiers, facial features, or raw video footage. Instead, they convert human movement into anonymous data points. This creates a privacy-first environment where human behaviour is decoded through movement vectors. It ensures full compliance with Australian privacy regulations while providing the evidence needed for strategic planning.
High-Precision Sensors: The FootfallCam Pro2 Advantage
The FootfallCam Pro2 serves as the primary tool for Australian retailers seeking absolute data integrity. It utilises AI to distinguish between staff, children, and shopping groups with a verified accuracy rate of 98% or higher. This level of detail is essential for accurate business intelligence. By filtering out non-buyers, such as security personnel or children, the system provides a realistic view of sales opportunities. In the competitive landscape of 2026, relying on unrefined totals will lead to flawed strategy. Precision sensors ensure every decision is based on verified human intent.
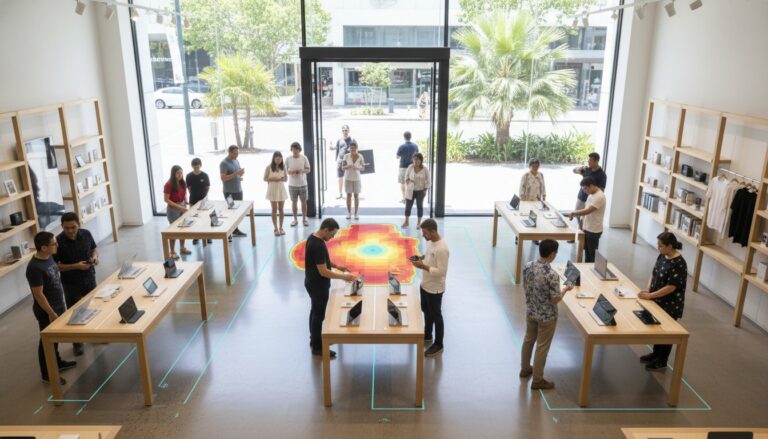
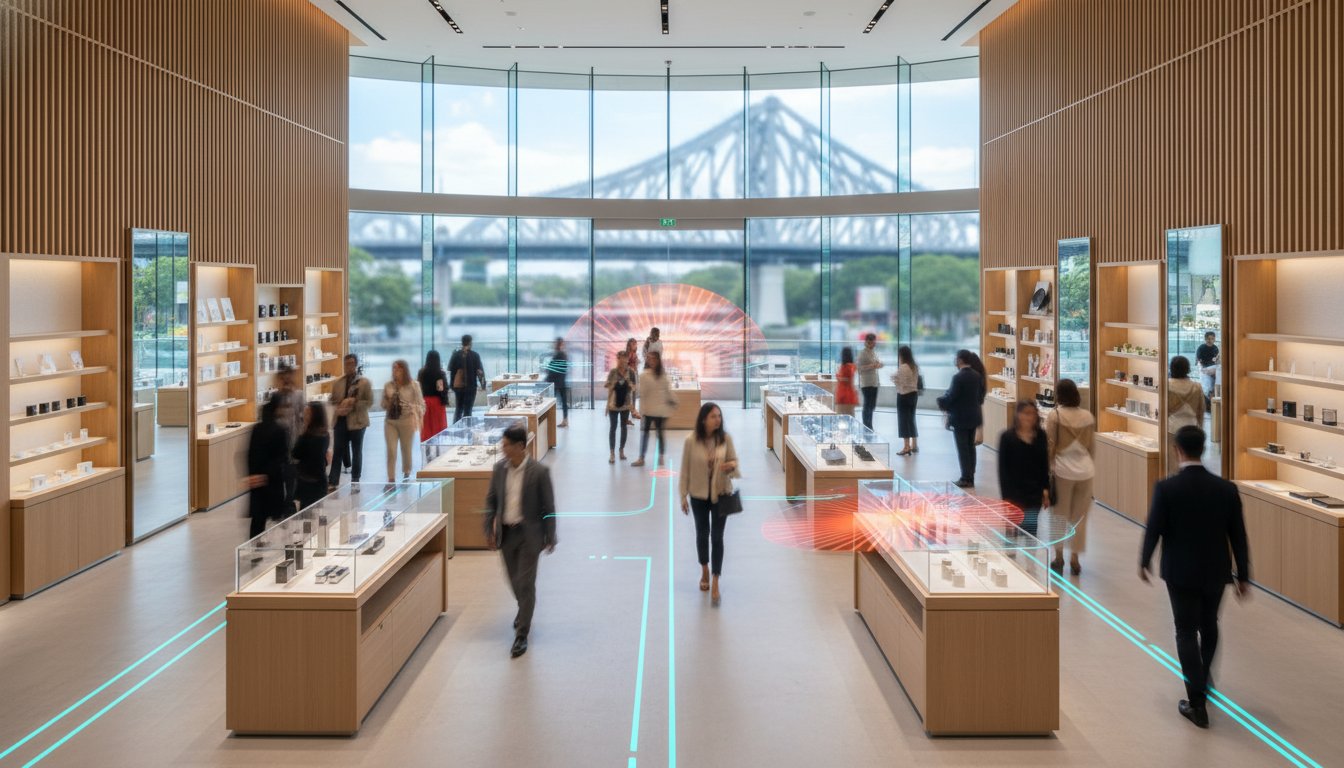
Spatial Analytics and Heatmapping
Heatmapping offers a visual representation of dwell time and engagement across the floor plan. AI identifies “hot spots” where visitors congregate and “dead zones” that fail to attract interest. This reveals exactly how to analyse customer traffic patterns to improve store performance. Path-to-purchase tracking follows the visitor from the entrance to the point of sale, highlighting where engagement drops off. If a specific display attracts 40% of traffic but results in zero dwell time, the visual merchandising requires adjustment. You can leverage these insights to refine product placement and maximise the value of every square metre.
Core Metrics: Transforming Raw Footfall into Actionable Business Intelligence
Raw numbers provide the foundation, but true intelligence comes from rigorous interpretation. To master how to analyse customer traffic patterns, you must move beyond simple counts and focus on KPIs that dictate operational efficiency. Every visitor represents a distinct opportunity. Identifying the specific drivers behind their movement allows you to stop guessing and start optimizing based on hard evidence. High-performing retailers prioritize metrics that reveal the “why” behind the “what.”
The Turn-in Rate serves as your first point of truth. It measures the percentage of passers-by who decide to cross your threshold. If 1,000 people walk past your Sydney CBD storefront and 50 enter, your 5% turn-in rate becomes the benchmark for your window display effectiveness. Improving this by just 1% can significantly impact your bottom line without increasing your marketing spend. It’s a direct reflection of how well your physical presence captures local attention and converts street traffic into store visits.
The Conversion Rate Equation
True performance visibility requires correlating your traffic data with Point of Sale (POS) records. High footfall coupled with low conversion rates highlights a critical operational failure. This usually stems from stock unavailability, poor layout, or inadequate service levels. It’s a missed opportunity that costs Australian businesses thousands in potential revenue every week. Use this precise formula to audit performance, especially in complex multi-entrance environments: (Total Transactions ÷ Total Unique Visitors) x 100.
If your conversion rate sits below your historical average, your data is signaling an immediate need for floor-level intervention. Don’t let high traffic numbers mask a failing sales process. By isolating conversion by hour, you can identify exactly when your team loses momentum or when the store environment becomes overwhelming for the shopper. This level of detail is essential when learning how to analyse customer traffic patterns for long-term growth.
Dwell Time and Service Intensity
Engagement translates directly to revenue. Data shows that increasing dwell time in high-margin zones by just 5 minutes can lead to a 12% to 18% rise in average basket value. However, longer stays aren’t always positive. They can reveal a “Service Gap” where traffic volume exceeds your staff’s capacity to assist. When customers wait too long for help, dwell time increases for the wrong reasons, often leading to abandoned purchases and walkouts.
Integrating these insights into your retail footfall analysis Australia strategy ensures you balance visitor volume with staff presence. It’s about ensuring every person who enters feels the brand’s value through seamless service. Precise spatial analytics help you identify these bottlenecks before they impact your reputation. You’re not just counting people; you’re decoding the human narrative within your space to drive sustainable, evidence-based success.
A Systematic Framework for Analysing In-Store Movement
Mastering how to analyse customer traffic patterns requires a structured approach that moves beyond raw numbers into strategic intelligence. This four-step framework ensures your data translates into measurable ROI for your Australian retail or commercial space.
- Step 1: Data Collection and Synchronisation. Accuracy begins at the perimeter. You must synchronise data from every entry point and internal zone to create a unified view of the visitor journey. Without this alignment, you risk double-counting or missing critical pathing details that define how people interact with your space.
- Step 2: Baseline Identification. Establish what “normal” looks like. By determining average traffic for specific day-parts, such as Thursday night shopping or Saturday morning rushes, you create a benchmark to measure future performance. This allows you to identify anomalies quickly.
- Step 3: Correlation Analysis. Connect the dots between traffic shifts and external variables. Did a 15% spike in footfall coincide with a local festival or a sudden change in Melbourne’s weather? Identifying these links prevents misattributing success or failure to the wrong factors.
- Step 4: Actionable Implementation. Data is only as valuable as the change it inspires. Use your findings to optimise staff rosters, ensuring high-traffic periods are fully supported, or adjust floor layouts to eliminate bottlenecks discovered through heat mapping.
Cleaning and Validating Your Data
Raw data is often noisy. To maintain integrity, you must exclude staff movements and non-buyer activities from your counts. Automated filtering ensures conversion rates reflect genuine customer intent rather than operational traffic. Regular sensor maintenance and professional people counter support are essential to prevent data drift and ensure hardware remains calibrated to 98% accuracy or higher.
Visualising Patterns with Analytics Software
Dashboards like FootfallCam V9 transform complex datasets into intuitive narratives. Managers use trend lines to spot long-term shifts or real-time occupancy snapshots to manage service levels instantly. For multi-site operators in Sydney or Perth, automated reporting provides a standardised view of performance. This visibility simplifies how to analyse customer traffic patterns across diverse locations simultaneously, removing the guesswork from regional management.
Optimising Operations: Turning Traffic Insights into Strategic Growth
Understanding how to analyse customer traffic patterns serves as the final bridge between raw data and measurable profit. It transforms a physical space from a static overhead into a dynamic, high-performance asset. By applying spatial intelligence, you move away from reactive management and toward a model of predictive precision. This data provides the empirical evidence needed to justify high-stakes decisions, such as site selection or rent negotiations. If a landlord quotes a premium rate of A$2,500 per square metre based on “high visibility,” your independent traffic logs allow you to verify if that visibility actually translates into viable footfall. Data is your strongest leverage in the Australian commercial property market.
Beyond external negotiations, these insights drive internal efficiency through rigorous A/B testing of store layouts. By using footfall as your primary metric, you can track how moving a high-margin category to the rear of the store affects the visitor journey. If the data shows a 12% increase in dwell time without a drop in entry rates, you’ve successfully optimised your floor plan based on evidence rather than intuition.
Staffing for Success
Aligning labour hours with predicted traffic waves is the most immediate way to protect your margins. Retailers often lose up to 15% of potential sales when peak-hour surges lead to long queues and “walk-aways.” By identifying these patterns, you can ensure maximum coverage when it matters most. Conversely, data reveals exactly when to scale back, reducing expensive “idle time” where staff are underutilised. This balance does more than just save money; it improves employee morale. Staff don’t feel the burnout of being overwhelmed, nor the boredom of empty shifts, creating a more stable and professional work environment.
Marketing ROI and Attribution
Every marketing dollar spent in Australia should be accountable. By monitoring the “lift” in traffic following a specific campaign, you can move beyond vague clicks and see physical results. Tracking “New vs. Returning” visitor metrics is particularly vital for gauging brand loyalty. A high percentage of returning visitors suggests your brand experience is resonating, while a surge in new visitors validates your recent advertising spend. This level of attribution ensures you’re only investing in strategies that move the needle.
In a competitive landscape, people counting technology is no longer an optional luxury; it’s a non-negotiable requirement for modern business. It provides the clarity needed to lead with confidence. Enquire about a data-driven footfall solution for your business to start mastering how to analyse customer traffic patterns today.
Future-Proof Your Physical Strategy
Success in the 2026 retail landscape depends on your ability to decode human movement with scientific precision. Moving beyond simple footfall counts allows you to understand the specific narrative of every visitor journey. By integrating AI-driven spatial analytics and focusing on high-impact metrics like dwell time, you transform raw movement into a strategic asset. Learning how to analyse customer traffic patterns provides the hard evidence needed to optimize staffing and store layouts with absolute confidence.
Footfall Australia has provided Australian businesses with precision data since 2004. Our proprietary AI technology achieves 98%+ counting accuracy, ensuring your strategy rests on a foundation of truth. We provide comprehensive local support and maintenance plans to keep your intelligence systems running at peak performance. It’s time to replace guesswork with actionable business intelligence. Request a Consultation for Your National Footfall Strategy to begin your transition toward data-led growth. Your space has a story to tell; we give you the tools to hear it.
Frequently Asked Questions
How do I distinguish between staff and customers in my traffic analysis?
You can distinguish staff from visitors by using Bluetooth Low Energy (BLE) tags or AI-based exclusion algorithms. Modern sensors filter out employees by identifying specific movement patterns or wearable tags, ensuring your data reflects genuine consumer behaviour. This allows for a 98% accuracy rate in conversion metrics by removing the noise created by staff replenishing shelves or patrolling the floor.
Can I analyse traffic patterns without installing new cameras?
Existing CCTV infrastructure can often be integrated with spatial analytics software via an API. This leverages your current hardware investment to understand how to analyse customer traffic patterns without the A$2,000 to A$5,000 cost of installing new 3D sensors. If video is unavailable, Wi-Fi signal tracking provides a foundation for measuring dwell times and repeat visitation rates across your site.
What is the most important KPI to track for a retail business?
Conversion rate stands as the most critical KPI for any retail environment. It measures the percentage of visitors who make a purchase, providing a direct link between foot traffic and revenue. By tracking this alongside average transaction value, businesses can identify whether a 15% drop in sales stems from lower visitor volume or a failure in the in-store sales process.
How accurate does my traffic data need to be for reliable analysis?
Reliable analysis requires a minimum accuracy threshold of 95% to ensure strategic decisions are based on fact. Data sets with errors exceeding 10% lead to incorrect staffing levels and flawed inventory planning. High-precision sensors maintain this standard even in challenging lighting or high-density crowds, providing the stable foundation needed for long-term spatial optimisation.
Does weather impact customer traffic patterns in Australia?
Australian weather significantly shifts footfall, with temperatures over 35°C often driving a 20% increase in traffic for air-conditioned shopping centres. Conversely, heavy rain in cities like Sydney or Brisbane can reduce high-street pedestrian volume by up to 30%. Integrating local Bureau of Meteorology data into your reporting helps you distinguish between poor marketing performance and external environmental factors.
How can I use traffic data to improve my store layout?
Use heatmaps to identify dead zones where customer engagement drops below 5%. By visualising the visitor journey, you can relocate high-margin products to high-traffic corridors or power aisles. Adjusting your layout based on these actionable insights often leads to a 12% increase in cross-category sales as customers navigate more of the floor space effectively.
Is it possible to track the entire customer journey through a large space?
Tracking a complete journey through a large precinct requires a seamless mesh of sensors that hand off data points as visitors move. This technology creates a unified narrative of movement across multiple zones or levels. It enables managers to see exactly where 65% of their visitors congregate and which entry points serve as the primary gateways for high-value segments.
How often should I review my traffic pattern reports?
Review your traffic pattern reports weekly to manage immediate staffing requirements and promotional performance. Strategic reviews should occur monthly to evaluate broader trends and the ROI of floorplan changes. Consistent monitoring ensures you catch a 5% shift in visitor behaviour before it impacts your quarterly bottom line, keeping your operations agile and responsive.