Justifying Investment in Retail Analytics: A Strategic Guide for 2026
Recent industry reports show that Australian retailers relying solely on POS data miss up to 40% of potential sales opportunities because they fail to measure the 60% of visitors who leave without a purchase. When you’re justifying investment in retail analytics for the 2026 fiscal year, you can’t afford to ignore the silent majority of your foot traffic. You likely agree that making high-stakes decisions on staffing or store layout feels risky when the only evidence you have is a bottom-line sales figure. It’s a common frustration to see operational costs rise while the true value of your visitor experience remains an unquantified variable.
This guide provides a bulletproof framework to build your business case by quantifying ROI and identifying hidden operational gaps. You’ll learn how to shift from gut-feel management to a strategy rooted in spatial intelligence and precise human behavior. We’ll explore how to optimize staff allocation and use actionable insights to lift conversion rates across your entire Australian store network.
Key Takeaways
- Identify the critical “blind spots” in your current reporting by understanding the gap between total visitor traffic and final transactions at the point of sale.
- Master the strategic framework for justifying investment in retail analytics by quantifying specific ROI drivers like conversion rate gains and labor optimization.
- Reframe analytics from a capital expense into a profit driver that reduces wage leakage and maximizes the value of every A$ spent on store operations.
- Follow a step-by-step process to audit data gaps and launch high-impact pilot programs that provide hard evidence for long-term strategic growth.
- Discover how to future-proof your Australian retail presence by integrating precision hardware with actionable intelligence to decode the visitor journey.
The Invisible Opportunity: Why POS Data Alone Is Insufficient
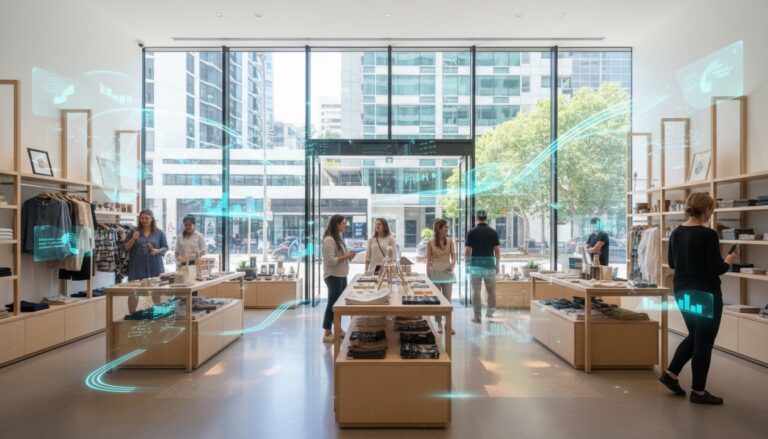
Most Australian retailers rely heavily on Point of Sale (POS) systems to judge the health of their business. While transaction data is vital, it remains a reactive metric. True retail analytics exists at the intersection of physical traffic and digital transaction data. POS data only captures the final step of a complex human journey. It ignores the thousands of potential customers who walked through your doors and left empty-handed. This represents the primary blind spot of traditional reporting; it tells you exactly what you sold, but it fails to tell you what you lost.
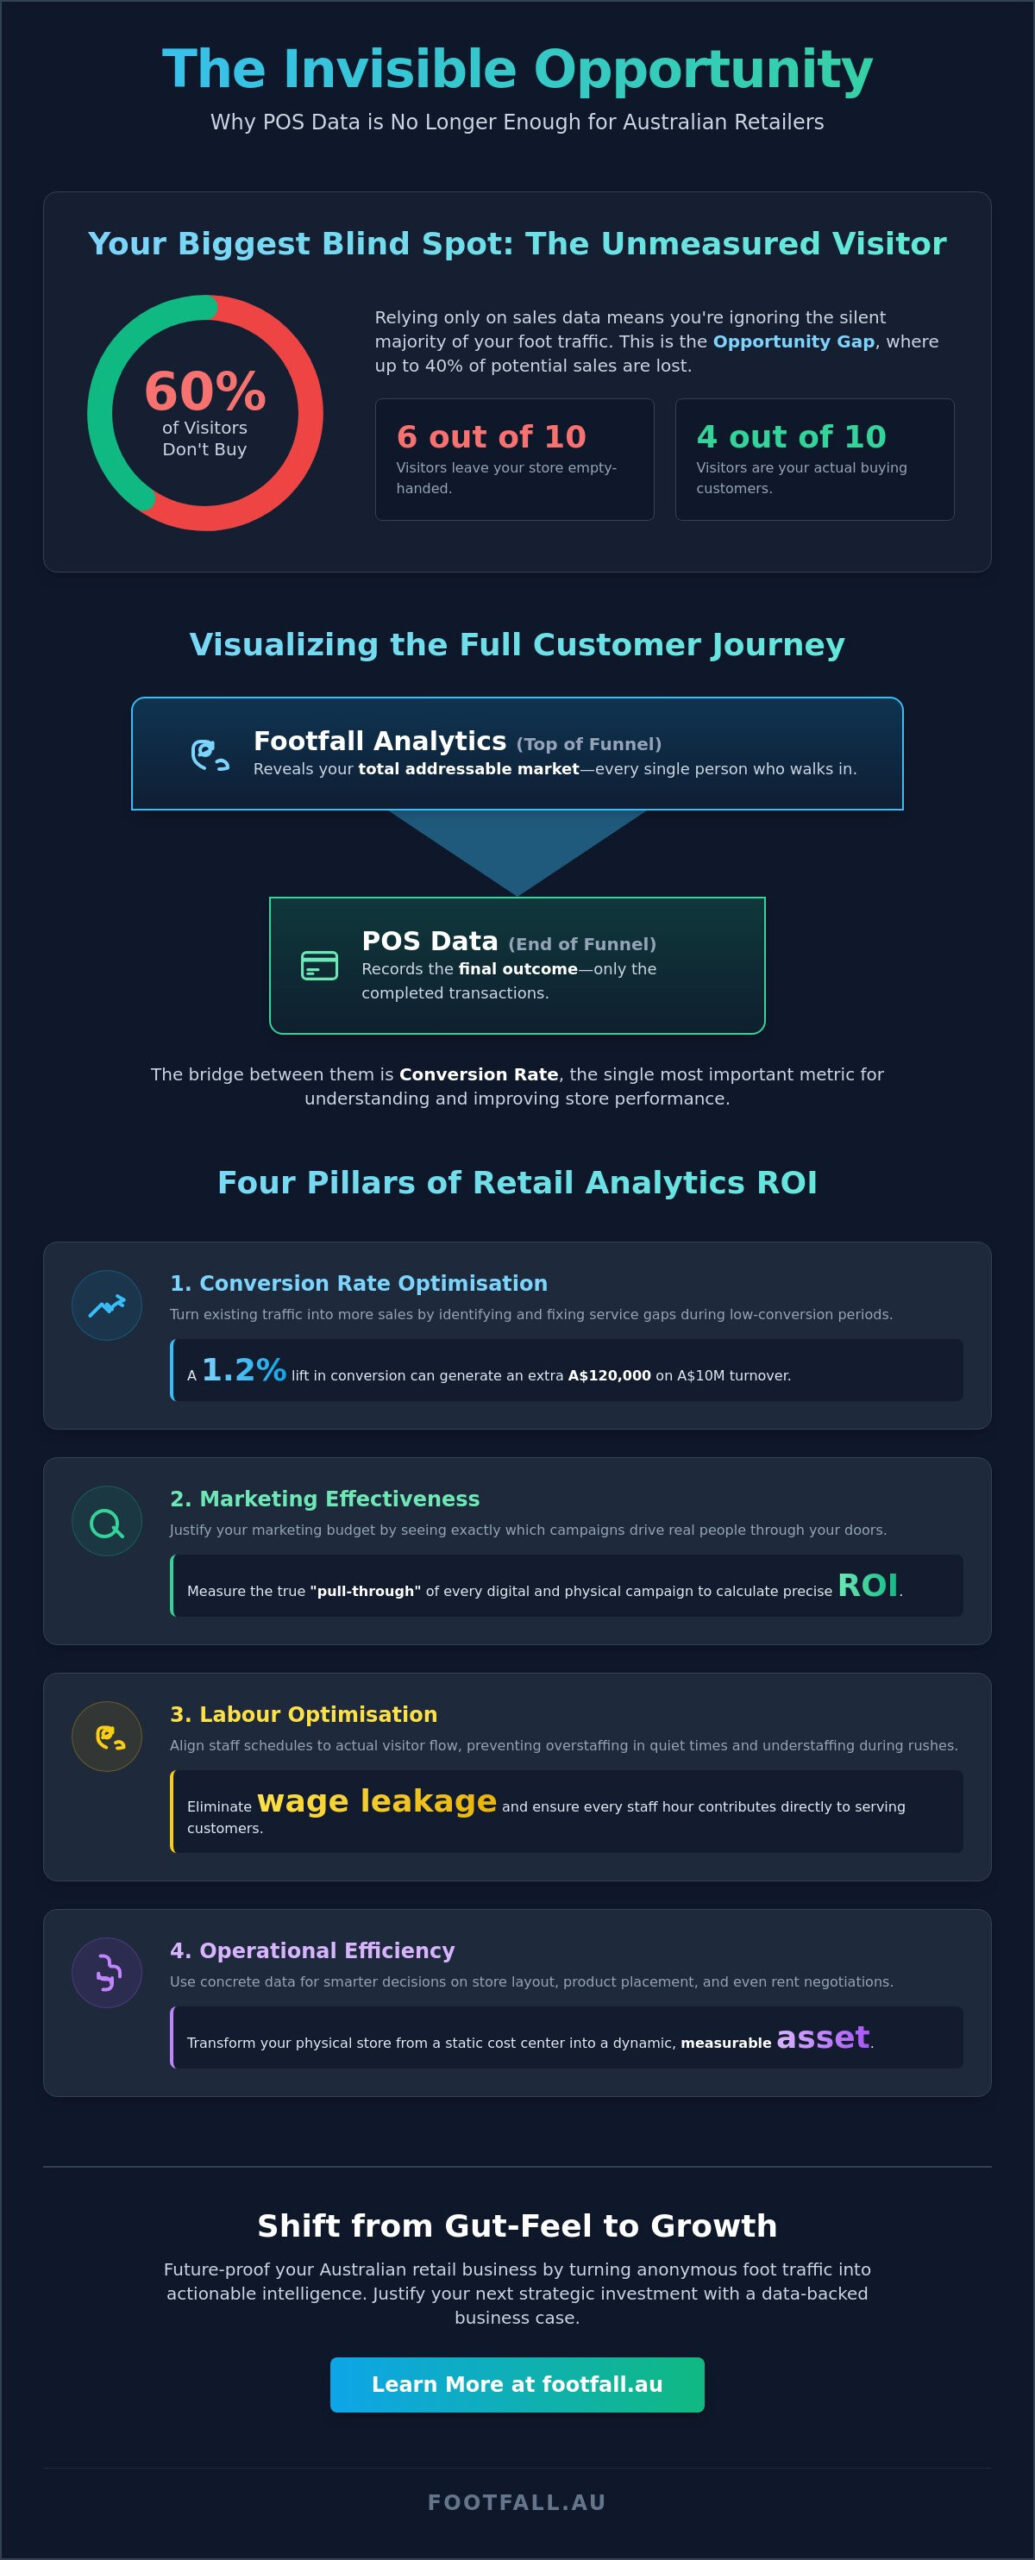
We define this discrepancy as the Opportunity Gap. In 2024, industry benchmarks indicate that in some sectors, up to 70% of store visitors leave without making a purchase. Identifying why these visitors didn’t convert is the first step in justifying investment in retail analytics. By 2026, understanding the visitor journey will be a requirement for survival. Retailers need to move beyond gut feel and embrace scientific precision to capture the revenue currently walking out the door. The shift toward 2026 demands a sophisticated understanding of human movement that POS systems simply cannot provide.
POS vs. Footfall Analytics: The Crucial Difference
POS data measures the end of the funnel. It’s a historical record of what happened at the till. Footfall analytics measures the top of the funnel, capturing the total addressable market inside your physical space. Conversion rate, the ratio of transactions to total visitors, is the most critical metric for any modern retail strategy and analysis. Without this context, a sales increase might mask a decline in store performance if traffic grew at a faster rate than transactions. For deeper strategic context on local market trends, you can explore retail footfall analysis Australia to understand how data-driven growth is being implemented across the country.
Identifying the Cost of Inaction
Operating without precise data carries a heavy financial burden. Misaligned staffing during unrecognised peak hours leads to long queues and abandoned baskets. In the Australian market, where labour costs are a significant overhead, scheduling even 15% more staff than required during quiet periods directly erodes your margins. Conversely, understaffing during a surprise rush results in poor service and lost sales. Justifying investment in retail analytics becomes simple when you quantify how much marketing spend is wasted on campaigns that drive traffic but fail to convert due to poor floor execution. The Cost of Inaction is the revenue lost to unoptimised store operations.
Quantifying the Impact: Four Pillars of Retail Analytics ROI
Moving beyond intuition requires a framework that translates foot traffic into financial outcomes. For Australian retailers heading into 2026, justifying investment in retail analytics rests on four specific pillars of value. These pillars turn raw sensor data into a roadmap for capital growth and waste reduction.
Conversion Rate Optimisation (CRO) serves as the first pillar. A 1.2% lift in conversion for a retail chain with A$10 million in annual turnover generates an additional A$120,000 in revenue without spending a cent more on customer acquisition. This efficiency allows businesses to extract maximum value from existing visitors. Marketing effectiveness acts as the second pillar. By measuring the physical “pull-through” of digital or local campaigns, managers can see exactly which A$1,000 spend actually brought bodies through the door. This transparency ensures that marketing budgets are justified by the return on investment seen at the point of sale.
Labour and operational efficiency form the final two pillars. Aligning staff schedules with actual visitor flow eliminates wage leakage during quiet periods, while data-backed insights empower retailers to negotiate fairer rent based on actual storefront exposure. These metrics transform the physical store from a static cost centre into a dynamic, measurable asset.
Turning Traffic into Transactions
Identifying low-conversion periods is the fastest way to improve the bottom line. If data shows high traffic on Tuesday mornings but low sales, it indicates a service gap rather than a lack of interest. Targeted staff training during these specific windows solves the problem. High-accuracy data from the FootfallCam Pro2 provides the granular detail needed to make these calls. Analysing dwell time also reveals how customers interact with store flow. When shoppers linger in a specific zone but don’t buy, it signals a need for better product placement or clearer signage. Precision in these micro-moments is what defines retail success in 2026.
Optimising Labour and Operational Costs
Fixed rosters often lead to overstaffing during lulls and understaffing during peaks. Dynamic staffing models use historical traffic data to predict when more hands are needed on deck. Implementing people counting technology helps managers identify underperforming zones and reallocate resources where they’ll have the most impact. This evidence-based approach is essential when justifying investment in retail analytics to stakeholders. It moves the conversation from “I think we need more staff” to “The data shows a 15% traffic surge every Thursday at 4 PM.” Retailers can optimise their operational footprint by ensuring every staff hour and every square metre of floor space contributes to the final transaction.
Overcoming the ‘Cost Center’ Perception: Analytics as a Profit Driver
Retailers often stall when faced with initial hardware and installation quotes. They see a line item for Capital Expenditure (CapEx) instead of a mechanism for growth. Viewing these systems as a cost center is a fundamental misunderstanding of modern retail mechanics. High-precision sensors aren’t just equipment; they’re the eyes of your business. Manual data collection is notoriously expensive. A 2023 industry study indicated that staff can spend up to 10 hours a week on manual reporting and data entry in non-automated environments. Automated systems eliminate this overhead, redirecting labour toward customer-facing roles that generate revenue.
When justifying investment in retail analytics, the focus must shift from the upfront price tag to the recurring cost of missed opportunities. A single missed sale due to poor staff distribution can cost an Australian fashion retailer upwards of A$150 in lost basket value. Over a year, these invisible losses dwarf the one-time cost of precision hardware. Leading retailers use these systems to turn insights into profits by aligning staff schedules with actual foot traffic peaks, ensuring every visitor has a high probability of conversion.
The Long-Term Value of Data Integrity
Precision is the only metric that matters. Sensors boasting 99.5% accuracy provide the baseline for valid financial forecasting. Using “cheap” alternatives often results in “dirty data” that suggests a store is busy when it’s actually empty. This leads to poor stock decisions and wasted labour costs. Maintaining this accuracy requires consistent people counter support to ensure system health. Without reliable data, your strategic decisions are based on fiction, not fact. High-quality sensors are a one-time investment in truth that pays dividends through reduced operational waste.
Scaling Analytics Across the Enterprise
A single installation provides value far beyond the shop floor. Marketing teams use heatmaps to validate campaign spend and window display effectiveness. Operations managers use dwell time data to optimize queue management and reduce walk-outs. Finance departments use conversion rates to set realistic, evidence-based KPIs for store managers. A centralised dashboard allows national managers to compare performance across Australian states instantly. For those with older systems, a “Legacy Swap Out Plan” allows for a structured transition to modern tech. This ensures justifying investment in retail analytics becomes a cross-departmental win rather than a siloed expense.
Building Your Business Case: A Step-by-Step Framework
Securing board approval for new technology requires a shift from intuition to evidence. When justifying investment in retail analytics, your proposal must bridge the gap between technical capability and fiscal responsibility. Start by auditing your current data gaps. Identify the “blind spots” where your team currently guesses, such as why a high-traffic Saturday resulted in low conversion. These gaps represent lost revenue that a structured analytics framework can recover.
Don’t attempt a national rollout immediately. Run a 90-day pilot program in a single high-traffic location to establish a baseline of truth. This localized data allows you to calculate the potential revenue lift from a 1% increase in conversion, a figure that often translates into tens of thousands of dollars for Australian retailers. By presenting a clear “Payback Period,” which is the time it takes for the system to pay for itself through recovered sales, you transform the purchase from a cost into an asset. Align this project with 2026 corporate goals like “Digital Transformation” to ensure it’s viewed as a strategic necessity rather than a departmental luxury.
Defining Your Key Performance Indicators (KPIs)
Select 3 to 5 metrics that align directly with board-level financial objectives. While total sales figures are useful, they’re lagging indicators that don’t explain the “why” behind the numbers. Focus instead on “Visitors Per Labour Hour” (VPLH). This metric is more effective than total sales because it measures operational efficiency. It tells you if you’re overstaffed during lulls or losing sales during peaks. High-precision people counting systems Australia provide the raw data needed to hit these targets, turning foot traffic into an actionable KPI that managers can influence in real-time.
The ROI Calculation: A Practical Example
Consider a hypothetical scenario where a retailer invests A$5,000 in a single-store analytics setup. If that store generates A$1 million in annual revenue with a 20% conversion rate, a mere 1% improvement in conversion adds A$50,000 in recovered sales. This represents a 900% return on the initial hardware and software cost. Beyond the hard numbers, factor in soft benefits like improved staff morale; employees feel more supported when rosters match actual customer demand. To calculate your specific potential, use this formula: (Gain from Investment – Cost of Investment) / Cost of Investment.
Ready to eliminate the guesswork in your retail strategy? Book a data-driven consultation with our team to start your pilot program today.
Future-Proofing with Footfall Australia: Precision Hardware Meets Actionable Intelligence
Footfall Australia serves as the national partner for data-driven retail, offering a bridge between physical store traffic and digital-grade insights. By integrating FootfallCam Pro2 hardware with the V9 Software suite, businesses gain a unified view of their operations. This system is engineered specifically for the Australian retail landscape, ensuring reliability across diverse environments from high-street boutiques in Melbourne to expansive shopping centres in Perth. Securing budget for new technology requires a clear path to profitability. Footfall Australia simplifies the process of justifying investment in retail analytics by providing a system that pays for itself through optimised staffing and improved conversion rates.
Hardware Built for Accuracy
AI-driven counting represents a generational leap over traditional infrared sensors. While infrared tech often struggles with groups or high-density traffic, the FootfallCam Pro2 uses 3D stereoscopic vision to achieve accuracy rates between 95% and 98%. This precision is vital for stakeholders who require reliable data to make high-stakes financial decisions. For businesses looking to lower entry costs, the FootfallCam Centroid allows you to leverage existing CCTV infrastructure, turning standard security cameras into intelligent sensors through advanced AI processing. Local Australian support and maintenance plans ensure that systems remain online and calibrated, providing a level of continuity that offshore providers can’t match. Having a local team means faster response times for hardware queries, keeping your data stream uninterrupted.
V9 Software: From Data to Strategy
The V9 Software suite acts as the brain of the operation, transforming raw metrics into a narrative of human movement. It delivers automated, customisable reports tailored for different management tiers, from floor supervisors to executive boards. Real-time data feeds allow for immediate operational adjustments, such as reallocating staff during an unexpected rush or opening additional registers before queues impact the customer experience.
Detailed footfall data analysis helps you understand the “why” behind the “what,” revealing how store layouts and marketing displays influence buyer behaviour. This level of clarity is central to justifying investment in retail analytics, as it replaces intuition with evidence-based strategy. The software makes it easy to track the visitor journey, identifying high-dwell zones and underutilised corners of the store. This intelligence is vital for 2026 strategies where every square metre of floor space must justify its cost through engagement or sales.
Footfall Australia provides the technological foundation required to thrive in a competitive market. It isn’t just about counting heads; it’s about understanding the visitor journey to drive sustainable growth. Contact our team today for a tailored ROI assessment to see how these insights can transform your business’s bottom line.
Secure Your Competitive Advantage Through Data Precision
Relying on POS data alone leaves your business blind to the visitor journey and missed opportunities on the shop floor. True growth in 2026 requires a shift from gut feeling to evidence-based strategy. By quantifying the gap between foot traffic and final sales, justifying investment in retail analytics transforms from a budgetary hurdle into a clear roadmap for profit. Footfall Australia has empowered local retailers since 2004 with AI-driven technology that achieves 99.5% accuracy, ensuring every decision you make is supported by reliable intelligence.
Precision hardware combined with comprehensive local support and maintenance plans removes the risk from your technological transition. You don’t have to guess how many customers walked past a display or why conversion dipped on a Tuesday afternoon. With the right spatial analytics, these insights become actionable levers for your success. It’s time to replace uncertainty with a foundation of high-resolution data that drives long-term ROI across your entire Australian store network.
Request a Tailored ROI Assessment for Your Retail Business
Take the first step toward a more transparent and profitable future for your retail operations today.
Frequently Asked Questions
How long does it typically take to see a return on investment in retail analytics?
Most retailers achieve a full return on investment within 6 to 12 months of implementation. This timeline depends on how quickly management acts on the insights provided. For instance, a 5% increase in conversion rates often covers the initial hardware costs within the first two quarters. By identifying peak traffic periods, you can optimize staff rosters to reduce labor waste and capture missed sales opportunities immediately.
Can footfall analytics help me negotiate better rent for my retail spaces?
You can use footfall analytics to negotiate more favorable lease terms by providing objective proof of store performance. If a landlord claims a high-traffic premium, your data can verify if those visitors actually enter your store. Retailers in Australian shopping centres have successfully used these metrics to request rent reductions when data shows a 15% decline in precinct traffic over a 12-month period.
Is it possible to integrate footfall data with my existing POS system?
Integrating footfall data with your existing POS system is a standard procedure that unlocks the conversion rate metric. Our API connects with major Australian retail platforms to sync sales transactions with visitor counts automatically. This integration allows you to see the exact correlation between store entries and completed purchases. It transforms raw traffic numbers into a strategic tool for justifying investment in retail analytics across your entire network.
What is the most important metric to track when justifying this investment?
The conversion rate is the most critical metric because it measures the efficiency of your store operations. While total footfall shows potential, the conversion rate tells you how many visitors actually made a purchase. Tracking this allows you to distinguish between a marketing problem and an operational one. A 2% improvement in conversion can lead to a double-digit increase in revenue without spending more on customer acquisition.
How does retail analytics improve the customer experience if they don’t know they are being counted?
Analytics improve the customer experience by ensuring your store is adequately staffed during the busiest hours. When you understand visitor flow, you can eliminate bottlenecks and reduce wait times at checkout counters. Customers enjoy a seamless journey because the store layout reflects their natural movement patterns. These operational refinements create a more relaxed shopping environment even though the data collection remains completely anonymous and non-intrusive.
Do I need to hire a data scientist to understand the analytics reports?
You don’t need to hire a data scientist to interpret our reports. The Footfall Australia dashboard translates complex spatial data into clear, actionable insights that any store manager can understand. We focus on visual heatmaps and simple trend lines that highlight performance gaps. This accessibility ensures that your team spends less time crunching numbers and more time implementing strategies that drive growth.
What happens if my store layout changes frequently; will the sensors still be accurate?
Modern AI-powered sensors maintain high accuracy even when you change your store layout or move shelving units. The technology tracks the visitor journey through overhead perspectives, so floor-level adjustments don’t obstruct the count. If you undergo a major structural renovation, we can remotely recalibrate the zones to match your new floor plan. This flexibility ensures your data remains consistent and reliable throughout the entire 2026 retail cycle.
How does Footfall Australia support the system after the initial installation?
Footfall Australia provides comprehensive post-installation support including remote system monitoring and regular data health checks. Our local technical team is available to help you interpret new trends or troubleshoot hardware issues. We ensure your system stays updated with the latest firmware to maintain precision. This ongoing partnership is a key component when justifying investment in retail analytics, as it guarantees long-term system reliability and data integrity.