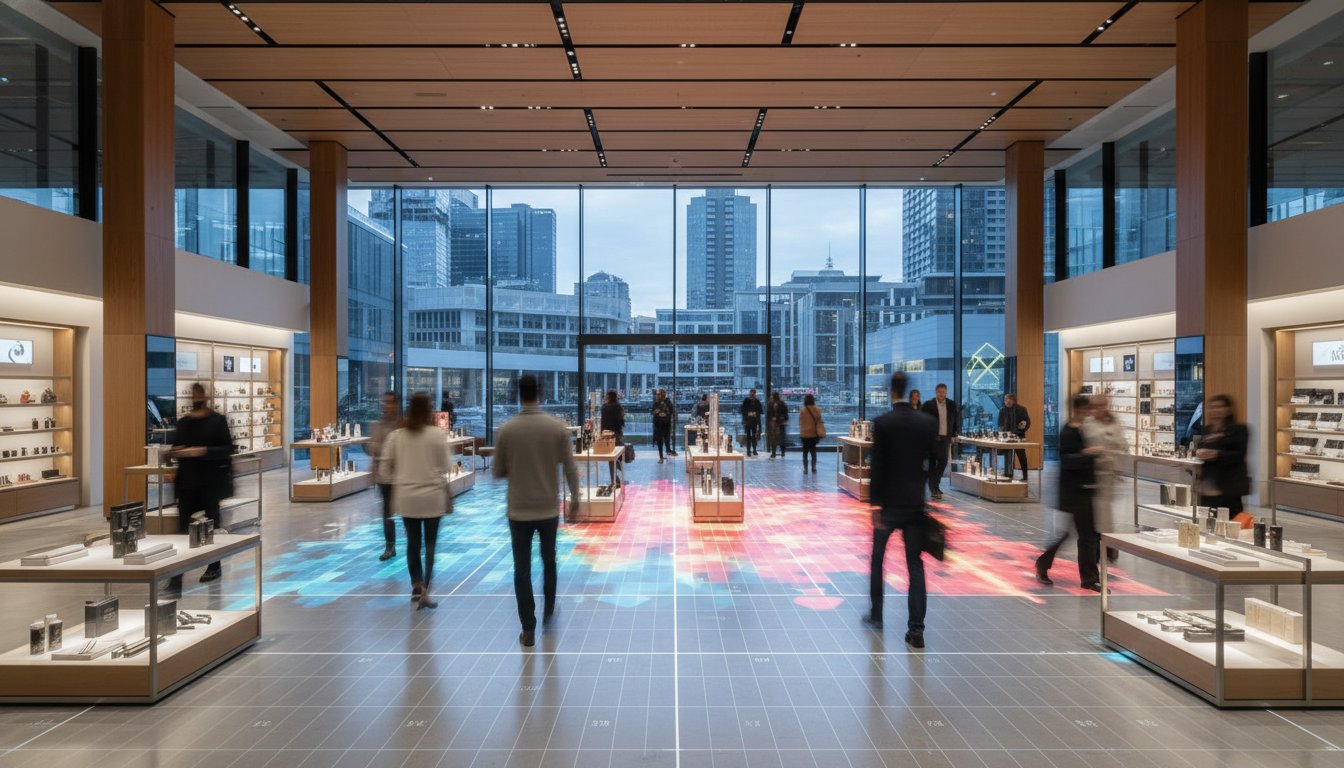
Heat Mapping Technology for Retail: The 2026 Strategic Guide to Store Optimisation
Strategic store layout adjustments informed by data can lead to a 20% increase in sales per square foot. Many retailers currently face the frustration of declining in-store conversion rates or the uncertainty of which product displays actually drive engagement. Implementing heat mapping technology for retail transforms these invisible customer paths into actionable insights. It allows you to move beyond intuition and toward empirical evidence that supports your bottom line.
It’s clear that managing a physical space in 2026 requires more than just a good eye; it demands precision. This guide will show you how to master the science of customer behavior to transform your store layouts and maximize retail ROI. We’ll explore how to identify underperforming dead zones, validate your visual merchandising strategies with real-time data, and optimize staff placement based on high-traffic zones. You’ll gain the clarity needed to turn every square foot of your floor plan into a high-performing asset.
Key Takeaways
- Learn how heat mapping technology for retail has evolved from simple footfall counting to sophisticated behavioral analytics that visualize customer dwell time.
- Understand the role of AI-powered sensors and edge computing in distinguishing human movement from objects while maintaining strict data privacy standards.
- Discover how to identify high-margin Hot Zones and diagnose underperforming Cold Zones to improve product placement and store lighting.
- Gain a practical framework for launching a pilot program and using motion data to optimize staff placement during peak traffic periods.
- Explore how integrating the FootfallCam V9 software suite provides national retail chains with the intuitive reporting required for data-driven store optimization.
Understanding Heat Mapping Technology for Retail in 2026
Heat mapping technology for retail is no longer a futuristic concept; it’s a fundamental requirement for physical store management. At its core, a heat map is a visual synthesis of customer dwell time and movement flow. By aggregating thousands of individual data points, it transforms the complex reality of human movement into a readable, color-coded narrative. This process involves Understanding Heat Mapping Technology as a method for identifying exactly where engagement happens and where it fails. For a store manager, visual data is far more intuitive than raw spreadsheets. It provides an immediate, objective view of store performance that supports confident decision-making.
Modern retail operates in an omni-channel environment where the physical store must be as measurable as a website. Heat mapping bridges this gap by providing the same level of granular detail found in digital analytics. It allows retailers to treat their floor space as a dynamic interface that can be tested, measured, and refined. When you can see how customers navigate your aisles, you can align your physical environment with their behavioral trends.
The Shift from Footfall to Behavioural Metrics
Legacy systems often stop at the entrance. Recording that 500 visitors entered provides a baseline, but this figure lacks the depth needed for true optimization. In 2026, competitive retail requires a deeper understanding of the “path to purchase” through precise spatial data points. It isn’t enough to know people are in the store; you need to know why they’re ignoring certain sections or why they’re clustering in others. Behavioural heat mapping serves as a tool for empirical store diagnostics. It identifies the specific friction points that prevent a visitor from becoming a customer. This shift from counting heads to analyzing actions allows for several strategic advantages:
- Identifying bottlenecks: Spotting areas where layout design restricts natural flow.
- Measuring display effectiveness: Seeing exactly how many people stop at a promotional end-cap.
- Validating floor plans: Using evidence rather than intuition to decide where high-margin items belong.
Visualising Data: What the Colours Actually Mean
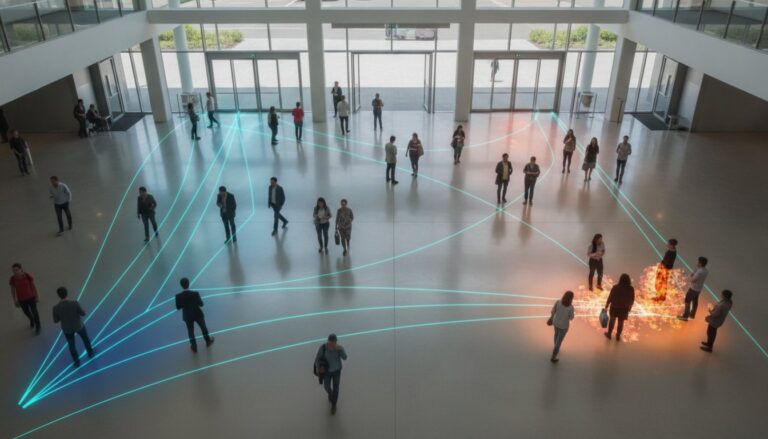
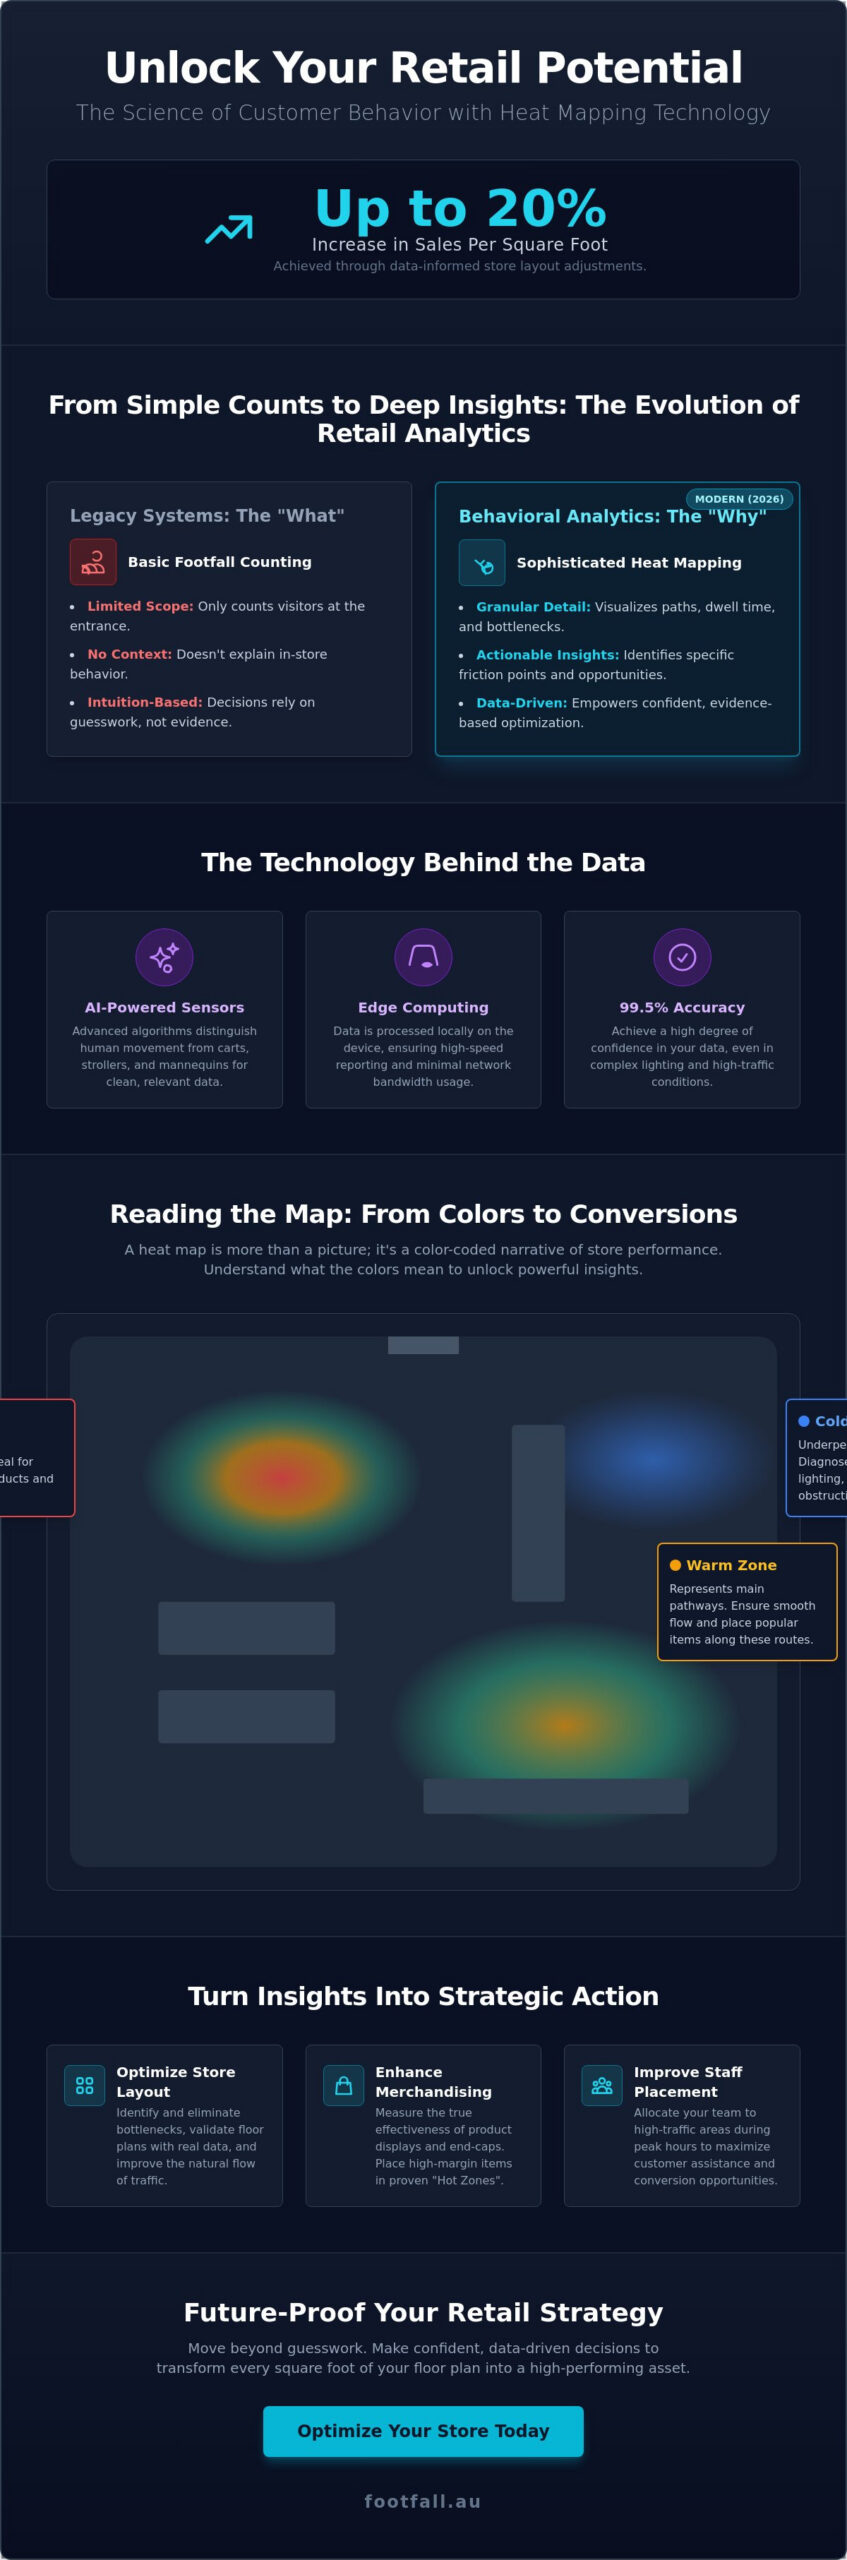
The color spectrum used in heat maps provides a logical hierarchy of store performance. High-intensity red zones indicate “hot” areas with peak engagement or heavy traffic density. Conversely, blue areas suggest “cold” zones where customer interest is low or the space is underutilized. Understanding the distinction between different types of maps is essential for accurate analysis. A traffic density map shows where people walk, which is excellent for identifying main thoroughfares. A dwell time map, however, shows where people actually stop and interact with products.
Real-time visualizations allow for immediate operational adjustments. If a specific display shows as a “cold zone” during a major launch, managers can investigate the cause immediately. The issue might be poor lighting, an obstructed view, or confusing signage. By reacting to visual data rather than waiting for end-of-month reports, retailers can salvage underperforming promotions and ensure their staffing levels match the actual density of the crowd.
The Mechanisms of Modern Retail Heat Maps: AI, Sensors, and Analytics
The precision of modern heat mapping technology for retail relies on the sophisticated interplay between hardware and artificial intelligence. Unlike legacy systems that struggled with shadows or inanimate objects, 2026-era sensors use advanced algorithms to distinguish human movement from shopping carts, strollers, and mannequins. This distinction is critical for maintaining a 99.5% accuracy rate, especially in complex environments with varying lighting conditions or high-density crowds. By utilizing edge computing, these devices process data locally on the hardware itself. This approach ensures high-speed reporting while significantly reducing the bandwidth required to transmit information to a central dashboard.
Research into AI and Sensors in Heat Mapping demonstrates that the shift toward automated decision-making technologies requires robust data foundations. Retailers can now achieve this depth without a total infrastructure overhaul. Using the FootfallCam Centroid, businesses can repurpose their existing CCTV networks into powerful analytical tools. This flexibility allows for the rapid deployment of heat mapping technology for retail across large estates, transforming standard security feeds into strategic assets that observe and interpret human behavior in real time.
Dedicated Sensors vs. CCTV Integration
Choosing between dedicated hardware and software integration depends on your specific accuracy requirements. The FootfallCam Pro2 is engineered for high-precision tracking, offering superior performance in challenging architectural layouts. While AI boxes like the Centroid offer a cost-effective way to scale analytics using standard cameras, dedicated sensors often provide longer operational longevity and lower long-term maintenance. Both approaches empower managers to move away from intuition and toward data-driven store optimization.
Privacy by Design and Australian Standards
Data integrity must coexist with consumer trust. Modern people counting technology is built on a “privacy by design” philosophy, anonymizing data at the source. This means human silhouettes are detected and tracked without ever capturing identifiable facial features. As of January 2026, with the enforcement of the EU AI Act and updated Australian privacy expectations, non-facial recognition technology has become the industry standard. This ensures your operations remain compliant with the Australian Privacy Act while providing the empirical evidence needed to refine your floor plan. If you’re looking to maximize your existing resources, consider upgrading your current CCTV system to gain these behavioral insights without compromising visitor anonymity.
Deciphering the Data: Identifying Hot Zones, Cold Zones, and Dead Spaces
Data is only valuable if it leads to specific, positive changes in operations. Once heat mapping technology for retail is deployed, the focus shifts to interpreting the color-coded visualizations of human behavior. Hot zones represent areas where engagement is highest, often providing an equalizer for physical stores looking to compete with the precision of digital analytics. By identifying these high-traffic corridors, managers can strategically place high-margin products where they will receive maximum exposure from the natural flow of visitors.
Conversely, identifying cold zones allows for a structured audit of the store’s “dead spaces.” These areas represent expensive floor space that currently yields a low return on investment. Dwell time data is particularly effective here, as it measures how long a customer lingers in front of a window display or a specific shelf. Analyzing this metric helps determine if a window display successfully stops foot traffic or if passersby are simply walking past. If dwell time is high but conversion is low, the issue is likely the product selection or price; if dwell time is non-existent, the problem is the layout, lighting, or basic visibility. This heat mapping technology for retail turns these invisible failures into clear, empirical evidence.
Hot Zone Optimisation: Maximising Prime Real Estate
High-traffic areas are the lifeblood of retail profitability. Placing promotional items in these naturally occurring “hot” corridors ensures they aren’t missed by the majority of visitors. Beyond direct sales, data often reveals a “halo effect” where an anchor display increases engagement for surrounding shelves. Path analysis also uncovers cross-merchandising opportunities. For example, if data shows customers frequently move between the footwear and accessories sections, a strategic bridge display can capture impulse purchases that were previously lost to a fragmented layout.
Reclaiming the Cold Zones
A cold zone isn’t a permanent failure but a diagnostic starting point. When an area shows low activity, managers should use a structured approach to investigate the cause. This is where footfall data analysis becomes essential for identifying if structural bottlenecks are preventing customers from reaching those sections. Consider the following diagnostic questions during your audit:
- Accessibility: Is the physical path to this zone obstructed or confusing?
- Visual Appeal: Does the lighting or signage fail to draw the eye from a distance?
- Product Relevance: Is the stock in this area misaligned with the demographic of the high-traffic zones?
Using A/B testing allows you to validate changes in signage or product categories with empirical evidence. By systematically addressing these zones, you transform underperforming square footage into active, revenue-generating space. This measured approach ensures that every square meter of the store is optimized for maximum ROI.
Strategic Implementation: From Data Collection to Store Layout Optimisation
Transitioning from data collection to strategic action requires a methodical approach. A heat mapping pilot program allows you to test hypotheses on a small scale before committing to a full-estate rollout. By integrating heat mapping technology for retail with your existing point-of-sale data, you gain a transparent view of your conversion funnel. This combination reveals where traffic fails to convert into transactions, allowing you to isolate whether the issue is product pricing, staff engagement, or layout friction. It’s about turning observation into a blueprint for growth.
Queue management is another critical area where empirical data reduces friction. Long dwell times at the point of sale often lead to basket abandonment. Heat maps identify these bottlenecks in real time, enabling managers to open additional registers before the customer experience is compromised. This proactive stance ensures that the final step of the customer journey remains seamless and efficient.
Data-Driven Store Layout Design
Effective layout design respects the “Decompression Zone,” the first five metres where customers adjust to the store’s environment. Heat maps often show that placing high-priority items here is a mistake, as customers typically bypass them while orienting themselves. By analysing movement paths, you can eliminate “ping-ponging,” where customers are forced into erratic, inefficient routes. This logical flow ensures every aisle receives consistent exposure. Validating the ROI of store refurbishments becomes simple when you compare pre- and post-implementation heat maps, providing a clear narrative of how the new layout improved engagement.
Staffing Optimisation for the Australian Market
In the Australian retail sector, high labour costs make efficiency a primary objective. Research indicates that data-driven workforce management using heat mapping can result in labour efficiency gains of up to 30%. Instead of scheduling staff based solely on historical sales, you can match team levels to real-time traffic density. This ensures floor staff are deployed to high-dwell zones where they can actively influence purchase decisions. Identifying “quiet” periods allows for reduced overheads without impacting service quality. To start refining your operational efficiency, you can access advanced behavioural reporting tools tailored for the Australian market.
Future-Proofing Your Retail Strategy with Footfall Australia
Successful integration of heat mapping technology for retail requires more than just high-quality hardware. It demands a software ecosystem that can scale with your business and a support network that understands the specific nuances of the Australian market. Footfall Australia provides this foundation, ensuring that your investment in people counting systems in Australia translates into sustainable operational growth. By moving beyond simple data collection, retailers can begin to leverage predictive analytics to anticipate behavioral shifts before they impact the bottom line. This forward-thinking approach positions your brand as an observant and objective leader in the physical retail space.
The transition from reactive management to proactive strategy is a hallmark of modern store optimization. When you treat physical presence as a sequence of human actions rather than just a set of statistics, you gain the ability to interpret the narrative of movement within your space. This clarity allows for long-term stability in an increasingly shifting retail environment. Using empirical evidence to guide your future developments ensures that every decision, from regional expansion to individual store refurbishments, is backed by a foundation of expertise and reliability.
The FootfallCam V9 Advantage
The FootfallCam V9 software suite acts as the central intelligence hub for national retail chains. It provides unified dashboards that allow executives to compare performance across multiple locations simultaneously. This visibility is essential for identifying which regions are successfully adopting new layout strategies and which require additional attention. Customizable reporting features allow you to filter data by specific metrics, such as dwell time or peak traffic periods, ensuring the right data reaches the right stakeholders. Automated reporting saves hours of manual analysis by delivering synthesized insights directly to management teams. This ensures that stakeholders receive high-utility information without the need for extensive data processing, empowering them to make faster, evidence-based decisions.
Expert Support and National Coverage
Maintaining the accuracy and reliability of your data is paramount for long-term ROI. This is why comprehensive people counter support is a core component of the Footfall Australia offering. Our local partner network ensures seamless installation and prompt maintenance across the country, regardless of store location. This infrastructure protects data integrity, ensuring that your strategic decisions are always based on precise, empirical evidence rather than intuition. As the retail landscape continues to evolve toward 2030, having a partner that prioritizes technical innovation and practical application is essential. The combination of the FootfallCam Pro2 sensors and the V9 software creates a seamless technical system that empowers users at every level of the organization.
Contact Footfall Australia today to schedule a tailored retail audit and discover how heat mapping technology for retail can transform your physical environment into a data-driven success story.
Transforming Movement into Measurable Growth
Adopting heat mapping technology for retail marks the transition from speculative store management to a strategy defined by precision. By identifying the specific friction points in your layout and reclaiming underutilised cold zones, you ensure that every square metre of your floor space contributes to your ROI. You now have the framework to align your physical environment with the empirical reality of customer behaviour, moving beyond intuition to make decisions based on what is actually happening on the shop floor.
Footfall Australia provides the technical foundation required for this level of store optimisation. Our AI-powered FootfallCam Pro2 delivers 99.5% accuracy even in high-density environments. Because we utilise edge computing, your data remains 100% compliant with the Australian Privacy Act and GDPR standards. With a national support network ready to assist your estate, you can implement these sophisticated systems with total confidence in their long-term reliability.
Optimise your store layout with Footfall Australia today and turn your operational challenges into a blueprint for sustainable success. It’s time to let data lead the way toward a more efficient and profitable retail future.
Frequently Asked Questions
Is heat mapping technology for retail compliant with Australian privacy laws?
Yes, modern systems are fully compliant with the Australian Privacy Act and updated 2026 regulations. They utilise “privacy by design” principles to anonymise data at the source. By processing information locally through edge computing, these systems ensure that no personally identifiable information is ever captured or stored.
Can I use my existing security cameras for retail heat mapping?
You can leverage your current infrastructure by integrating the FootfallCam Centroid. This AI-driven device connects to standard IP cameras and transforms their feeds into sophisticated analytical tools. It’s an efficient way to deploy heat mapping technology for retail across an entire estate without the need for a total hardware overhaul.
What is the difference between a footfall counter and a heat map?
A footfall counter provides a quantitative measure of how many people enter or exit a store. A heat map offers a qualitative visualisation of customer behaviour once they’re inside. While counters track volume, heat maps track spatial movement, dwell time, and engagement levels with specific product displays.
How accurate is heat mapping in high-traffic retail environments?
Precision in high-density areas is achieved through AI-powered sensors like the FootfallCam Pro2, which maintains 99.5% accuracy. These sensors use advanced algorithms to distinguish human silhouettes from inanimate objects like shopping carts or mannequins. This level of detail ensures your data remains reliable even during peak trading hours.
Does heat mapping track individual customers or anonymised data?
The technology tracks anonymised movement patterns rather than individual identities. It uses non-facial recognition technology to observe human presence as a sequence of actions. This ensures that while you gain deep insights into behavioural trends, the anonymity of every visitor is strictly preserved.
How much does it cost to install a retail heat mapping system in Australia?
Implementation costs are determined by several factors, including the store’s square footage, hardware requirements, and the level of software analytics desired. Because every retail environment is unique, pricing is provided on a quote-by-quote basis. Retailers should check with a specialist to receive a tailored assessment for their specific locations.
Can heat mapping help me improve my store conversion rate?
Heat mapping technology for retail identifies the “cold zones” where customer engagement is lacking. By revealing these bottlenecks, you can make data-driven adjustments to your layout or signage to encourage better flow. When these behavioural insights are used to optimise product placement, the result is often a direct improvement in conversion metrics.
How long does it take to see actionable results from heat map data?
Initial movement patterns are visible within 24 hours of the system going live. However, identifying reliable behavioural trends typically requires a full week of data to account for daily fluctuations in traffic. Most retailers find that a full monthly cycle provides the empirical evidence needed to make significant strategic layout changes.