Common Misinterpretations of Footfall Metrics: Uncovering Retail Analytics Pitfalls
Why does a dramatic spike in store traffic so often fail to show up in your register receipts? It’s deeply frustrating to watch gross entry counts climb while conversion rates stall, especially when misleading peak reports leave your floor staff stretched thin during low-yield hours. These operational blind spots stem from common misinterpretations of footfall metrics, where raw physical movement is mistaken for genuine purchasing intent.
Uncovering these pitfalls allows you to extract actionable intelligence from your customer traffic data rather than relying on guesswork. You’ll discover how to distinguish gross visitor volume from high-value commercial traffic, align staffing models with actual conversion windows, and integrate sensor data directly into sales analytics. Ahead, we break down the critical traps distorting your store data and the modern measurement strategies needed to drive dependable retail performance.
Key Takeaways
- Identify the most common misinterpretations of footfall metrics to prevent mistaking raw doorway entries for qualified commercial sales opportunities.
- Eliminate analytical distortion by filtering out non-buyer foot traffic, including staff movements, delivery personnel, and multi-person family groups.
- Rethink labor allocation by separating customer confusion from genuine dwell engagement, scheduling floor teams around high-yield transaction windows rather than gross door counts.
- Connect precision AI hardware with your transaction streams through FootfallCam V9 Software to establish clear visibility into true store conversion efficiency.
Common Misinterpretations of Footfall Metrics: The Raw Traffic Fallacy
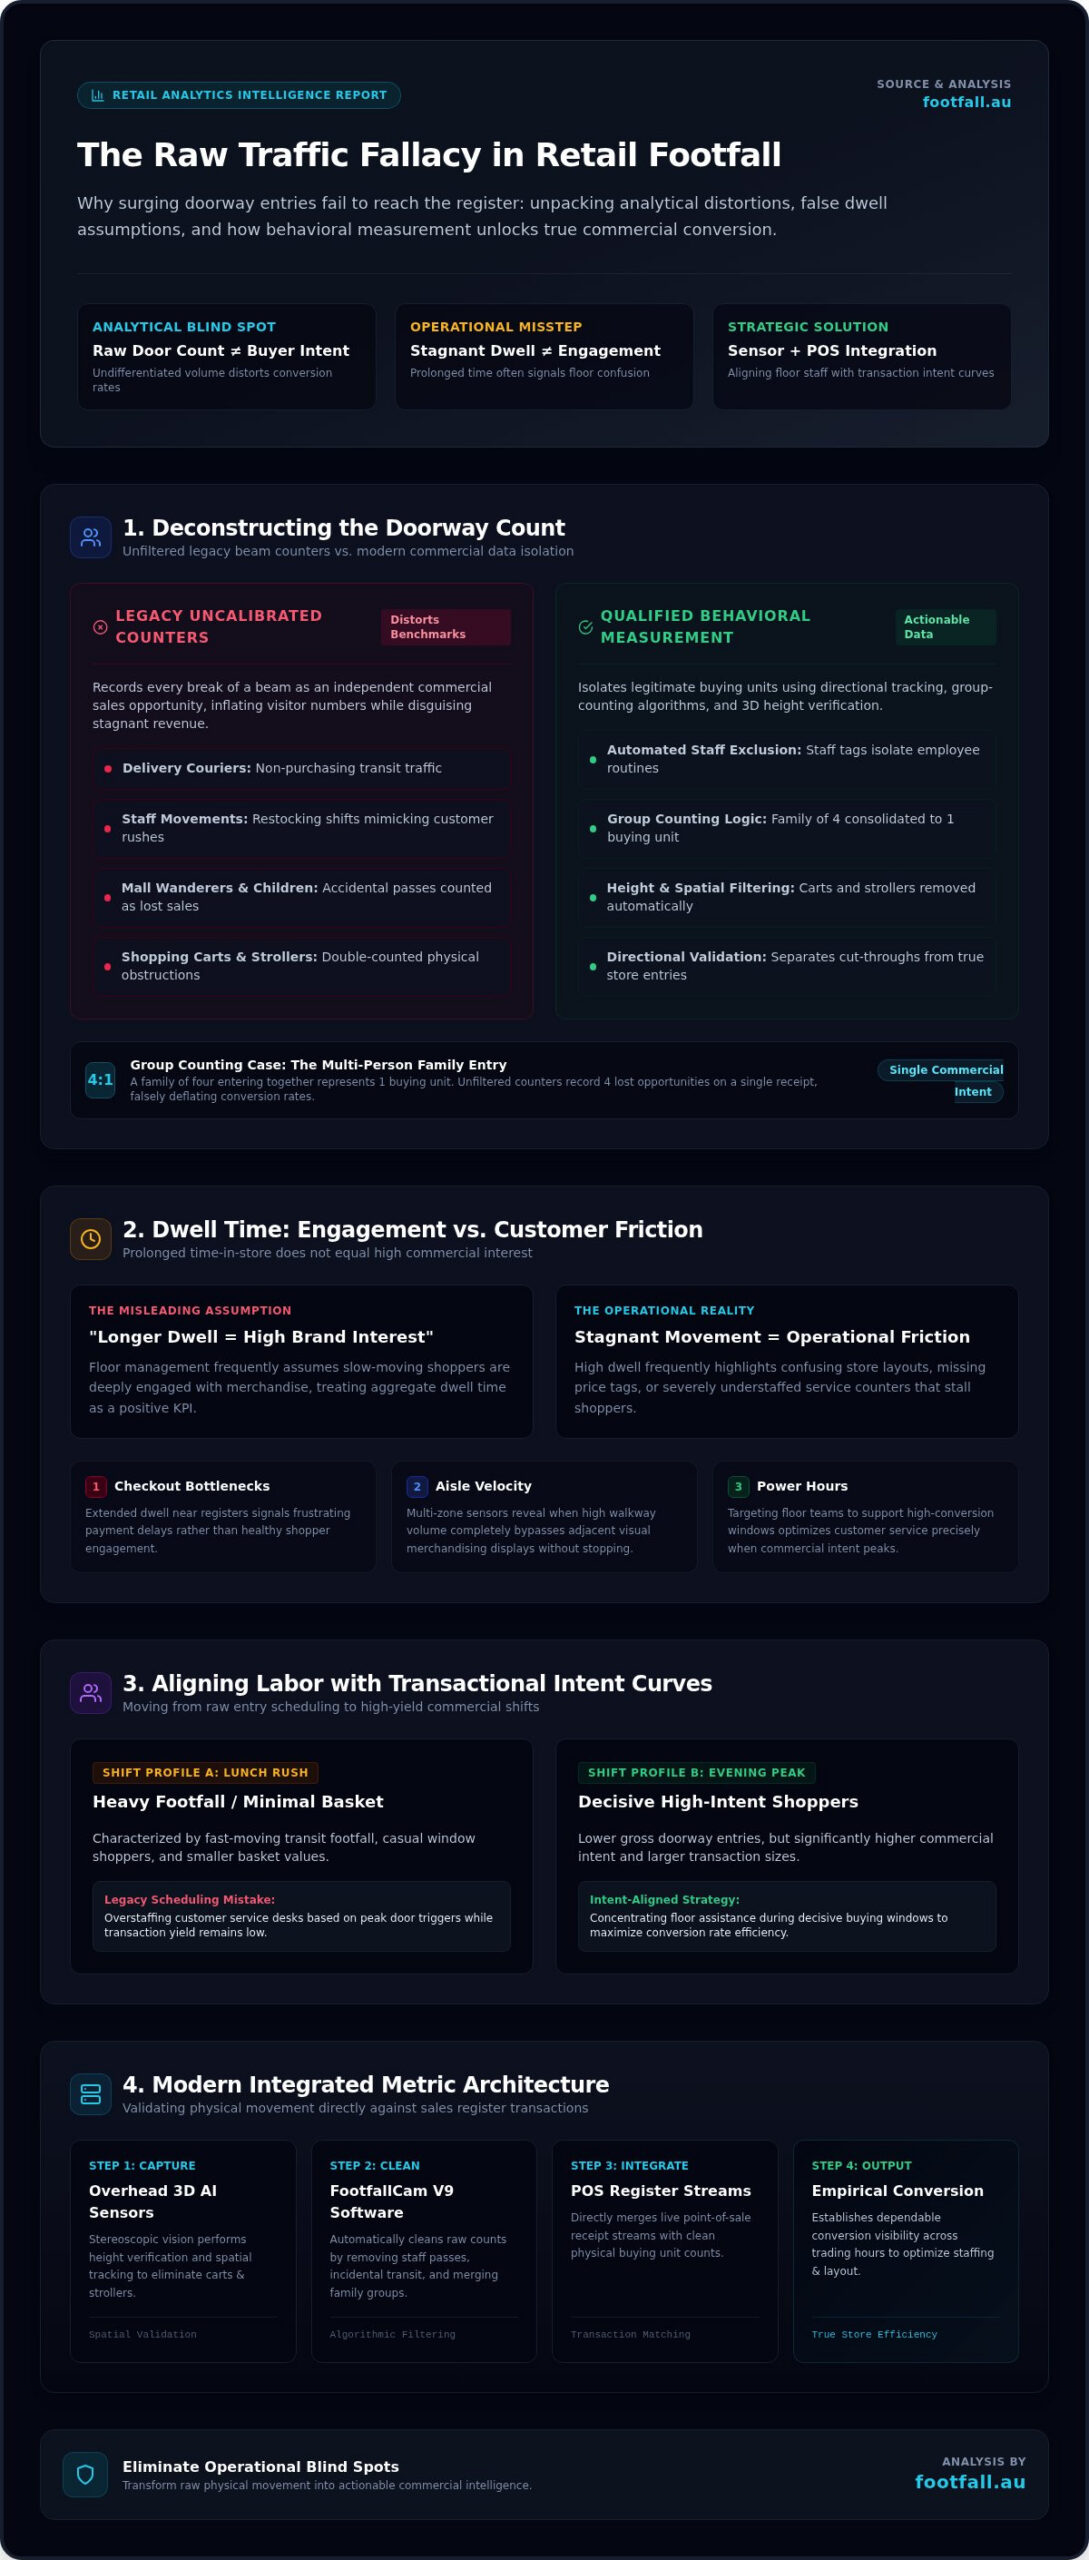
High entrance counts often create a false sense of security. Equating total doorway entries directly with commercial sales opportunities skews conversion rates, masking underlying retail inefficiencies. When legacy counters tally every break of a beam, they collect undifferentiated volume rather than qualified customer interest. Unfiltered footfall data inflates visitor metrics while disguising stagnant revenue. Standard doorway counts pick up delivery couriers, staff movements, curious children, and transit pedestrians cutting through open mall entrances. Treating these non-buyer journeys as lost sales opportunities distorts performance benchmarks, producing misleading conversion percentages across your store network.
Addressing these common misinterpretations of footfall metrics requires shifting from simple bulk counting to behavioral measurement. Basic people counting systems that record numbers without context fail to reflect commercial reality.
Filtering Incidental Foot Traffic from Qualified Buyers
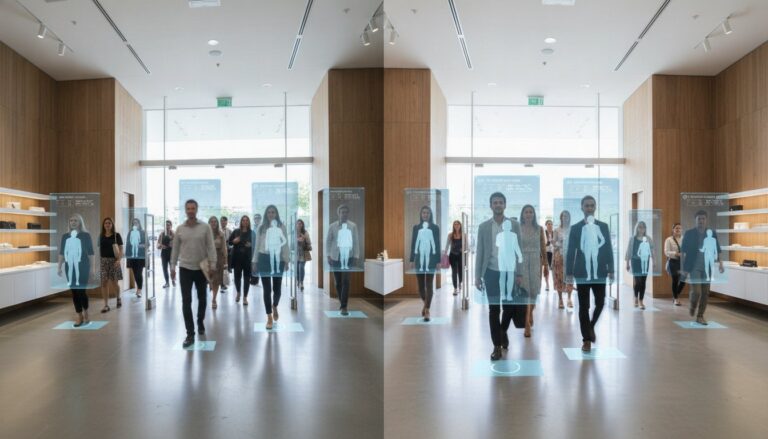
Accurate analytics depend on isolating legitimate buying units. Directional tracking combined with automated staff exclusion tags removes employee movements from baseline totals, preventing restocking shifts from mimicking customer rushes. Modern multi-lens hardware separates individual shoppers within groups. When a family of four enters together, treating them as four independent sales opportunities artificially deflates your purchase conversion rate. Applying group-counting algorithms consolidates them into a single buying unit.
Deploying advanced people counting technology with 3D stereoscopic vision ensures precision height verification and spatial tracking. These optical capabilities filter out strollers, shopping carts, and transit wanderers, converting noisy doorway traffic into clean, commercial data.
Operational Missteps: Misreading Dwell Times and Staffing Ratios
Relying on gross time in store often leads to expensive floor-management errors. Retail managers frequently assume that prolonged customer dwell time reflects deep brand engagement. In reality, stagnant movement often signals confusing store layouts, missing price tags, or understaffed service desks. When leadership builds labor schedules around peak doorway entries rather than peak buying windows, labor costs surge while conversion falls. Uncalibrated numbers can easily mislead retail business strategies by prioritizing sheer volume over transaction efficiency. Aligning operations with proven retail footfall analysis Australia standards ensures staffing models match actual purchasing potential.
Aligning Staff Scheduling with Transactional Intent Curves
Customer traffic fluctuates in quality across operating hours. Lunchtime rushes may generate heavy footfall with minimal basket sizes, whereas evening hours often bring decisive, high-intent shoppers. Misallocating labor across these shifts highlights one of the most common misinterpretations of footfall metrics.
To eliminate these scheduling errors, retailers must evaluate movement across zones:
- Checkout Bottlenecks: Extended dwell near registers signals frustrating payment delays rather than healthy shopper engagement.
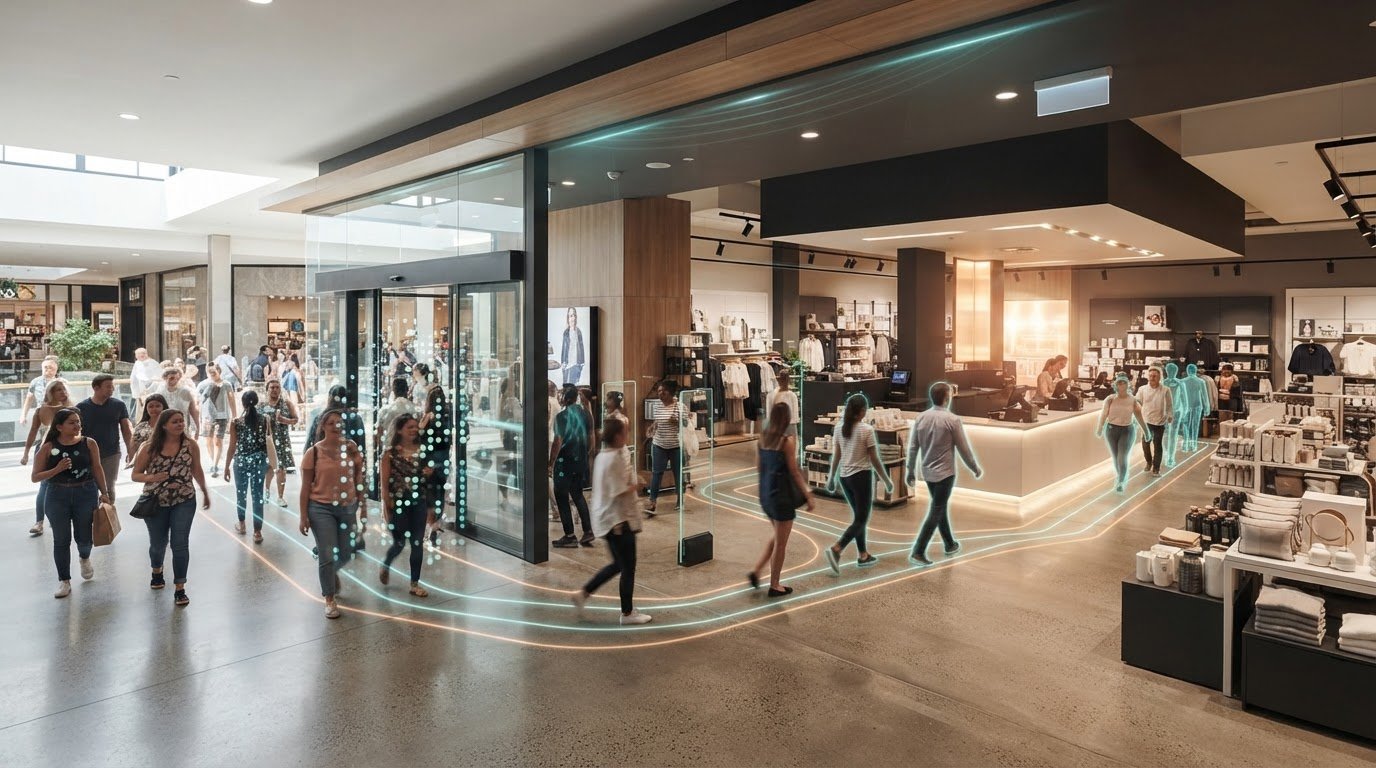
- Aisle Velocity: Multi-zone sensors reveal when high walkway volume bypasses adjacent visual merchandising displays without stopping.
- Power Hours: Scheduling floor teams to support high-conversion windows optimizes service when commercial intent peaks.
Retailers looking to audit their floor efficiency can review advanced operational frameworks through Footfall Australia to align staffing with real customer momentum.
Building Strategic Metric Integrity with Integrated Analytics Architecture
Eliminating common misinterpretations of footfall metrics requires a modern hardware and software ecosystem. Uncalibrated legacy sensors operate in isolation, generating siloed entry figures that tell you nothing about shopper intent. True operational clarity happens when you validate physical movement against transaction registers. Pairing overhead AI sensors with sales transaction data streams bridges this gap, establishing empirical conversion rates across every trading hour.
Deploying dedicated analytical platforms like FootfallCam V9 Software translates disparate data into unified conversion visibility. The platform automatically cleans raw foot traffic, removing staff passes and incidental dwell to give retail leaders dependable numbers. For teams modernizing aging infrastructure across Australia, consulting the definitive guide to people counting systems in Australia provides an essential blueprint for national hardware deployment.
Implementing Sensor-to-Software Analytics Verification
Establishing trustworthy retail metrics follows a clear technical sequence:
- Optical Field-of-View Audit: Calibrate ceiling-mounted 3D sensors to eliminate blind zones, doorway obstructions, and optical glare from exterior glass.
- Transactional Mapping: Synchronize hourly visitor arrivals directly with register sales timestamps to isolate qualified conversion rates from casual window-shopping volume.
- Dashboard Synthesis: Review multi-store reporting dashboards to distinguish marketing-driven footfall spikes from operational bottlenecks, driving smarter labor scheduling.
This closed-loop framework removes intuitive guesswork. Transforming raw entrance counts into structured behavioral data ensures every labor, merchandising, and marketing decision rests on empirical proof.
Transform Physical Footfall into Reliable Commercial Growth
Relying on raw door counts leaves store profitability to chance. Overcoming common misinterpretations of footfall metrics means filtering incidental foot traffic, decoding true dwell behavior, and aligning floor schedules with high-intent purchasing windows rather than gross entries. When physical movement connects directly with register sales data, operational strategy shifts from reactive guessing to calculated commercial execution.
Backed by over two decades of national traffic analytics expertise across Australia, Footfall Australia pairs high-precision 3D AI tracking with automated staff exclusion and group filtering. Combined with enterprise reporting through FootfallCam V9 Software, your leadership team gains transparent visibility across every trading zone. Audit your store traffic metrics with Footfall Australia to turn accurate customer movement into sustained bottom-line performance.
Frequently Asked Questions
Why do high footfall metrics sometimes fail to result in higher sales revenue?
Gross entry volume doesn’t guarantee buying intent. Window shoppers, passersby seeking shelter, and transit pedestrians inflate door counts without visiting product displays. Failing to filter out these low-intent visitors represents one of the most common misinterpretations of footfall metrics. Without synchronizing entrance traffic with register sales data, managers mistake high foot traffic for lost revenue opportunities.
How does staff exclusion technology prevent distorted retail conversion rates?
Employees crossing sensor thresholds during shift changes, restocking, and customer assistance repeatedly trigger doorway counters. If counted as shoppers, their repeated entries artificially inflate visitor numbers and dilute conversion percentages. Automated staff exclusion hardware uses specialized identification tags to filter out employee movements, ensuring conversion calculations reflect only genuine, external commercial traffic.
Can modern people counters differentiate between browsing groups and individual shoppers?
Yes, modern 3D stereoscopic devices analyze spatial proximity and coordinated movement to identify group dynamics. When partners or family members enter together, intelligent algorithms cluster them into a single commercial buying unit. This prevents group visits from artificially inflating entry numbers, providing store managers with an accurate baseline for calculating true sales conversion efficiency.
What is the operational difference between footfall volume and customer dwell time?
Footfall volume counts how many bodies cross an entrance threshold, whereas dwell time measures the duration a customer spends within a specific store zone. High dwell time in product areas often reflects strong merchandise engagement. Extended dwell around service desks or payment counters signals operational friction, highlighting why confusing dwell time with positive interest leads to common misinterpretations of footfall metrics.