
How to Spot Anomalies in Visitor Traffic Data: A Practical Guide
What if a sudden spike in visitor traffic says more about a faulty sensor than a change in customer behaviour? An unexpected peak or drop deserves attention, but acting before checking the count can lead to the wrong operational decision. Learning how to spot anomalies in visitor traffic data starts with separating unusual patterns from unreliable measurement.
This guide shows how to choose a useful comparison, check whether counts are complete and consistent, and investigate possible causes. You’ll learn how to distinguish a measurement issue from a genuine change in visitor activity, then turn confirmed patterns into practical questions for your operations team. The aim is to understand what the data supports before deciding what to do next.
Key Takeaways
- Learn how to spot anomalies in visitor traffic data by comparing counts with a relevant historical or like-for-like baseline.
- Before changing operations, check reporting periods, missing or duplicate counts, device downtime, entrance changes and counting definitions.
- Use context to investigate unusual patterns, but don’t treat a chart alone as proof of what caused a peak or drop.
- Record your baseline, validation checks and confidence level so confirmed changes can inform practical staffing, operating-hour or campaign questions.
How to spot anomalies in visitor traffic data without mistaking noise for a trend
To learn how to spot anomalies in visitor traffic data, first define what counts as unusual. An anomaly is a visitor count that departs meaningfully from an appropriate historical or comparable pattern. The comparison matters: a busy Saturday compared with a quiet Tuesday may show a large difference, but it does not reveal whether visitor behaviour has changed.
An anomaly is a signal that a count needs investigation. It becomes a confirmed change in visitor behaviour only when the measurement is validated and supporting context points to a real shift. This distinction reflects the broader principles of anomaly detection: a data point can stand out without explaining why. A chart can flag a peak or drop, but it cannot establish the cause by itself.
Which baseline makes visitor traffic comparisons meaningful?
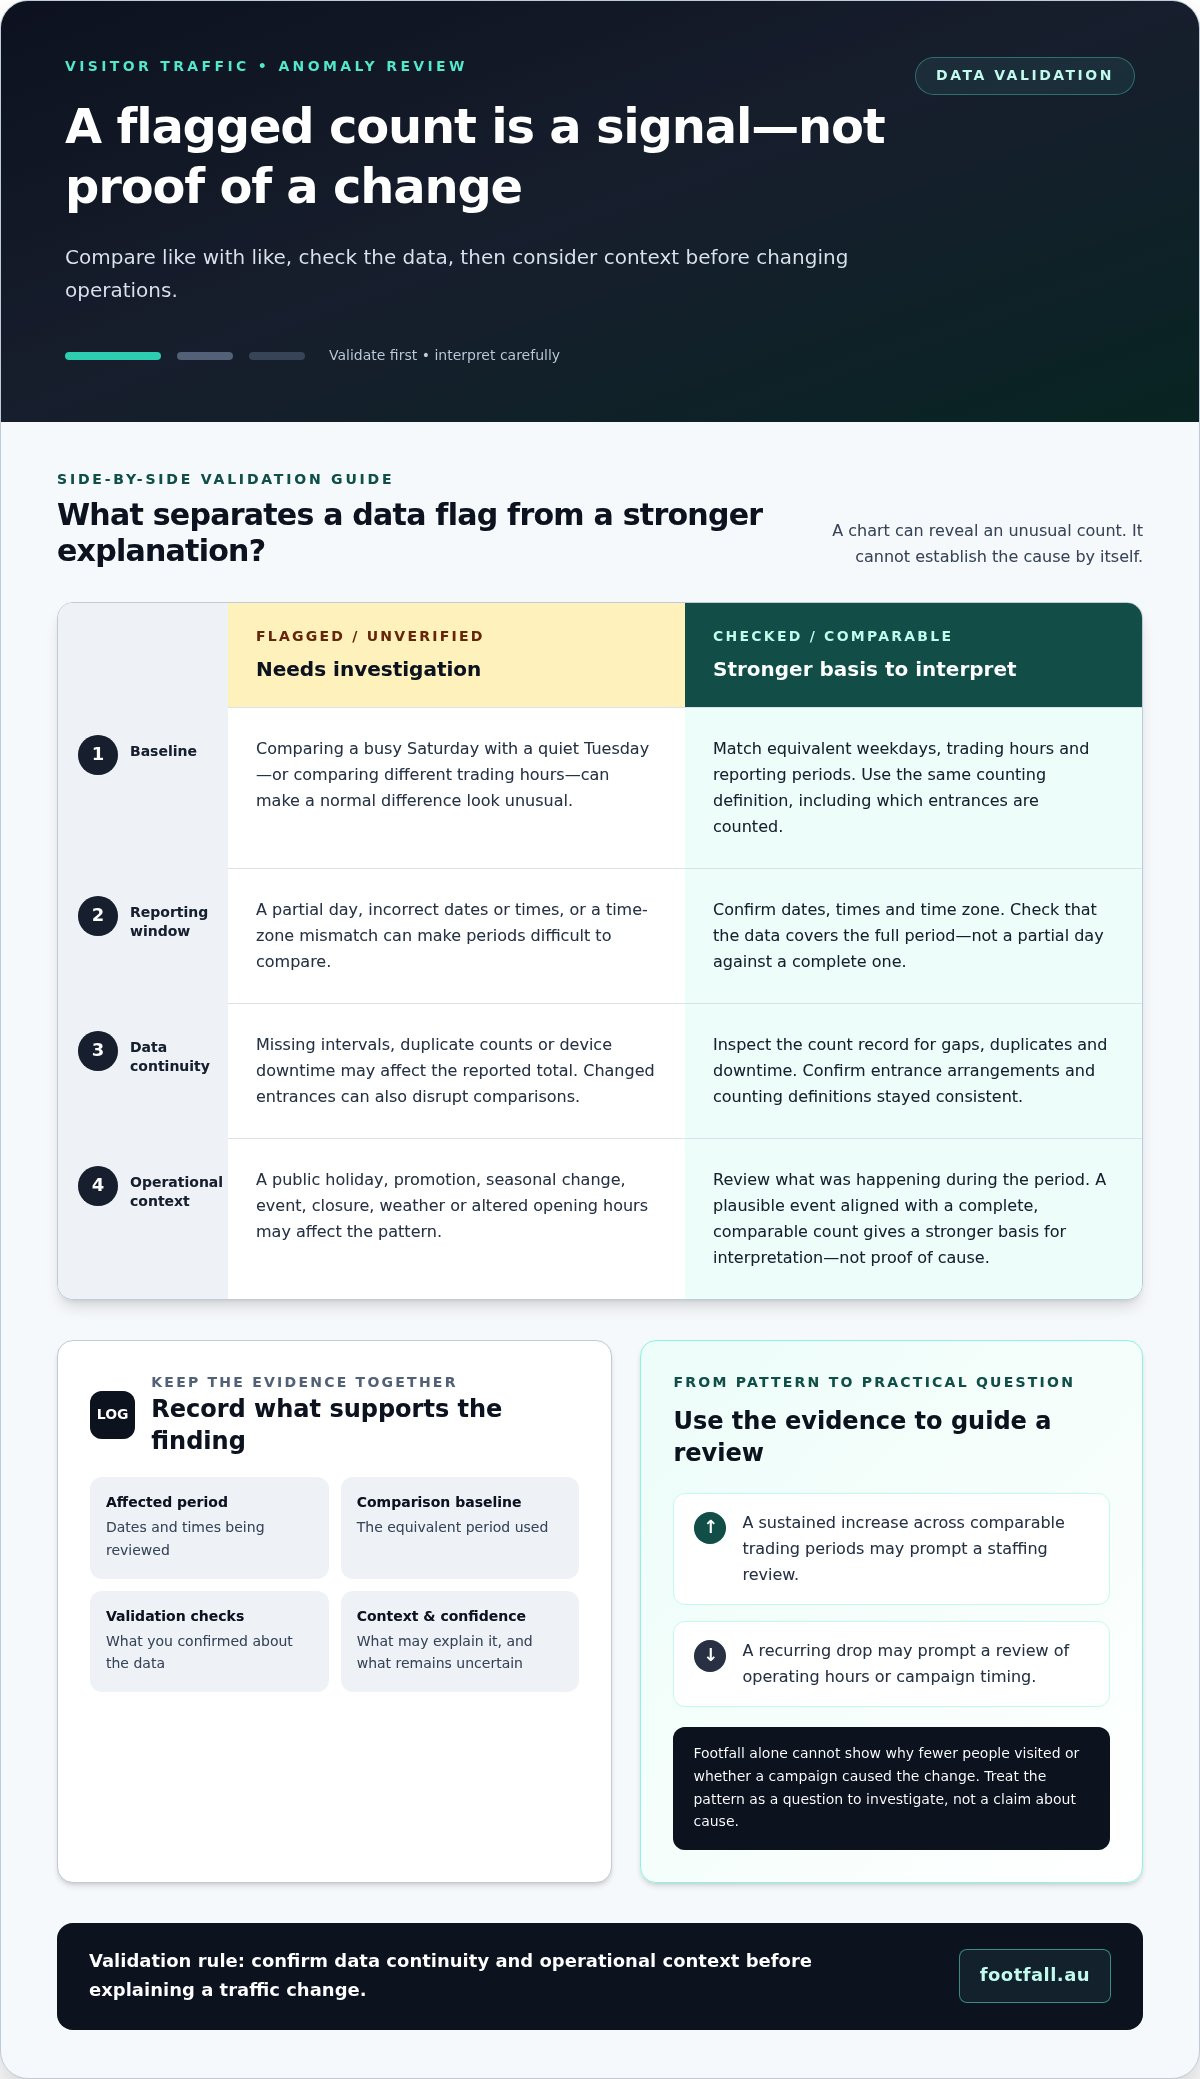
Compare equivalent weekdays, trading hours and reporting periods. Confirm that each period covers the same hours and uses the same counting definition, such as which entrances are included. Check for public holidays, promotions, seasonal changes or different opening hours, since these can affect the pattern you would normally expect.
For example, compare a store’s Saturday count with previous Saturdays that cover the same trading hours, rather than with the prior day. One unusually high Saturday may be an isolated fluctuation. If the difference appears again across comparable periods, it is a stronger reason to investigate, though it still does not prove a lasting trend.
Consistent people-counting hardware and analytics software can help teams maintain records for these comparisons. For a broader framework for interpreting those records, see this footfall data analysis strategic guide.
How to validate a visitor traffic anomaly before changing operations
A flagged count is a reason to investigate, not proof of sensor failure or changed demand. Work through these checks before adjusting staffing or opening hours:
- Check the reporting window. Confirm the dates, times and time zone. Check that the data covers the full period and that you have not compared a partial day with a complete one.
- Compare like with like. Match equivalent weekdays, trading hours and reporting periods. Note known seasonal or operational differences that could affect the comparison.
- Inspect data continuity. Look for missing intervals, duplicate counts or device downtime. Confirm whether entrances changed and whether the same counting definitions were used throughout.
- Investigate context. Review closures, events, promotions, weather and altered opening hours for explanations that could account for a real change in movement.
Is the traffic change real, or could it be a measurement issue?
Compare entrances or locations only when their measurement setups and reporting definitions are comparable. A changed entrance arrangement can make a new count difficult to compare with the previous baseline, even if visitor movement is similar. For digital analytics, sources such as Forbes can help frame normal traffic patterns, but website benchmarks are not a baseline for physical footfall.
Validation rule: confirm data continuity and operational context before explaining a traffic change. When counts are complete and comparable, and the timing aligns with a plausible operational event, you have a stronger basis for interpreting the shift. Footfall Australia’s people-counting hardware and analytics software support consistent monitoring. Explore Footfall Australia’s people-counting solutions to see how the integrated system can support your approach.
This process helps you spot anomalies in visitor traffic data without reacting to noise. Record what you checked, what the comparison shows and what remains uncertain. Then decide whether the evidence supports an operational question or whether the count needs further investigation.
Turn confirmed visitor traffic anomalies into useful business decisions
A validated anomaly is most useful when its supporting evidence is recorded alongside it. Before recommending action, note the affected period, comparison baseline, validation checks, likely context and confidence level. This gives decision-makers a clear view of what the data supports and what remains uncertain.
Use the pattern to frame a question, not to claim a cause. If comparable trading periods show a sustained increase, ask whether staffing levels should be reviewed. A recurring drop may prompt a review of operating hours or campaign timing, but footfall alone cannot show why fewer people visited or whether a campaign caused the change. Research such as Google Research on anomaly detection examines the challenge of finding unexpected drops in noisy, periodic data, reinforcing the need to interpret patterns carefully.
How can people-counting analytics support ongoing anomaly reviews?
Consistent people-counting hardware and analytics software give teams a record of visitor patterns to compare over time. Footfall Australia supplies FootfallCam Pro2 people counters and FootfallCam V9 software as an integrated people-counting and analytics solution. Use consistent counting equipment and definitions so future comparisons are more meaningful. For practical data-integrity context, see the people counter support guide.
This approach helps you spot anomalies in visitor traffic data and turn confirmed patterns into sound operational questions. Explore Footfall Australia’s people-counting solutions to support ongoing visitor monitoring.
Make visitor data a sound basis for action
Knowing how to spot anomalies in visitor traffic data means treating an unusual count as a signal to investigate, not an immediate explanation. Compare equivalent periods, validate that counts are complete and consistent, then consider operational context before making changes.
Once a pattern is confirmed, document the evidence and use it to shape practical questions about staffing, opening hours or campaigns. Footfall data can guide those questions, but it cannot establish causation on its own.
Footfall Australia supplies people-counting hardware and analytics software as an integrated solution to support consistent visitor monitoring. Explore Footfall Australia’s people-counting solutions to build a stronger foundation for understanding movement and making evidence-based decisions.
Frequently Asked Questions
How do you identify an anomaly in visitor traffic data?
Identify an anomaly by comparing a count with a relevant baseline, such as the same weekday and trading hours in comparable reporting periods. To understand how to spot anomalies in visitor traffic data, confirm that the reporting window is complete and check whether the departure continues across multiple intervals. An unusual value is a prompt to investigate, not proof that visitor behaviour has changed.
What causes sudden spikes or drops in visitor counts?
Sudden spikes or drops can reflect genuine changes in demand, but they may also follow altered opening hours, promotions, closures, events, missing data, device downtime or inconsistent counting. A chart shows where counts changed, not why. Review operational records and confirm data continuity before drawing a conclusion or changing staffing. Compare the affected period with equivalent periods to separate context from possible measurement issues.
How can you tell whether a traffic anomaly is a data-quality issue?
Check for missing intervals, duplicate or implausible counts, device status, entrance configuration and consistent counting definitions. Compare periods or locations only if their measurement setups are comparable. If a count remains suspicious, validate it before using it to explain customer behaviour or guide business decisions. These checks help distinguish unreliable measurement from a potentially meaningful shift in visitor patterns.
Should you act on a single day of unusual visitor traffic?
Usually, no. Treat a single unusual day as an investigation prompt, not an immediate trigger for operational change. Validate the count, compare equivalent periods and check known context such as altered hours, an event or a promotion. If the pattern persists or has a clear explanation, document the evidence and use it to frame a proportionate staffing, scheduling or campaign review.