
How to Customise Footfall Reports with Filters and Calculations
Yes. FootfallCam reporting can be tailored to business goals using portal data and charts. Advanced footfall report customisation helps you focus on the questions your organisation needs to answer.
A useful report does more than present visitor counts. It highlights the locations, time periods and measures that support a practical decision, helping you interpret movement patterns in context.
Shape a report around your goals by filtering data, setting date ranges and working with custom fields and calculations where available. Choose a useful level of detail, from hourly trends to store-level profiles, and keep the results clear enough for teams to act on. The aim is to make footfall data easier to interpret and apply to day-to-day planning.
Key Takeaways
- Shape a report around the business decision, then prioritise the columns that make its key measures easier to read.
- Narrow results by information type and choose date ranges that make meaningful comparisons possible.
- Explore how custom fields and calculations can bring relevant measures together for clearer analysis.
- Use reporting support when you need help getting more value from FootfallCam data and reports.
Can I create a custom report?
Yes. FootfallCam users can create personalised reports from portal data and charts. Use advanced footfall report customisation to focus each view on a clear operational question.
-
Add and arrange report columns
Start by selecting the columns that answer your reporting question. Add relevant measures, remove distracting fields, then order the columns so the most useful results appear first. For example, a store comparison might show location and visitor count before supporting measures. Review the layout for missing context, duplicate fields and unclear labels.
-
Add dimensions, measures, and filters
Choose dimensions such as location or time period to organise results, then add measures such as visitor counts. Apply filters to narrow the view to the locations or periods relevant to the decision. In Australia, privacy obligations can include the Privacy Act 1988 and Australian Privacy Principles when they apply. Design reports to avoid exposing identifiable information unnecessarily.
Counting accuracy depends on the method, sensor placement, site layout and movement patterns. Crowding, overlapping traffic and entry conditions can affect readings, so interpret results in their operational context.
- Include custom data sources only when they are available in the reporting environment and their definitions match the report’s measures. Keep field names and units consistent before combining information. Filters can exclude relevant activity, and calculations can mislead when inputs or definitions differ. Document assumptions and check that each field supports the intended decision.
Filtering reports by information type and date range
Set filters to match the decision, then use a consistent reporting period. Footfall trends can be analysed by hour, day, week, month or year.
-
Choose information types and date ranges
Select a measure and reporting period that match your task. For a campaign review, compare visitor counts across the campaign dates; for routine planning, use a recurring weekly view. Keep start and end dates consistent when comparing locations. This helps distinguish changes in visitor activity from differences caused by mismatched periods.
-
Pivot and filter report data
Pivot the report to change how its dimensions organise the results. For example, group by region to compare regional statistics, then pivot by store to inspect individual profiles. Apply filters before interpreting the comparison, and use the same measure in each view. A company-wide summary can reveal broad patterns, while regional or store-level views help pinpoint where they occur.
-
Remove report fields and filters
Remove fields that no longer support the report’s purpose, and clear filters that unintentionally narrow results. Before saving or sharing, review the selected locations, measures and period. A leftover store filter can make a multi-location report appear incomplete, while an unnecessary dimension can obscure the key measure. Keep the report focused on the decision it should inform.
-
Filter by time, location, and visitor segment
Choose a time interval, then narrow results by company, region or store. Use a visitor segment only when that dimension exists in the report data. Before exporting, apply the intended filters and review the visible results, so the exported view reflects the chosen scope. For help aligning reporting with operational needs, explore footfall reporting support.
Custom reports can make it easier to review visitor information regularly. FootfallCam reports can show traffic data from a company-wide view to regional statistics and store-level profiles.
Creating custom fields and calculations
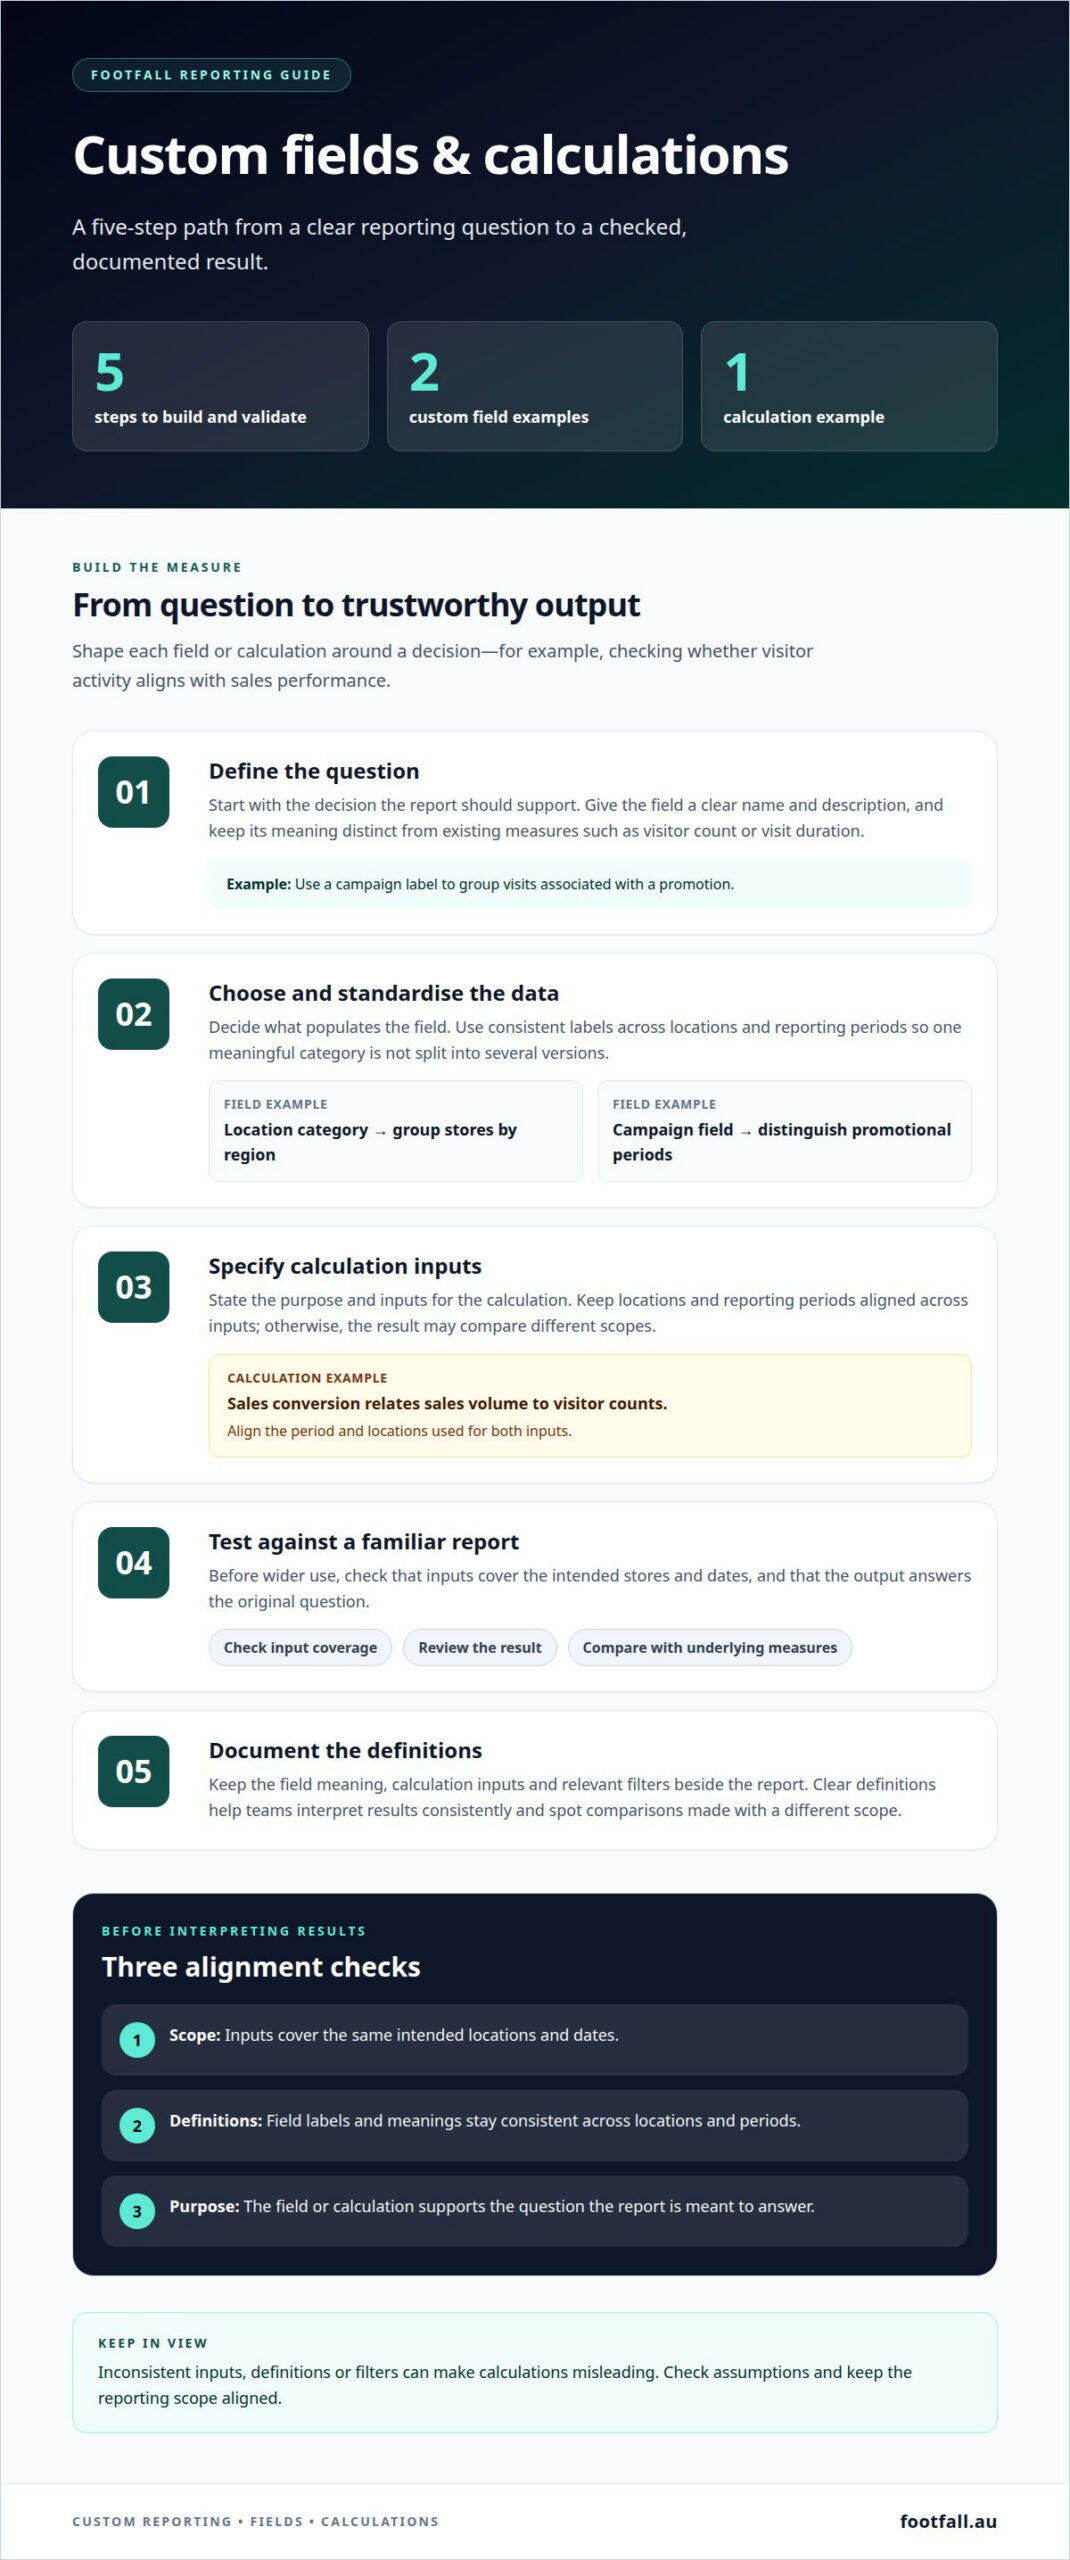
Build each field or calculation around a decision, such as assessing whether visitor activity aligns with sales performance.
- Define the question before creating a field. For example, a campaign label can group visits associated with a promotion. Give the field a clear name and description so teams interpret it consistently. Keep its meaning distinct from existing measures, such as visitor count or visit duration.
- Choose the data that will populate the field. A location category could group stores by region, while a campaign field could distinguish promotional periods. Use consistent labels across locations and reporting periods. Inconsistent entries can divide one meaningful category into several versions, making comparisons harder to interpret.
- Specify the inputs and purpose for each calculation. For a sales conversion measure, relate sales volume to visitor counts. Keep the reporting period and locations aligned across both inputs; otherwise, the result may compare sales from one scope with footfall from another.
- Test the field or calculation against a small, familiar report before wider use. Check that the inputs cover the intended stores and dates, and that the output supports the original question. For example, compare the conversion result with its underlying visitor and sales measures. This makes unexpected changes easier to trace.
- Document definitions beside the report, including the field meaning, calculation inputs and relevant filters. Clear definitions help teams read results consistently and identify when a comparison uses a different scope. For help applying footfall reporting to operational decisions, discuss your reporting requirements.
Footfall Australia
Footfall Australia is a practical next step when you need support making FootfallCam reporting useful for your operations. If report settings, measures or results are difficult to interpret, its Basic Support Plan and Premium Support Plan provide support options for FootfallCam users. The right plan depends on the support your business needs, while the Legacy Swap Out Plan is relevant for businesses managing legacy equipment. Clear reporting starts with a defined question: whether you’re reviewing visitor patterns, comparing locations or informing operational decisions. Share the reporting issue you’re working through to help focus the discussion on the relevant data and support. Contact Footfall Australia to discuss your footfall reporting needs.
Turn reporting into your next decision
A report becomes more valuable when it helps your team decide what to examine, where to act and what to measure next. Keep that decision at the centre of your advanced footfall report customisation, and refine the report as operational priorities change. Consistent definitions and clear ownership help teams use the same measures when reviewing performance across locations.
Footfall Australia offers FootfallCam Pro2 People Counters, FootfallCam Pro1 IP Cameras and FootfallCam Centroid. These offerings support footfall measurement that teams can use as a foundation for reporting and analysis. If you’re planning how to align your reporting with your measurement setup, contact Footfall Australia for help. A focused conversation can help you identify the next practical step for your reporting needs.
Frequently Asked Questions
What customisation options are available in advanced footfall reports?
Custom reports can be tailored to business goals, with views covering company-wide totals, regional statistics and individual store profiles. Choose report types to suit the question. For example, zone analytics can show visitor profiles and dwell patterns across areas, while occupancy reporting can inform decisions about staffing or maintenance timing.
Which metrics and KPIs can advanced footfall reports include?
Available measures depend on the report and the data being analysed. Marketing effectiveness reporting can benchmark visitor count, turn-in rate, visit duration, returning rate and sales conversion. Zone analytics can compare visitor profiles and dwell time across areas. Sales conversion reporting combines footfall trends with sales volume, while staff planning reports relate staffing levels to visitor numbers.
How to create and schedule a customised footfall report?
First, define the decision the report should support, then select a relevant report type and the measures your team needs. Review results for the intended locations and reporting period. You can schedule regular email delivery to relevant staff, such as store or marketing managers. Choose recipients based on who will use the findings.
Which footfall analytics platforms offer the best report customisation?
FootfallCam lets users create personalised reports from portal data and charts, with views tailored to business goals.