Presenting Footfall Analysis to Senior Leadership
Why does a 15% increase in store traffic often result in a shrug from the boardroom rather than a budget approval? It’s frustrating when meticulous reports are dismissed as mere statistics because leadership fails to see a direct link to profit. You likely feel the pressure to justify system upgrades while struggling to bridge the gap between technical metrics and financial outcomes. This guide explores how to present footfall analysis to senior leadership by translating raw traffic data into high-impact business intelligence.
We show you how to move from being a data provider to a strategic partner who influences store layouts and staffing policies. By leveraging the FootfallCam V9 software, you’ll learn to frame human movement as a narrative of opportunity. This approach secures the A$ funding your department needs for long-term growth and ensures your insights drive real operational change. We will outline the exact steps to turn technical data into a compelling case for investment.
Key Takeaways
- Transform raw people counting data into “Decision Intelligence” to ensure your reports align with high-level corporate objectives and long-term growth.
- Master how to present footfall analysis to senior leadership by contextualising traffic trends alongside POS data to prove the direct link between visitors and profit.
- Leverage the FootfallCam V9 software to build visual, one-glance dashboards that eliminate technical clutter and focus on actionable business insights.
- Secure budget for system upgrades by translating metrics like Power Hours into strategic value, such as labour cost reduction and improved customer engagement.
Framing Footfall Data as a Strategic Asset for Leadership
Raw people counting is no longer enough for competitive Australian businesses. To master how to present footfall analysis to senior leadership, you must transition your reporting toward Decision Intelligence. This concept represents the evolution of data from a simple headcount into a high-value strategic asset that dictates resource allocation and capital expenditure. It moves the conversation away from what happened toward a focus on what the organisation should do next.
Senior leaders prioritise trends and anomalies over static daily totals. They want to know why a specific weekend outperformed the quarterly average or why certain zones consistently underdeliver. By shifting from descriptive analytics to prescriptive analytics, you provide a clear roadmap for operational optimisation. This forward-thinking approach ensures that every data point serves a purpose in the broader corporate strategy.
Strategic trust relies on data integrity. High-accuracy hardware, such as the FootfallCam Pro2, ensures the foundation of your report is empirical and beyond reproach. When accuracy is guaranteed, the boardroom focus shifts from questioning the validity of the numbers to discussing the strategic advantage they provide. It’s about building a narrative based on facts rather than assumptions.
The Psychology of C-Suite Reporting
Executive teams evaluate information through the “so what?” factor. Every metric must link to a core business objective, such as revenue growth or labour efficiency. Within the scope of customer analytics, footfall data functions as a narrative of movement. It allows you to interpret physical presence not just as statistics, but as a logical sequence of human actions that reveal consumer intent and preference.
Using this data with quiet confidence helps reduce organisational anxiety. It replaces gut-feel decisions with evidence-based success. By highlighting how human behaviour impacts the bottom line, you position yourself as an essential guide for the future of the physical environment. This shift in perspective is the key to how to present footfall analysis to senior leadership effectively, turning raw numbers into an influential voice in the executive suite.
The 3 Pillars of a High-Impact Leadership Presentation
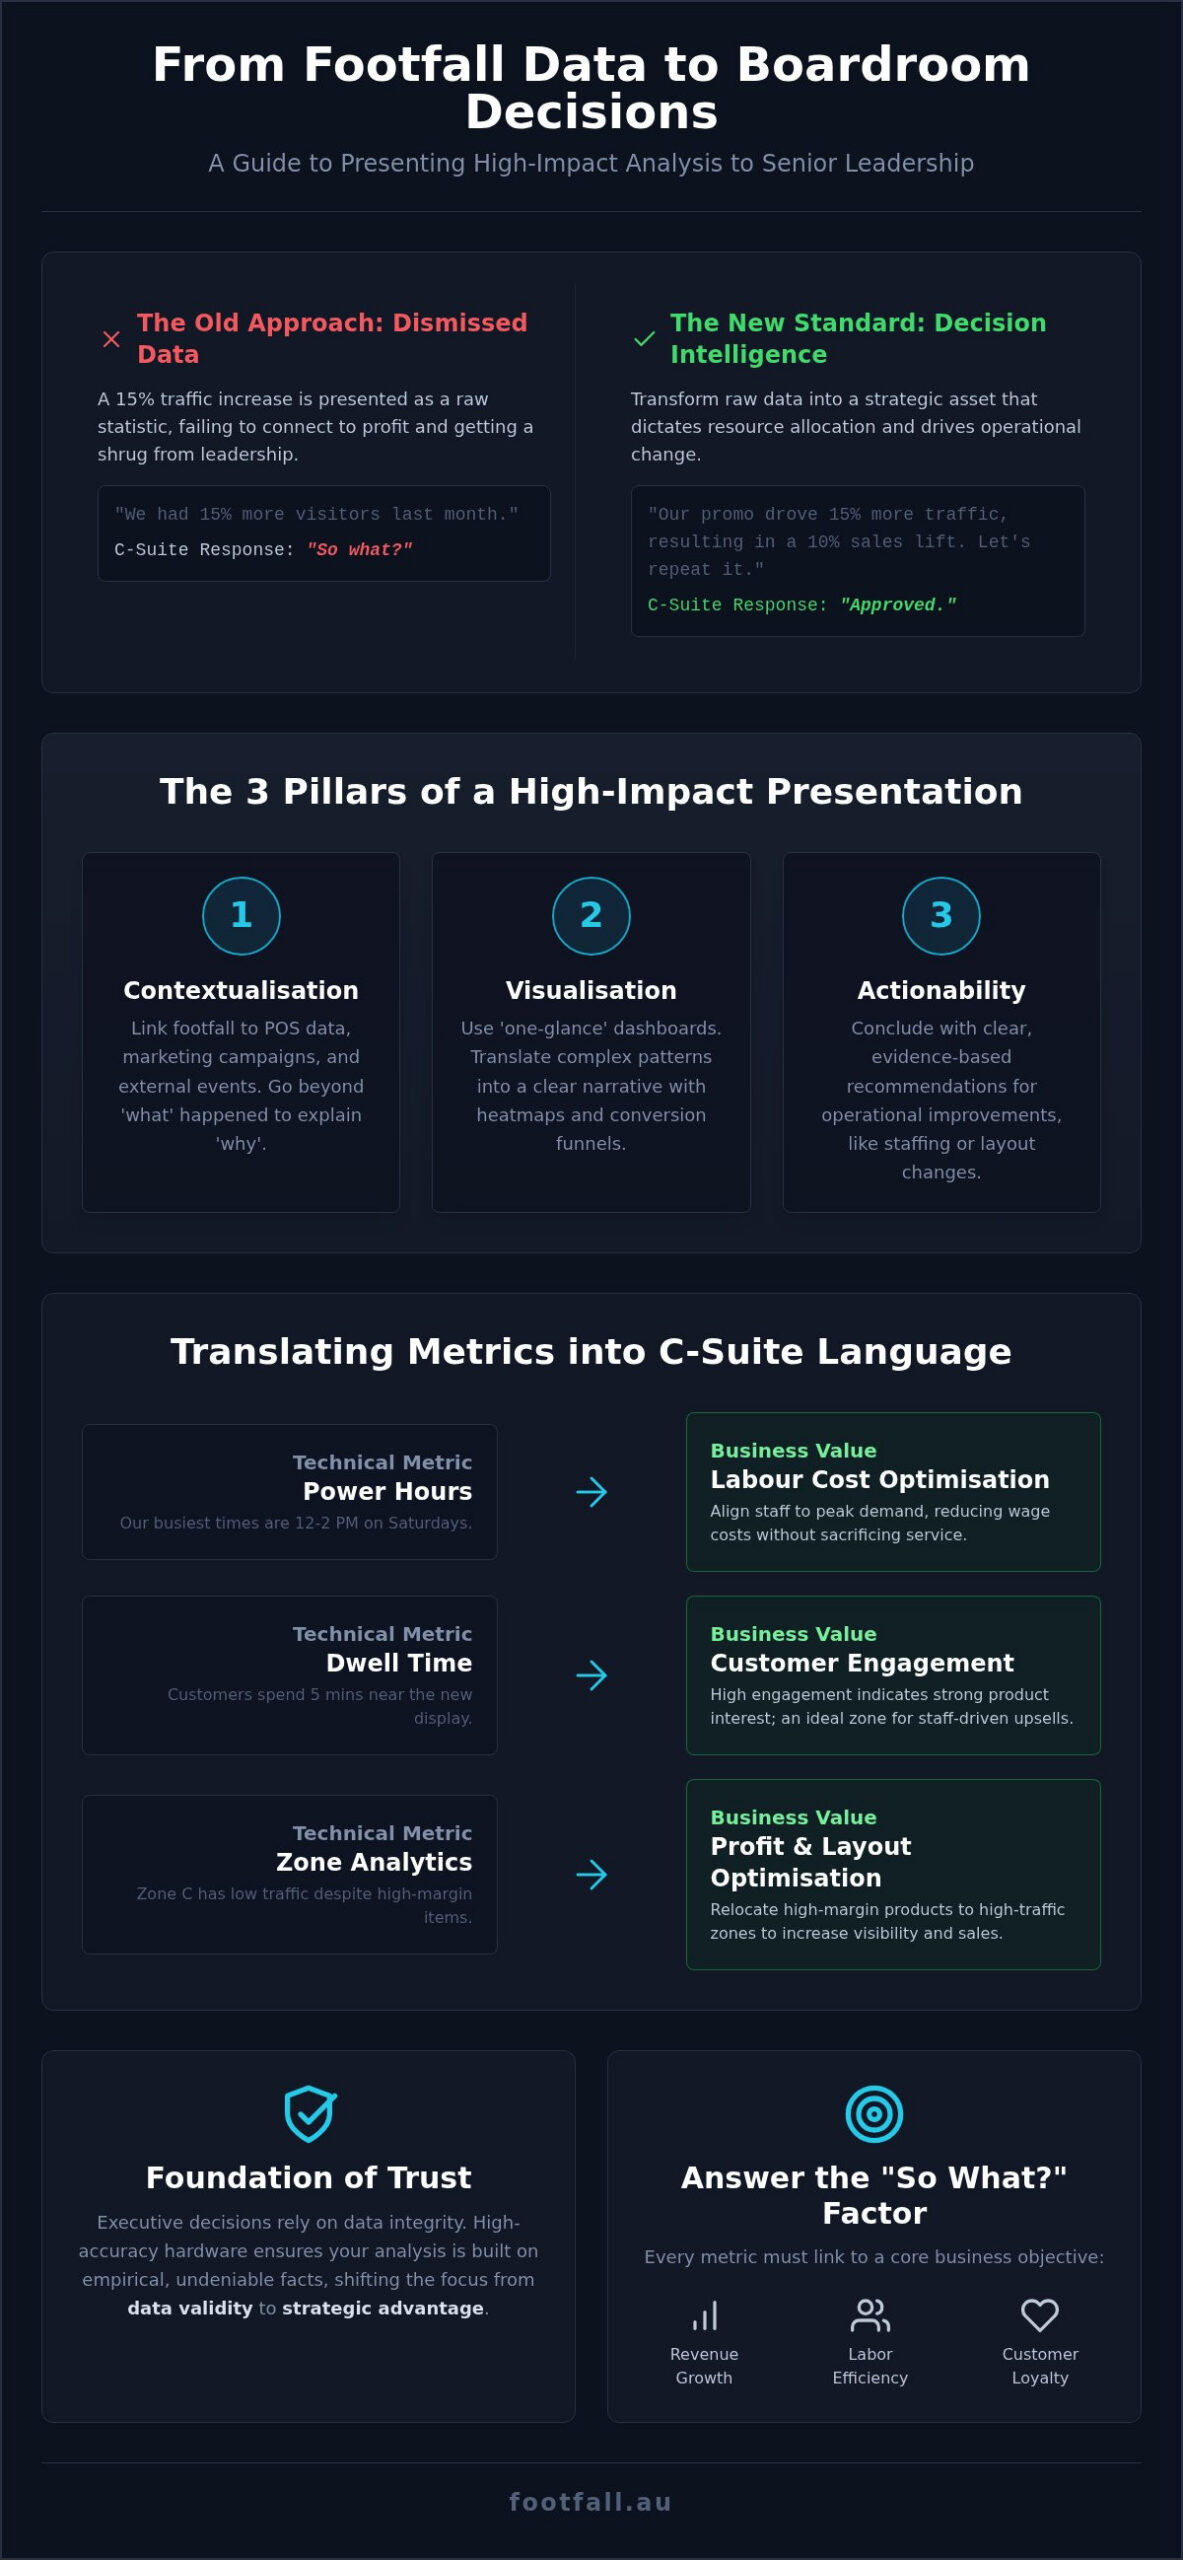
To master how to present footfall analysis to senior leadership, you must build your case on three structural pillars. These pillars ensure that your data is not just seen, but understood and acted upon by the executive team.
- Pillar 1: Contextualisation. Footfall is a relative metric. Linking it to POS data or external events provides the “why” behind the “what”. This is the foundation of presenting data-backed insights to leadership.
- Pillar 2: Visualisation. Executives have limited time. Use FootfallCam V9 Software to generate “one-glance” dashboards. Data storytelling in physical retail is the process of translating foot traffic patterns into a narrative of human intent and financial potential.
- Pillar 3: Actionability. Every presentation should conclude with three clear operational recommendations. For instance, suggest reallocating staff to peak hours or adjusting a store layout based on heatmap evidence.
By following this structure, you demonstrate how to present footfall analysis to senior leadership as a strategic asset. It shifts the focus from raw numbers to business outcomes.
Designing Your Footfall Dashboard for Clarity
Avoid “chart junk” that obscures the truth. Focus on heatmaps and conversion funnels that show the customer journey. Real-time data integrity is vital for maintaining executive trust. If your current sensors are outdated, use the Legacy Swap Out narrative to justify a hardware refresh. This ensures your reporting remains accurate and your seat at the table is secure. For expert guidance on system integration, consult with the team at Footfall Australia. Reliable reporting starts with reliable hardware.
Translating Footfall Metrics into C-Suite Language
Senior leadership speaks the language of capital allocation and operational efficiency. When you evaluate how to present footfall analysis to senior leadership, you must replace technical jargon with financial value. For example, “Power Hours” shouldn’t be presented as just busy times. Instead, frame them as critical windows for staffing optimisation and labour cost reduction. Aligning staff levels with these peak periods directly impacts the bottom line by ensuring service levels match demand without overspending on wages.
Similarly, “Dwell Time” translates to customer engagement and merchandising effectiveness. High dwell times in specific zones indicate successful product placement, while low dwell times suggest a need for layout revision. Using storytelling to present complex data allows you to frame these metrics as a narrative of the customer journey. This helps executives visualise the physical experience behind the numbers and reduces the anxiety often associated with abstract data sets.
“Outside Traffic” metrics offer a unique view into market share and site selection potential. This data helps bridge the gap between digital marketing spend and physical store visits. Implementing advanced people counting technology provides the empirical evidence needed to justify marketing ROI across all channels. It proves that foot traffic isn’t just a number; it’s a sequence of human actions that reveal consumer intent.
Linking Footfall to Financial ROI
One of the most persuasive tools in your arsenal is the “Cost of Missed Opportunity”. By analysing non-converter data, you show exactly how much revenue is lost when high footfall doesn’t lead to sales. This makes retail footfall analysis a leading indicator of future revenue trends rather than a lagging report of the past. Mastering how to present footfall analysis to senior leadership ensures that your insights drive proactive decisions for national portfolio optimisation, making you a strategic partner in the organisation’s long-term growth.
Securing Strategic Buy-In Through Decision Intelligence
Mastering how to present footfall analysis to senior leadership transforms you from a data provider into a vital strategic consultant. By framing traffic as a narrative of human movement and linking it directly to financial ROI, you provide the clarity required for high-stakes capital allocation. Successful reporting relies on the transition from descriptive to prescriptive insights. This ensures every recommendation leads to measurable operational optimisation rather than just interesting observations.
Since 2004, Footfall Australia has empowered organisations with AI-driven accuracy via the FootfallCam Pro2. Our national support and maintenance plans ensure your infrastructure remains reliable for consistent, long-term reporting. Upgrade your reporting with FootfallCam V9 Analytics to deliver the high-impact intelligence your C-suite demands. You now have the framework to turn raw physical presence into a clear roadmap for evidence-based growth.
Frequently Asked Questions
How much footfall data should I include in a leadership report?
Leadership reports should prioritise quarterly and yearly trends to highlight long-term trajectory rather than granular daily logs. While daily data assists store managers, senior executives require a macro view that links traffic to overall business health. Aim for a summary including peak periods and year-on-year comparisons. This ensures the data remains concise enough to facilitate efficient decision-making during high-level strategic reviews.
Can I present footfall analysis without POS integration?
You can certainly present valuable analysis without POS integration by focusing on metrics like capture rate and dwell time. These indicators show how effectively your physical space engages passersby regardless of sales. However, integrating these metrics with transactional data provides a more complete picture of conversion. This is a critical factor in how to present footfall analysis to senior leadership to prove marketing ROI.
How do I handle data discrepancies when presenting to the board?
Address discrepancies with transparency by explaining the technical variables involved, such as environmental factors or outdated hardware. If your current system is underperforming, use the discrepancy as a business case for a Legacy Swap Out Plan. This demonstrates proactive management. High-accuracy sensors like the FootfallCam Pro2 minimise these issues, providing a reliable foundation of empirical evidence that reinforces executive trust.
What is the best frequency for leadership footfall reporting?
A monthly reporting cadence is ideal for operational reviews, while quarterly reports are better suited for strategic planning and capital allocation discussions. This frequency allows you to identify shifting behavioural trends without overwhelming the board with data noise. Consistent reporting helps leadership view footfall as a leading indicator of revenue, making it easier to understand how to present footfall analysis to senior leadership effectively.