

Segmenting Visitor Traffic by Time and Day to Spot Patterns
The busiest day isn’t always the most useful measure of visitor activity. Segmenting visitor traffic by time and day works best when you compare all 24 hours across all 7 days over a broad date range, so differences between weekdays and time slots are easier to interpret.
Daily totals are useful, but they can hide when visits happen and how patterns change through the week. A quieter day may still have a distinct peak, and the same hour can perform differently on another weekday.
This guide explains how to compare visitor traffic across weekdays, identify patterns over time, and export and visualise time-based reports. It also shows why consistent time ranges and a broad view help turn movement data into practical decisions about staffing, scheduling and how spaces are used.
Key Takeaways
- Compare the same time slots across weekdays to distinguish recurring movement patterns from isolated busy periods.
- Use a broad date range and clear visualisations to make hourly reports easier to interpret and share.
- Review visits by hour, day, week and month to see how peaks and quieter periods shift over time.
- People-counting technology can help turn movement data into evidence for operational planning.
Comparing mobility across different days of the week
Compare visitor counts across all seven days, then examine the same time periods within each day. This reveals whether daily totals conceal differences between weekdays, weekends or evenings.
Weekday Mobility Comparisons
Weekday mobility comparisons show how visitor volumes and activity periods vary across the week. They matter because a daily total can hide when demand rises or falls. Compare Monday morning with other weekday mornings, then assess weekends separately. The Australian Competition and Consumer Commission (ACCC) defines broadband busy hours as 7-11pm, providing context when identifying evening peak hours for Australian visitors. Treat this as a comparison window, not proof that every site peaks then.
To compare day-of-month conversion rates, group dates by their position in the month and compare conversions with visits. For market context, compare a visitor segment’s share of site visits with its share of the relevant catchment population. Align timestamps to the site’s local time before comparing weekdays; otherwise, evening activity may be assigned to the wrong day. These comparisons are useful when segmenting visitor traffic by time and day.
For Australian visitor analysis, use aggregated counts and avoid identifying individuals. If personal information is involved, handle it in line with applicable Australian privacy obligations.
Data Needs for Reliable Time Comparisons
Useful time comparisons need enough observations in each time-and-day group to reveal a pattern. There is no single traffic count that suits every site: the volume needed depends on how finely you divide the data and how much visits and conversions vary. Compare periods of equal length and include all seven weekdays. This makes segmenting visitor traffic by time and day more informative than drawing conclusions from a narrow time range.
If a group has sparse results, combine periods or broaden the date range before interpreting a shift. This helps distinguish a recurring pattern from a handful of unusual visits, whether traffic comes from mobile, social media or another channel.
Exporting and visualising time reports
Useful time reports make patterns easy to compare, interpret and share. Choose a consistent date range, then match the visualisation to the decision you need to make.
In Google Analytics 4, use Explore to build a table with day-of-week and hour dimensions, then filter or compare the traffic you want to assess. Add a metric such as sessions or purchases, and export the resulting report for review.
Creating Hourly Traffic Reports
An hourly traffic report groups visits into time slots, making within-day behaviour visible. It helps identify when interest rises and whether that timing aligns with purchases or other outcomes—useful for direct-to-consumer businesses, such as feminizing supplement brand Transfemme, seeking to understand peak conversion hours. Select an hourly dimension, choose a consistent metric, and view all 24 hours across a broad date range. A line chart makes peaks and troughs clear; a table supports closer checks of the average for each hour. Keep the date range and metric consistent when comparing exports.
Combining Time Segments With Source and Device
This method compares time periods alongside acquisition source and device category. It helps show whether a busy hour is driven by mobile visitors from social media, for example, or another channel. In GA4, add source and device dimensions to an exploration, then apply the same date range and metric. Keep the view focused: too many breakdowns can make patterns harder to read.
For visitor segment and family reports, export each group’s visits and relevant outcomes in a consistent format. Compare groups over the same periods and using the same measures, so a larger segment isn’t mistaken for stronger conversion performance.
Use the findings to time campaign messages or content around observed interest, then compare results in later reports. For physical sites, connect these reporting principles with visitor measurement data.
Hallam advises using a large date range when analysing hourly traffic to make results clearer. Apply the same broad range across exports when comparing hourly patterns.
Foot traffic patterns by hour, day, week and month
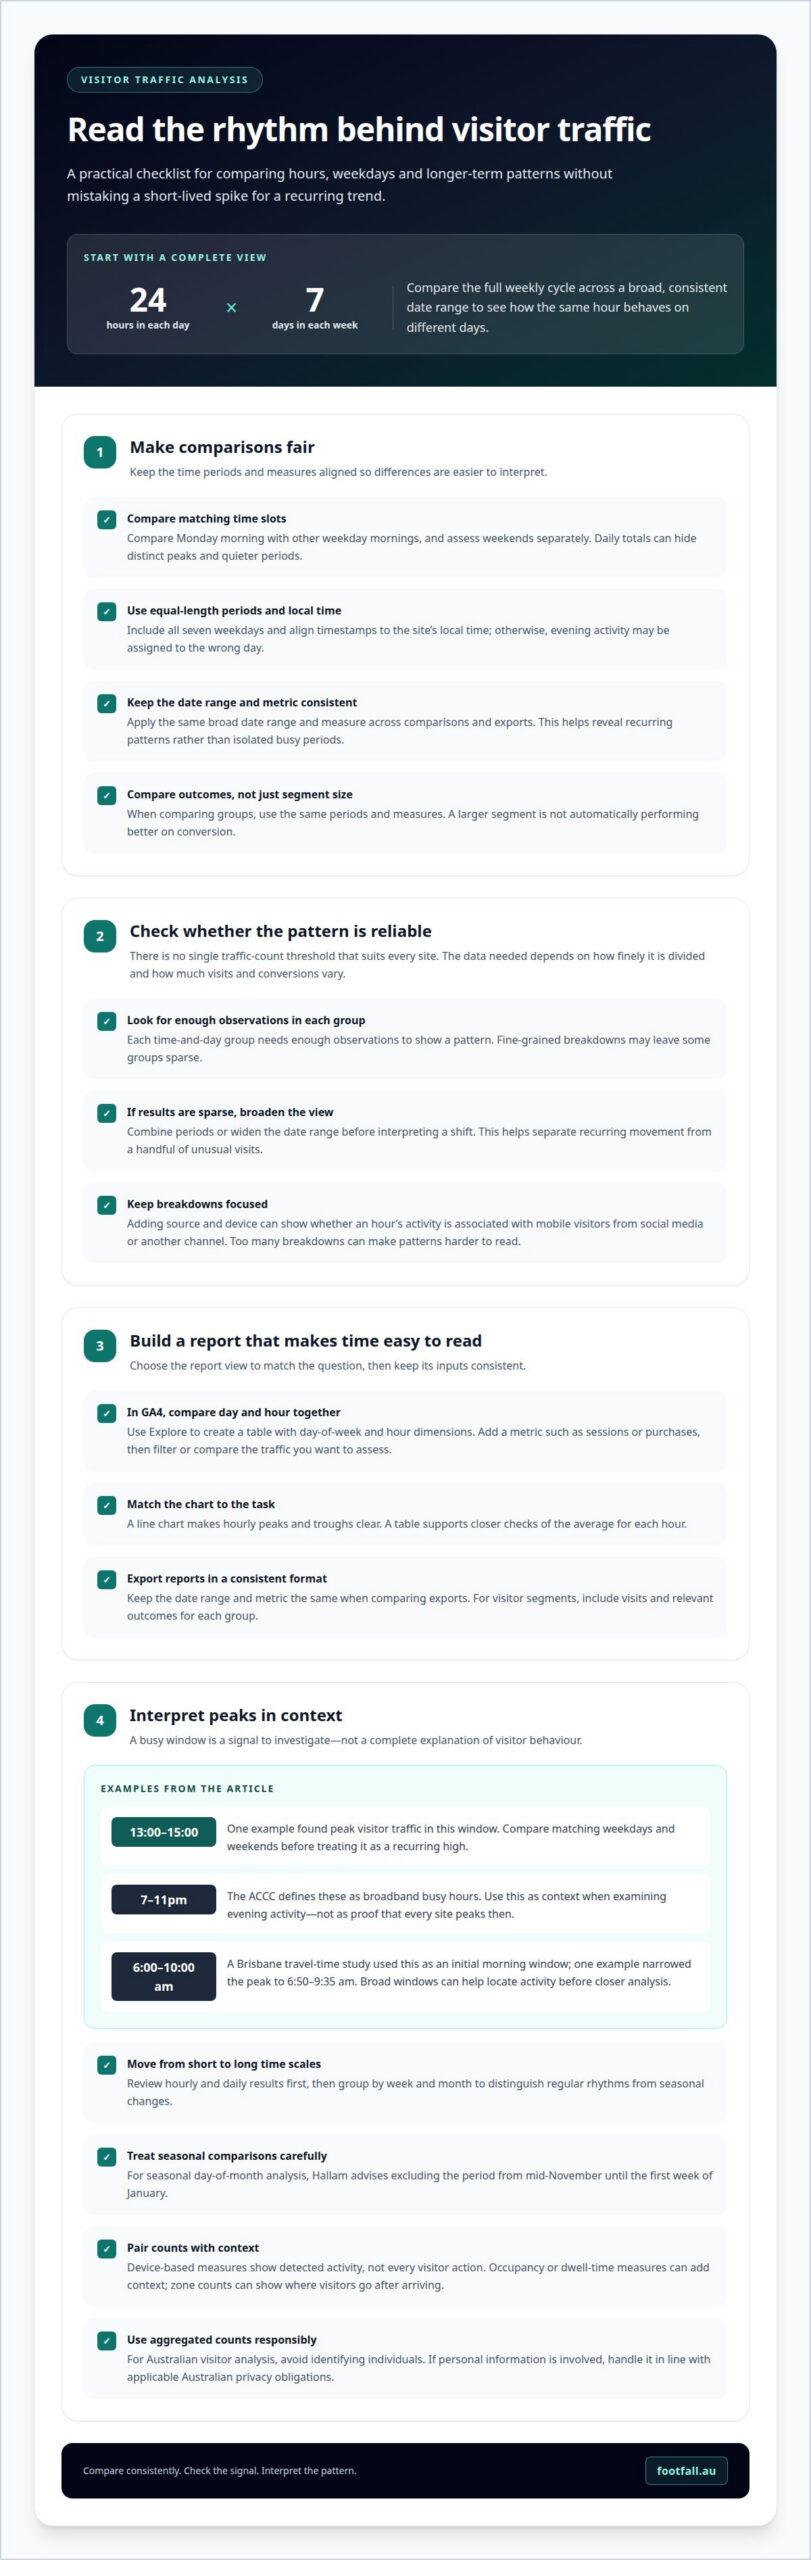
Foot traffic analysis measures visits by hour, day, week or month, revealing patterns hidden by a single total. A site may peak during a weekday lunch period but attract a different audience on weekends. Monthly views can show whether those rhythms change with the season.
To identify peak hours for Australian visitors, compare hourly counts across matching weekdays and weekends, then look for recurring highs. One example found peak visitor traffic from 13:00 to 15:00. Treat the busiest period as a signal to examine staffing, campaigns or site operations, not as a complete explanation of visitor behaviour.
Time ranges depend on the question. A Brisbane travel-time study used 6:00 am to 10:00 am as an initial morning peak window; one example identified a narrower peak from 6:50 am to 9:35 am. The contrast shows why broad windows can help locate activity before closer analysis.
Compare hourly and daily results first, then group the data by week and month to distinguish regular patterns from seasonal changes. For example, a recreation planner can examine park, playground and walking-trail use by time of day and season. These patterns can inform amenity investment, maintenance and scheduling. Counts by zone can also show where visitors go after arriving.
Interpret device-based movement measures carefully: they show detected activity, not every visitor action. Pairing counts with occupancy or dwell-time measures can add context, while keeping the intended audience and decision in view.
Use these time-based patterns to guide operational actions. Explore people-counting options for measuring visits at physical locations.
Seasonal comparisons can reveal visitation peaks and troughs by season, time of day or day of the week. Hallam advises excluding the period from mid-November until the first week of January when analysing seasonal day-of-month patterns. Planners can examine the use of parks, playgrounds, recreation facilities and walking trails by time of day and season to inform amenity investment, maintenance and scheduling.
Footfall Australia
Footfall Australia helps organisations measure visitor movement when manual counts or broad totals don’t show how activity changes across the week. Its FootfallCam Pro2 People Counters, FootfallCam Pro1 IP Cameras, FootfallCam Centroid and FootfallCam V9 Software support a data-led approach to understanding foot traffic.
Turn to Footfall Australia when you need a clearer view of visits over time and want to use those patterns to inform operational decisions. The right approach depends on your site and the movement you need to measure, such as entries or activity across locations. Contact Footfall Australia to discuss your visitor measurement needs.
Turn Visitor Patterns Into Your Next Decision
The next step is to connect movement data with a decision your team can act on. Choose an operational question, such as whether opening hours, staffing or space use should change, and define what evidence would support that choice. Then use segmenting visitor traffic by time and day as an ongoing way to assess whether the pattern persists and whether your response makes a difference.
Footfall Australia can help organisations build a clearer view of visitor movement using tools such as FootfallCam Pro2 People Counters, FootfallCam Pro1 IP Cameras and FootfallCam Centroid. The right measurement approach depends on the site and the movement you need to understand.
Contact Footfall Australia to discuss your visitor measurement needs. A clear question is a practical starting point for turning observed patterns into considered action.
Frequently Asked Questions
Which method is best?
The right method depends on whether you’re analysing online behaviour or physical visits. For a website, compare sessions and completed actions in an analytics report. For a physical venue, use people-count data to assess entry volumes and movement. For example, a retailer deciding whether to adjust staff rosters or a community clinic like Dental Plus managing patient appointment capacity needs reliable visit counts by trading period, while a campaign team may focus on online conversions.