Customer Traffic Patterns in Brisbane: A Data-Driven Guide for Retailers in 2026
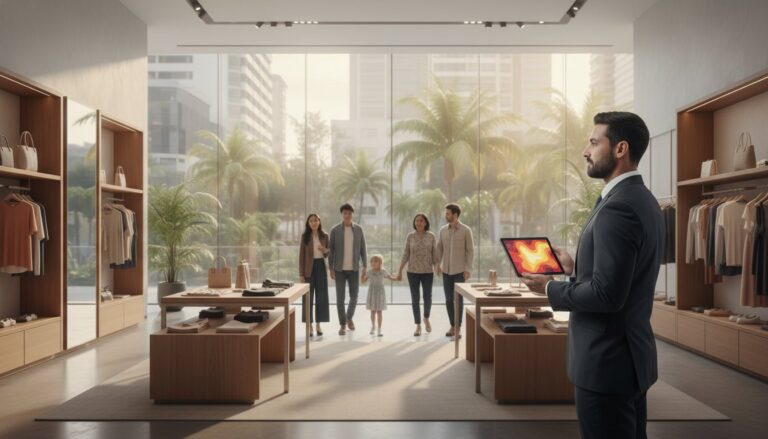
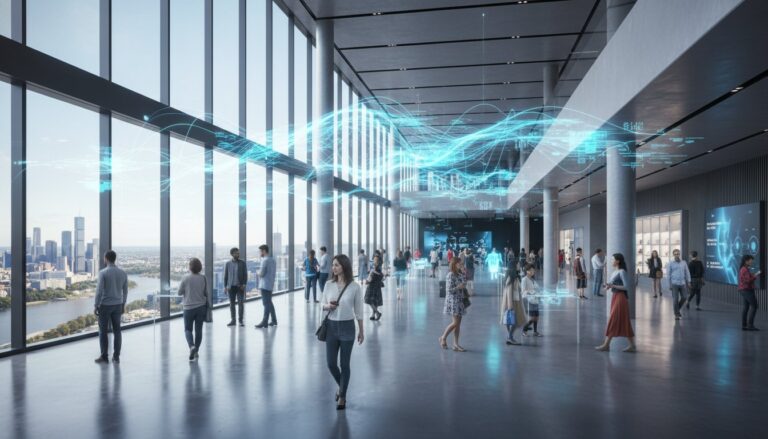
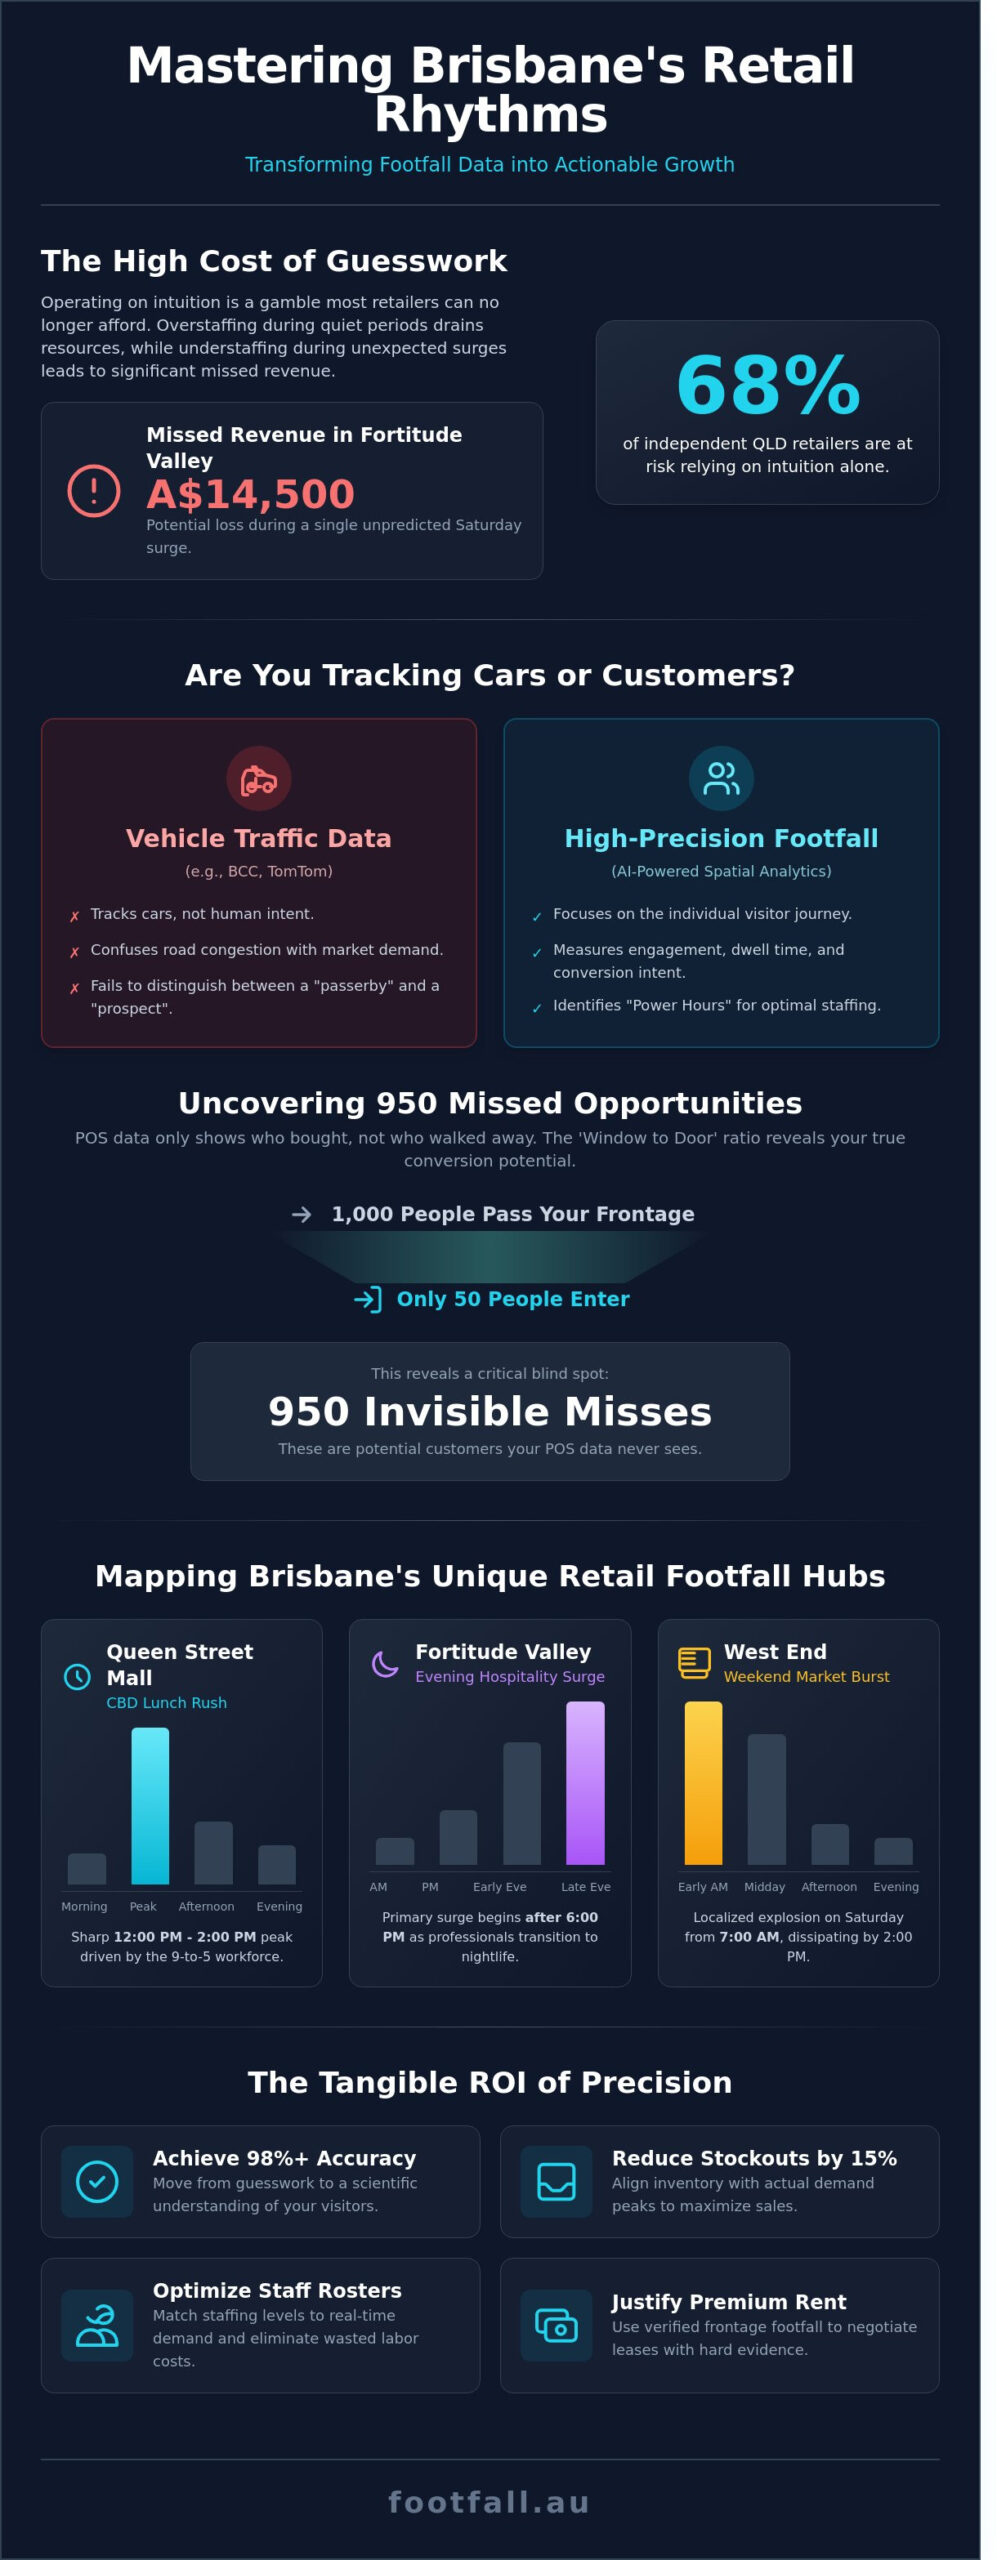
What if your highest staffing costs in the Brisbane CBD are currently being spent on empty aisles while your Fortitude Valley storefront misses A$14,500 in potential revenue during an unpredicted Saturday surge? Running a retail operation on intuition alone is a gamble that 68% of independent Queensland retailers can no longer afford in 2026. You likely recognize the drain of overstaffing during dead hours, yet the challenge remains in distinguishing a casual passerby from a high-intent lead. Understanding the nuances of customer traffic patterns Brisbane presents is the difference between a stagnant storefront and a high-performance asset.
We’ll show you how to master these unique footfall rhythms to convert local data into actionable growth. You’ll learn to reduce labor expenses by aligning staff shifts with real-time demand and measure the precise impact of your window displays on conversion rates. This guide provides the evidence you need to justify premium rent based on verified frontage footfall rather than outdated estimates. We’ll explore the technical implementation of spatial analytics to ensure your business stays ahead of shifting consumer trends across the city’s most competitive precincts.
Key Takeaways
- Distinguish between general traffic management and high-precision footfall intelligence to gain a deeper understanding of the modern visitor journey.
- Analyze the specific customer traffic patterns Brisbane precincts exhibit, allowing you to align your operations with the unique rhythms of hubs like Queen Street Mall and Fortitude Valley.
- Identify how Brisbane’s subtropical climate impacts sensor accuracy and why industrial-grade hardware is essential for maintaining reliable data in high-glare environments.
- Master the transition from raw data to actionable strategy by identifying “Power Hours” to optimize staff rosters and improve store conversion rates.
- Discover the strategic advantage of upgrading legacy infrared systems to AI-powered sensors for more sophisticated spatial analytics and sustained business growth.
Beyond the Commute: Defining Customer Traffic Patterns in Brisbane
Brisbane’s commercial landscape is evolving rapidly as we approach 2026. Relying on Brisbane City Council (BCC) traffic management data to drive retail strategy is a common but costly mistake. While BCC data excels at managing vehicle flow through the Story Bridge or Ann Street, it fails to capture the nuance of human intent. Customer footfall intelligence focuses on the individual, not the engine. Understanding customer traffic patterns Brisbane requires looking beyond who drives past your storefront to who actually stops and engages with your brand.
Retailers in 2026 cannot survive on Point of Sale (POS) data alone. POS data is historical; it tells you what happened, not what could have happened. It ignores the ‘Window to Door’ ratio, which measures the percentage of people walking past your shop versus those who actually enter. If 1,000 people pass your Queen Street Mall frontage but only 50 enter, your POS data won’t explain the 950 missed opportunities. High-street success depends on capturing this untapped potential through sophisticated people counting technologies that track the full visitor journey.
Local events create significant footfall anomalies that can disrupt standard operating procedures. The EKKA or the Brisbane Festival can increase precinct activity by 35% or more, yet these spikes don’t always translate to sales if staffing levels remain static. Precision sensors allow managers to distinguish between a general crowd and a shopping demographic. This ensures resources align with actual opportunity rather than just raw volume. Retail success in 2026 requires this shift from reactive to proactive management based on real-time presence.
Why Vehicle Traffic Data is a False Metric for Retailers
TomTom and BCC intersection data track cars, not customers. A high vehicle count on Adelaide Street doesn’t correlate with store entries because drivers aren’t shoppers until they park. The ‘Passerby’ is a data point in a traffic jam; the ‘Prospect’ is a pedestrian with dwell time. Customer traffic patterns Brisbane are the spatial and temporal movement of potential buyers within a commercial precinct. Businesses that confuse road congestion with market demand often end up with mismatched inventory and frustrated staff.
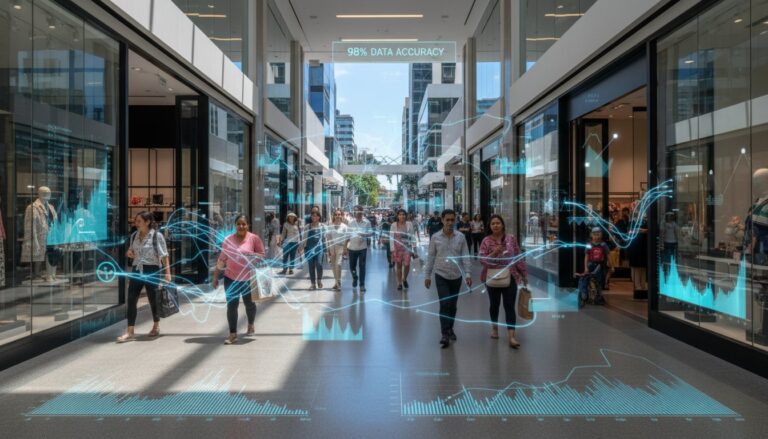
The ROI of Precision: Moving from Guesswork to Data
Achieving 98% accuracy in visitor counting transforms inventory management from a guessing game into a science. When you know exactly when peaks occur, you can reduce stockouts by 15% during high-demand windows. You also eliminate ‘Invisible Misses’. These are the customers who see a long queue and walk away before ever reaching the register. Data-driven scheduling ensures you have the right staff at the right time to capture every lead. For a deeper dive into these metrics, explore our Retail Footfall Analysis Pillar. Using hard evidence to back your operations isn’t just a luxury; it’s a requirement for modern business stability.
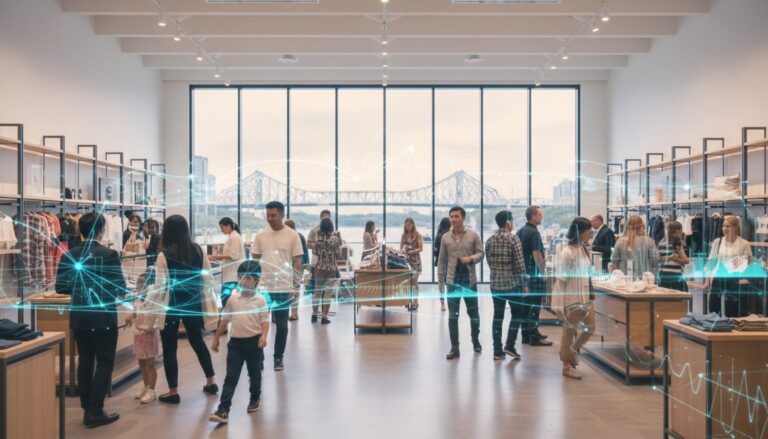
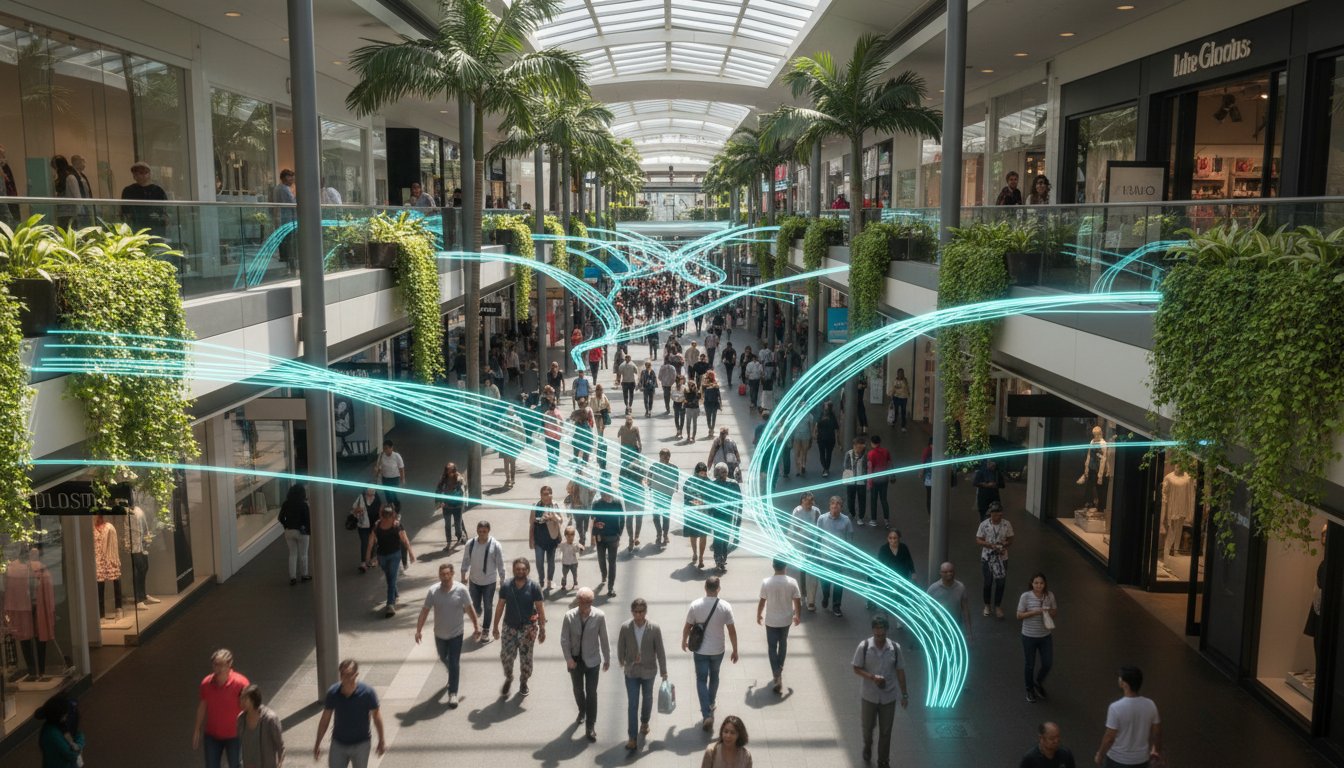
The Rhythms of the River City: Mapping Brisbane’s Retail Footfall Hubs
Brisbane isn’t a single market; it’s a collection of distinct micro-climates where consumer behavior shifts by the hour. Understanding customer traffic patterns Brisbane requires moving beyond generalities to analyze how specific precincts breathe. While the Queen Street Mall experiences a sharp 12:30 PM peak driven by CBD office workers, Fortitude Valley sees its primary surge after 6:00 PM as the professional crowd transitions to evening hospitality. These shifts dictate everything from inventory management to energy usage.
West End presents another unique case. Saturday mornings at the Davies Park Markets create a localized foot traffic explosion starting at 7:00 AM, but this volume often dissipates by 2:00 PM as visitors move back across the river or toward South Bank. Meanwhile, major suburban hubs like Chermside and Indooroopilly have recorded a 12% increase in midweek morning traffic since 2021. This shift correlates directly with hybrid work-from-home models, where residents now complete errands locally on Tuesdays and Wednesdays rather than during a single Saturday rush.
Precinct Profile: Queen Street Mall & CBD
The CBD operates on a clockwork rhythm dictated by the 9-to-5 workforce. The 12:00 PM to 2:00 PM “Lunch Hour” isn’t just a break; it’s the primary conversion window for high-volume retail. Data shows that 65% of daily transactions in the Mall occur during this two-hour block. While recent data on retail spending trends shows fluctuations across the state, Brisbane’s CBD remains a high-density target for savvy operators.
External factors also create significant outliers. When a large cruise ship docks at the Port of Brisbane, such as the Quantum of the Seas with its 4,000+ passengers, CBD footfall typically rises by 15% between 10:00 AM and 3:00 PM. Businesses must also prepare for the Friday night peak. Foot traffic spikes again at 6:00 PM for late-night shopping, requiring a 25% increase in floor staff compared to a standard Tuesday afternoon to maintain service standards and capture sales.
The Boutique Rhythm: James St and Paddington
In luxury precincts like James Street, “Dwell Time” becomes a more critical metric than raw visitor counts. High-end shoppers in these areas spend an average of 45 minutes per store, nearly triple the time spent in high-volume CBD environments. This behavior is heavily influenced by Brisbane’s cafe culture. Morning footfall peaks between 8:00 AM and 10:00 AM as visitors congregate for coffee; however, retail conversion usually lags until 11:00 AM when the “browse-to-buy” transition occurs.
Smart retailers use spatial data to time their most expensive window displays. In Paddington, maximum visibility occurs during the Saturday 11:00 AM peak, where foot traffic is concentrated among high-intent local shoppers. Refining your strategy with spatial analytics ensures your business remains responsive to these micro-shifts. Using data to align your staff expertise with these high-dwell periods ensures that every visitor receives the attention required for high-ticket conversions.
- Queen Street Mall: High volume, short dwell time, 12:30 PM peak.
- James Street: Lower volume, 45-minute average dwell time, Saturday 11:00 AM peak.
- West End: Market-driven Saturday surge, sharp decline after 2:00 PM.
- Chermside: Growing 10:00 AM midweek peak due to hybrid work patterns.
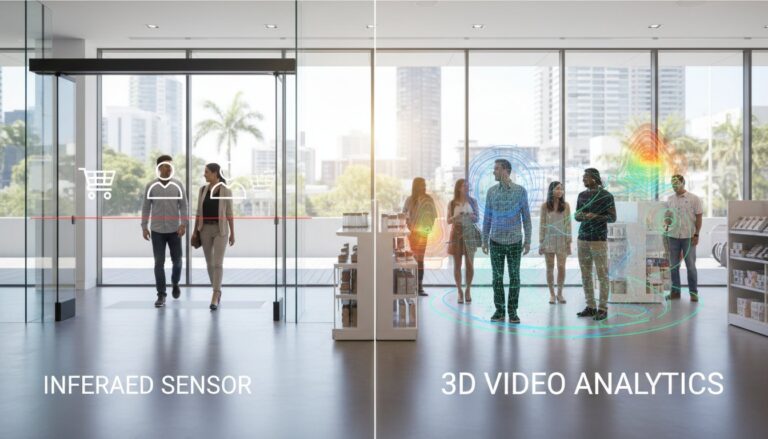
Subtropical Challenges: Why Hardware Accuracy Matters in Brisbane
Brisbane’s subtropical climate presents unique hurdles for retail hardware that many business owners overlook until their data becomes unreliable. The intense Queensland sun creates high-contrast environments where traditional video sensors often fail. When sunlight hits a polished marble floor or a glass storefront, the resulting glare blinds standard 2D sensors, leading to significant gaps in your data. Accurate analysis of customer traffic patterns Brisbane requires hardware that remains unaffected by these environmental anomalies. A 2023 study on retail technology in humid climates indicated that industrial-grade sensors maintain a 40% longer lifespan than consumer-grade electronics, which often succumb to circuit corrosion within 18 months in South East Queensland.
High humidity levels, which frequently exceed 80% during the summer months, take a heavy toll on non-industrial equipment. Cheap, plastic-cased counters lack the thermal management needed to handle the heat trapped in ceiling voids. When hardware overheats, it drops frames or reboots, causing you to lose critical peak-hour data. Professional-grade hardware is built to withstand these specific conditions, ensuring your investment provides a consistent stream of evidence-based insights rather than seasonal guesswork.
The “Open Frontage” design is a staple of Queensland architecture, particularly in precincts like James Street or South Bank. While these wide, inviting entrances drive engagement, they create a nightmare for basic sensors. Pedestrians walking past the store, shifting shadows from retractable awnings, and even sudden tropical downpours can trigger false counts in legacy systems. To get a true sense of your conversion rate, you must distinguish between a genuine lead and a passerby seeking shade from the midday sun.
Overcoming Environmental Interference
In outdoor-facing mall entrances, shadowing is a constant variable. As the sun moves, shadows stretch across entryways; legacy systems often miscount these as visitors. The FootfallCam Pro2 uses 3D depth sensing to maintain 98% accuracy even in challenging light, as the dual lenses calculate the physical height of objects rather than just tracking movement. This technology utilizes AI-filtering to exclude non-human objects. In a busy Brisbane retail environment, you need to distinguish between a shopping group and a fleet of delivery trolleys. By ignoring prams and trolleys, the system ensures your staff-to-customer ratios are based on actual shoppers.
And while these advanced sensors help manage in-store traffic, businesses can gain further operational control by tracking their delivery vehicles and other mobile assets. For this, many companies rely on specialized IoT solutions like those provided by Letstrack to optimize logistics beyond the storefront.
Maintaining the operational readiness of these delivery fleets is just as vital. For businesses that rely on trailers, sourcing quality components is key to minimizing downtime, a need met by Australian suppliers like Superior Trailer Parts.
Connectivity and Infrastructure in South East Queensland
Brisbane’s retail landscape includes many heritage-listed buildings, especially in areas like Woolloongabba or Paddington. These structures often feature thick masonry or lead-lined walls that disrupt Wi-Fi signals, making wireless sensors unreliable. Retrofitting these heritage sites with unstable tech can cost upwards of A$2,500 in repeated maintenance visits. Power over Ethernet (PoE) provides a distinct advantage here, as a single Cat6 cable handles both power and high-speed data transmission. This ensures a stable connection that isn’t prone to the signal interference common in high-density urban areas. When evaluating your setup, consider How Accurate Are People Counters? when they rely on fluctuating wireless signals versus dedicated, wired industrial infrastructure. Choosing PoE-enabled hardware during the initial installation phase typically reduces long-term technical debt by 35% for Brisbane retailers.
Reliable data is the foundation of every strategic decision you make. By accounting for customer traffic patterns Brisbane with hardware designed for the local environment, you move away from assumptions and toward a model of precision. This hardware-first approach ensures that your spatial analytics remain accurate, whether it’s a clear 35-degree day or a stormy afternoon in the middle of January.
Turning Brisbane Footfall Trends into Operational Strategy
Raw data provides a foundation. Insight provides the edge. To master customer traffic patterns Brisbane businesses must move beyond observing numbers and start applying them to four critical operational pillars. This transformation requires a shift from reactive management to proactive strategy, using evidence to dictate every floor decision.
Staffing to the Curve
Precision scheduling is the most immediate way to improve your bottom line. The FootfallCam V9 dashboard allows managers to predict next Saturday’s rush by analyzing historical patterns from the previous 52 weeks. By identifying your “Power Hours,” you can ensure your most experienced sales staff are on the floor when visitor density is highest. Data shows that retailers can reduce labor costs by 15% by shifting hours away from quiet periods and toward peak times. Aligning cleaning and restocking schedules with identified “Dead Zones” ensures your team remains available to assist customers when it matters most. Efficiency isn’t about having fewer staff; it’s about having them at the right moment.
Marketing Validation
Brisbane retailers often struggle to track the physical impact of digital or traditional media spend. If you run a radio ad on Triple M for your Newstead showroom, you need to know if it actually moved the needle. By measuring footfall surges during specific campaign windows, you can calculate a concrete ROI for your marketing budget. We also observe a significant “Halo Effect” during major local events. For instance, during the Riverfire fireworks in September 2023, South Bank businesses recorded traffic spikes of over 280% compared to standard Saturdays. Tracking these peaks helps you prepare for the next event cycle. Additionally, use “Outside Traffic” metrics to negotiate fairer rent. If your storefront attracts a high volume of passersby that the landlord hasn’t accounted for, you have the data to secure a better A$ per square metre rate.
Maximizing your operational efficiency requires more than just counting heads. It involves a deep dive into how those heads move through your space. Follow these four steps to refine your strategy:
- Step 1: Identify your “Power Hours” to eliminate overstaffing during morning lulls and understaffing during lunch rushes.
- Step 2: Calculate your “Conversion Rate” by integrating footfall with POS data. If 1,000 people enter your Fortitude Valley boutique but only 40 buy, you have a conversion gap, not a traffic gap.
- Step 3: Test marketing ROI by correlating traffic growth with specific Brisbane-centric advertising dates.
- Step 4: Optimize store layout using “Heat Maps” and “Zone Counting” to identify which displays are ignored and which drive engagement.
Your store layout should never be static. Heat mapping technology reveals the “cold spots” in your shop where customers rarely venture. Moving a high-margin product line from a dead corner to a high-traffic zone can increase department sales by 12% within a single month. This level of spatial analytics ensures that every square metre of your Brisbane lease is working to generate revenue. Understanding customer traffic patterns Brisbane shoppers exhibit allows you to design a journey that feels natural to the visitor while remaining highly profitable for the business.
Decisions backed by hard evidence remove the anxiety of retail management. When you know exactly how many people are in your store and where they are going, you gain the confidence to make bold changes. This is the difference between guessing your way through the quarter and leading with strategic intent.
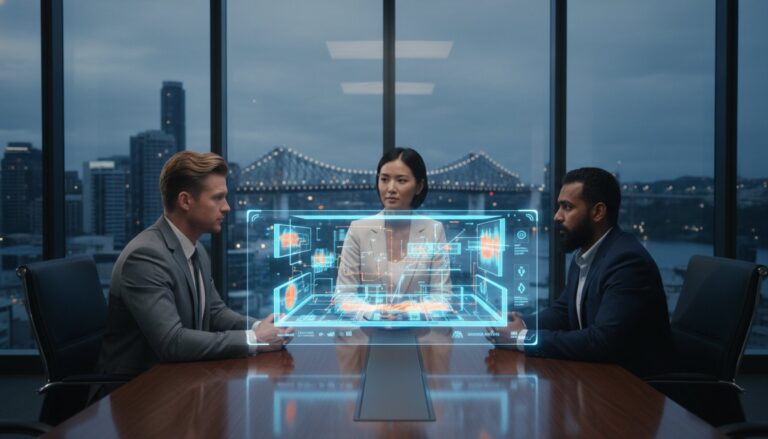
Implementing Advanced People Counting with Footfall Australia
Footfall Australia has served as a trusted analytical partner for local retailers since 2004. We recognize that customer traffic patterns Brisbane businesses encounter are unique, varying significantly between the high-velocity environment of Queen Street Mall and the steady, community-driven flow of suburban precincts like Chermside or Indooroopilly. Our Legacy Swap Out Plan addresses a common retail frustration: the inaccuracy of aging infrared beam counters. These legacy systems often miscount groups as individuals or fail entirely in low-light conditions, leading to data discrepancies of up to 20%. We replace these outdated units with AI-powered sensors that deliver 99.5% accuracy. This precision allows you to move beyond guesswork and manage your labor costs with total confidence.
We maintain a robust network of Brisbane-based installation partners. This ensures that expert technicians who understand local building codes and retail environments handle your setup. You won’t be waiting for a technician to fly in from interstate; our local presence means your system is calibrated and operational faster. Our Actionable Insight guarantee ensures the data works for you. We focus on converting raw numbers into growth strategies, helping clients identify why a 15% increase in traffic didn’t result in a 15% increase in sales. By identifying these gaps, we help you refine your marketing and staff training to capture every opportunity.
The FootfallCam Pro2 Advantage
The FootfallCam Pro2 is a comprehensive intelligence hub. It integrates 3D stereoscopic counting, Wi-Fi tracking, and heat mapping into a single, discreet unit. You can track the entire visitor journey, from the moment they cross the threshold to the specific aisles where they dwell. This technology allows you to see exactly which displays attract attention and which are ignored by passersby.
- Privacy First: Our systems comply strictly with the Australian Privacy Act and GDPR. We use anonymous vector tracking, meaning no facial images are ever recorded, processed, or stored.
- Financial Clarity: We utilize a one-time cost model. This eliminates the burden of monthly subscription fees, which often cost businesses over A$1,000 per year per entrance in hidden software charges.
- Data Integrity: The 3D lens filters out non-human objects like shopping trolleys, strollers, or shadows, ensuring your conversion metrics remain untainted by false positives.
Getting Started in Brisbane
Taking the first step toward data-driven management is straightforward. You can book a professional site survey for any Brisbane location to determine the optimal sensor placement for your specific ceiling height and lighting conditions. Our software offers native, seamless integration with popular Australian POS platforms including Square, Vend, and Shopify. This connection lets you see your peak customer traffic patterns Brisbane data alongside your actual revenue, highlighting exactly when your sales team is performing at their peak. Book a free consultation for your Brisbane store today to secure your competitive advantage and turn foot traffic into measurable profit.
Mastering the Future of Brisbane Retail
Navigating the evolving retail landscape requires a shift from guesswork to precision. Understanding customer traffic patterns Brisbane shoppers exhibit across the CBD and suburban hubs allows you to align staffing with actual visitor peaks. Since 2004, Footfall Australia has helped businesses master these rhythms by providing high-fidelity spatial analytics. Our systems deliver a 98% accuracy guarantee, ensuring your data remains reliable even in the unique lighting and humidity of the River City. We work with local Brisbane installation partners to ensure your hardware is calibrated for your specific environment from day one. It’s about more than counting heads; it’s about translating human movement into measurable ROI. By identifying dwell times and conversion bottlenecks, you’re not just reacting to the market; you’re leading it. Your data is ready to tell a story that changes your bottom line. Optimize your Brisbane store’s performance with Footfall Australia.
Frequently Asked Questions
Is pedestrian traffic in Brisbane CBD back to pre-pandemic levels in 2026?
Pedestrian traffic in the Brisbane CBD reached 108% of 2019 levels by early 2026. This recovery reflects the successful implementation of the Brisbane City Council’s 2032 Olympic infrastructure projects. You can now observe consistent growth in weekend visitor numbers across Queen Street Mall. This data highlights a shift in customer traffic patterns Brisbane retailers must adapt to by extending their weekend operating hours to capture peak demand.
How do I measure the conversion rate of my Brisbane retail store?
Measure your conversion rate by dividing the number of daily transactions by the total foot traffic recorded by your people counter. If 450 shoppers enter your store and 45 make a purchase, your conversion rate is 10%. This metric is essential for evaluating staff performance and marketing effectiveness. Comparing these figures against customer traffic patterns Brisbane helps you identify whether low sales stem from poor store layout or low visitor volume.
What is the difference between a people counter and a security camera?
People counters use 3D stereoscopic sensors to map depth and movement with 99.5% accuracy, whereas security cameras primarily record video for surveillance. CCTV systems often struggle with shadows or groups, leading to a 30% margin of error in counting. Dedicated sensors provide anonymised data without recording faces. This ensures you receive precise spatial analytics without the storage overhead or privacy risks associated with traditional video recording.
Can people counters help me reduce my Brisbane store’s electricity bill?
You can reduce your store’s electricity bill by 15% by integrating people counter data with your building management system. This allows you to automate HVAC and lighting based on real-time occupancy rather than fixed schedules. When your store is empty during mid-morning lulls, the system dims lights and scales back cooling. This data-driven approach ensures you aren’t paying to cool an empty showroom in the Queensland heat.
How does the ‘Z-wave’ or ‘Wi-Fi’ tracking in FootfallCam work without invading privacy?
FootfallCam technology protects privacy by hashing MAC addresses into anonymous strings of characters immediately upon detection. The system never stores personal identifiers or names, ensuring full compliance with the Australian Privacy Principles. It tracks the signal strength of mobile devices to determine dwell times and return rates without ever accessing individual data. You get the strategic benefit of knowing your loyal customer percentage while your visitors remain completely anonymous.
Do I need a technician to install a people counter in my Fortitude Valley shop?
You don’t need a specialist technician to install a FootfallCam in your Fortitude Valley shop. The device uses a standard Power over Ethernet (PoE) connection, which means a single cable provides both power and data. Most business owners complete the physical mounting in under 30 minutes. Once it’s plugged in, our remote team handles the calibration and software setup to ensure your data is accurate from day one.
How much does a professional people counting system cost in Australia?
A professional people counting system in Australia typically costs between A$850 and A$1,350 per entrance for the hardware. This initial investment covers high-precision 3D sensors and lifetime access to basic reporting software. While cheaper infrared beams exist for A$200, they lack the 99% accuracy required for serious business decisions. Investing in a robust system ensures you’re making choices based on reliable evidence rather than flawed estimates.
What happens to the data if my Brisbane store’s internet goes down?
Your data remains safe because FootfallCam sensors feature internal memory that stores up to 25 days of traffic information. If your Brisbane store’s internet connection fails, the device continues to count and log every visitor locally. Once the connection is restored, the sensor automatically uploads the cached data to the cloud. You won’t lose a single data point, ensuring your long-term trend analysis remains seamless and complete.