Avoiding Overstaffing in Retail: A Data-Driven Strategic Guide for 2026
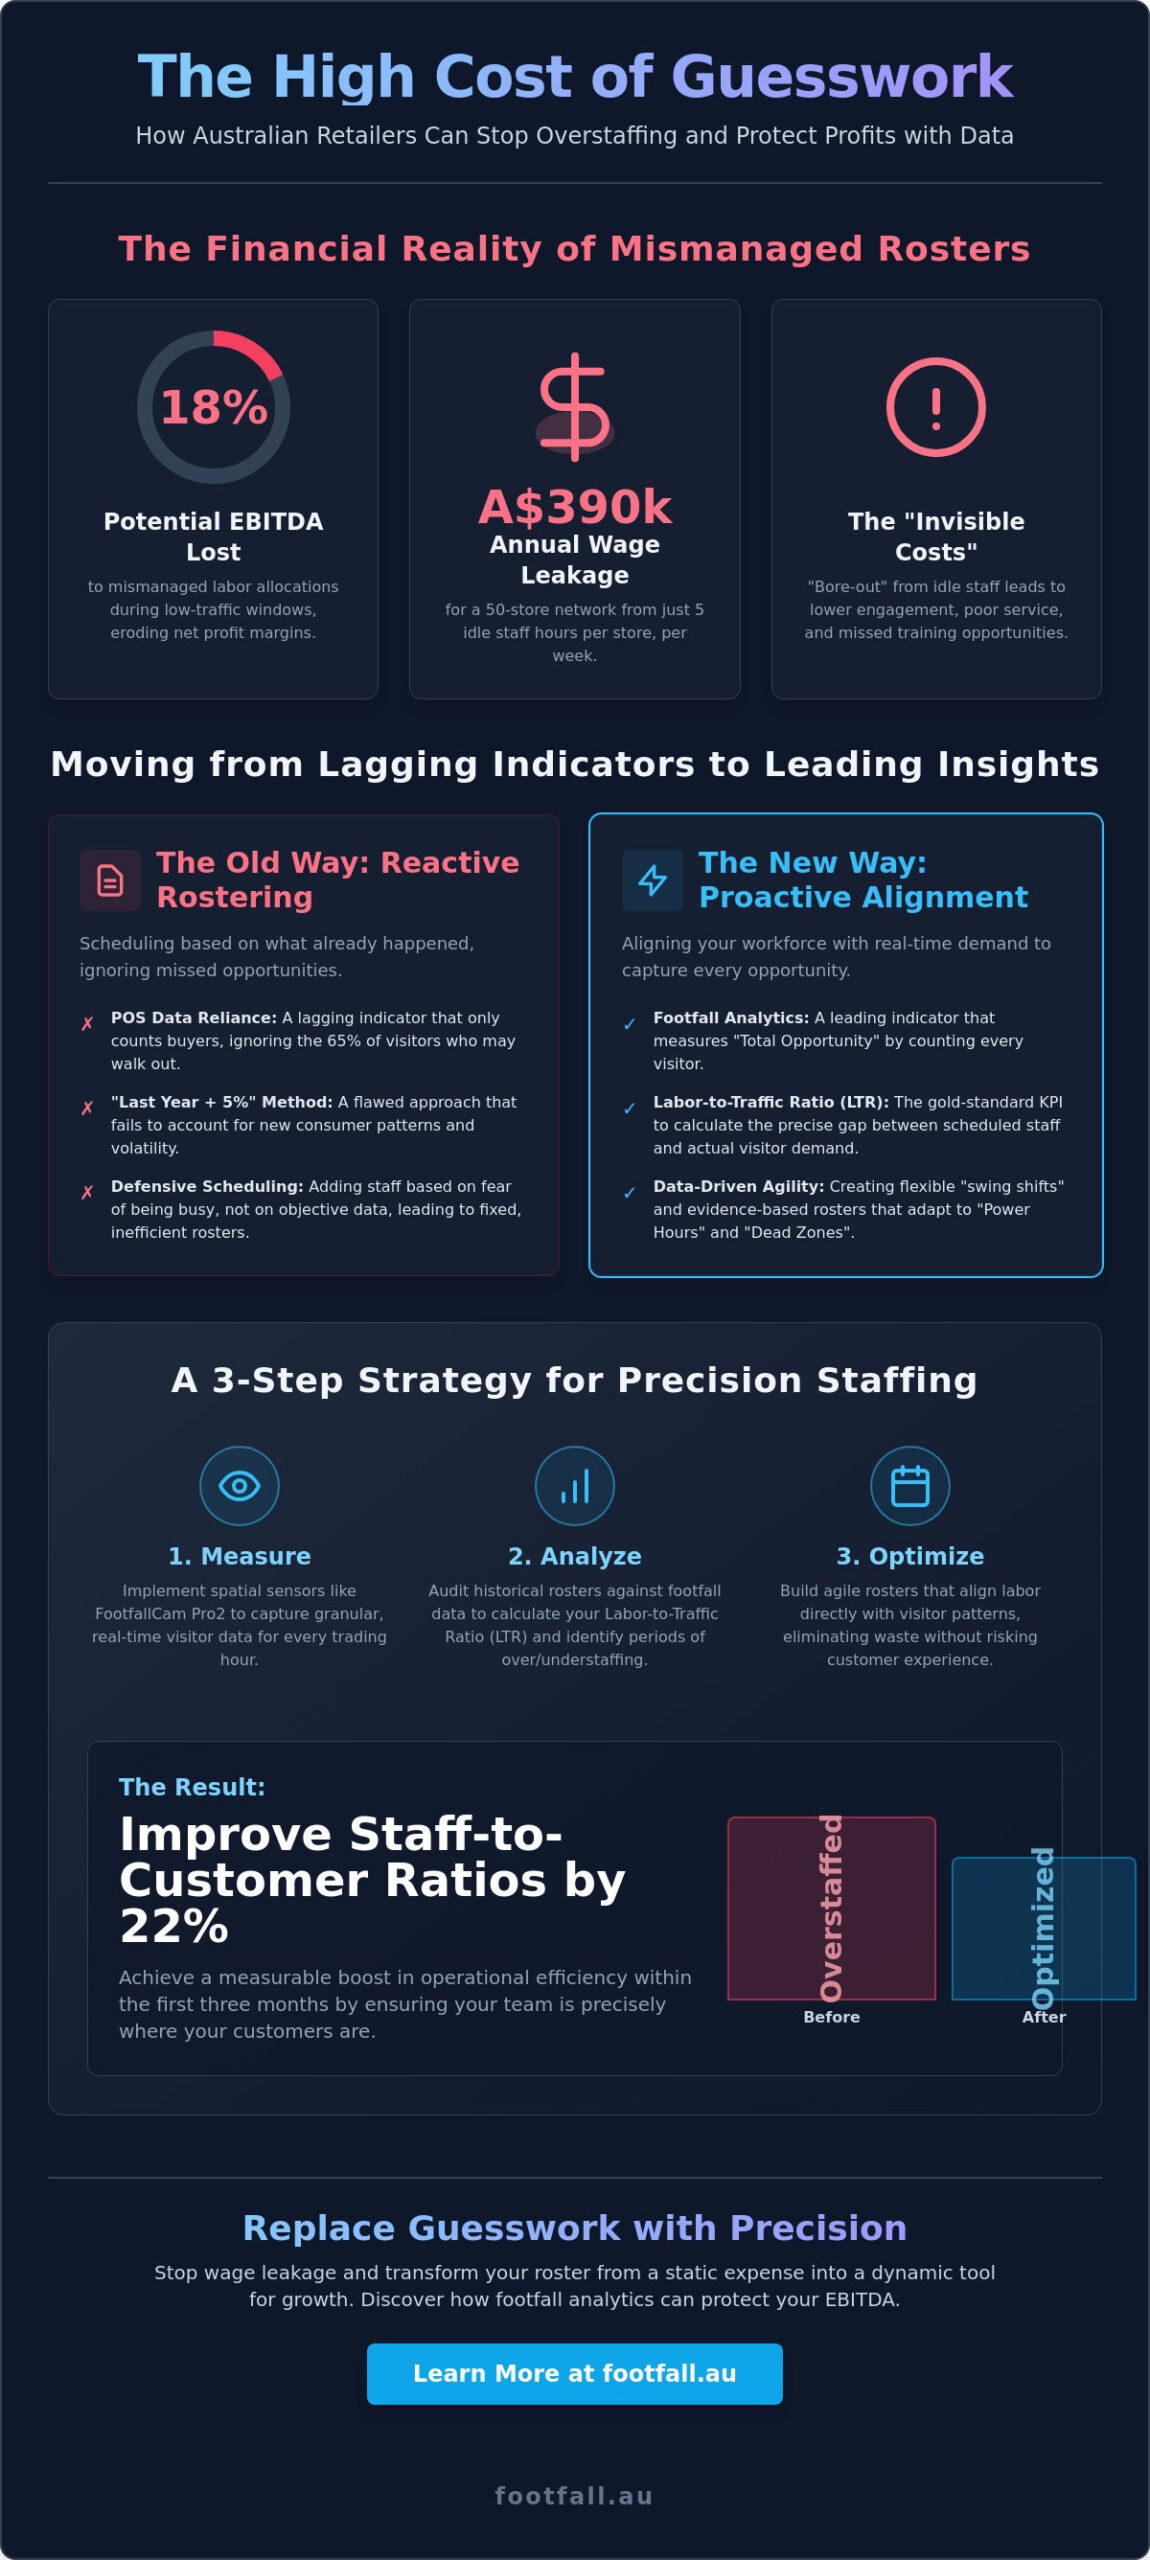
What if your Tuesday morning roster is costing you A$450 in wasted wages every single week? According to 2024 retail productivity reports, Australian businesses lose up to 18% of their potential EBITDA to mismanaged labour allocations during low-traffic windows. Avoiding overstaffing in retail is no longer just a cost-cutting exercise; it’s a critical survival strategy as Fair Work award rates continue to rise. You’ve likely experienced the frustration of watching staff stand idle while overheads climb, yet you hesitate to reduce hours for fear of missing a sudden sales surge.
It’s a delicate balance that gut feeling alone can’t maintain in the 2026 market. This strategic guide provides the framework to replace guesswork with precision foot traffic analytics. You’ll learn how to align your workforce with actual visitor patterns to eliminate unnecessary overheads without compromising the customer experience. We’ll detail the technical implementation of spatial sensors and how translating human movement into actionable data can improve your staff-to-customer ratios by 22% within the next three months.
Key Takeaways
- Protect your EBITDA and net profit margins in the high-wage Australian market by avoiding overstaffing in retail through precision-led workforce alignment.
- Understand why POS transaction data is a lagging indicator and how footfall analytics reveals the “Total Opportunity” for every trading hour.
- Master the Labor-to-Traffic Ratio (LTR), the gold standard KPI for calculating the exact delta between scheduled labour and actual visitor demand.
- Implement a robust two-phase strategy to audit historical rosters and establish flexible “swing shift” protocols for better operational agility.
- Leverage the FootfallCam Pro2 and local Australian technical support to ensure granular data accuracy and seamless integration into your management workflow.
The Economic Reality of Overstaffing in Australian Retail
Efficiency in retail begins with precision. Overstaffing isn’t just a scheduling hiccup; it’s the measurable delta between scheduled labour hours and real-time visitor demand. In the Australian market, where the national minimum wage increased to A$24.10 per hour in July 2024, every unoptimized minute directly erodes EBITDA. When floor coverage exceeds foot traffic, net profit margins shrink under the weight of unnecessary overhead. This financial drag is particularly acute for mid-market retailers operating on tight 5% to 8% margins, where a slight misalignment in staffing can wipe out a day’s profit.
Excess staff don’t just cost money; they lose momentum. This phenomenon, known as “bore-out,” occurs when employees lack meaningful tasks, leading to a sharp decline in engagement and service quality. Beyond the immediate payroll hit, overstaffing creates an “invisible cost” through the decay of operational discipline. When teams aren’t busy, they often miss critical training opportunities and lose the sharp focus required for high-conversion sales. Avoiding overstaffing in retail is therefore as much about maintaining a high-performance culture as it is about balancing the books.
Why Traditional Rostering Fails
Many retailers still rely on the “last year plus 5%” methodology to predict their needs. This approach is fundamentally flawed for 2026 because it ignores shifting consumer patterns and local volatility. Store managers often engage in “defensive scheduling,” adding extra shifts based on anecdotal fears of being understaffed rather than objective data. Fixed rosters cannot survive a landscape where visitor surges are erratic and driven by digital trends. Implementing modern Workforce optimization strategies allows brands to move away from these legacy habits and toward a model of evidence-based agility.
The Financial Consequences of Wage Leakage
Consider a national network of 50 stores. If each store carries just 5 idle hours per week at an average retail rate of A$30 per hour, including on-costs, the business loses A$390,000 annually. This capital could otherwise fund store upgrades, new inventory, or aggressive digital marketing campaigns. Wage leakage is the primary drain on retail agility. By avoiding overstaffing in retail, businesses reclaim this lost capital, ensuring that every dollar spent on payroll generates a measurable return through improved customer service and increased conversion rates. Moving toward a data-driven model transforms the staff roster from a static expense into a dynamic tool for growth.
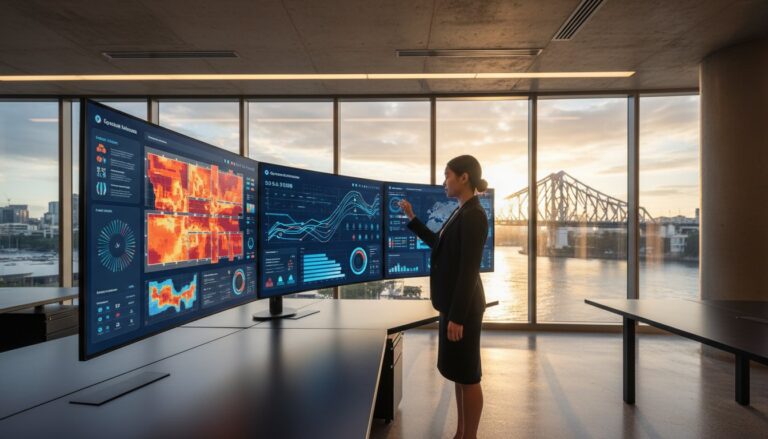
Moving Beyond POS: The Science of Footfall Data
Transaction data records the past. It tells you what happened, but it rarely explains why. Relying solely on Point of Sale (POS) logs is a primary reason retailers struggle with labour costs. When you schedule based on yesterday’s sales volume, you ignore the 65% of visitors who might have walked out empty-handed. Footfall data serves as the “Total Opportunity” metric, capturing every potential sale that enters your doors each hour. This shift in perspective is vital for avoiding overstaffing in retail while ensuring no revenue is left on the table.
AI-driven people counting transforms raw numbers into a strategic map. It identifies “Power Hours” where traffic surges and “Dead Zones” where staff are essentially paid to wait. Transitioning from reactive to proactive management requires looking at historical traffic patterns rather than just sales receipts. This allows managers to anticipate demand before the rush starts, rather than calling in extra help when it’s already too late.
Lagging vs. Leading Indicators
POS data is a lagging indicator; it only identifies the people who successfully navigated your store and decided to buy. It doesn’t show you the customers who couldn’t find assistance or those who left because of long queues. High traffic paired with low sales is a clear sign you’re losing sales due to inadequate staffing during peak windows. Conversely, low traffic with high sales suggests your current roster is too heavy for the actual opportunity present.
Integrating people counting technology with your POS system provides a complete view of your conversion rate. This data allows you to see exactly where your labour spend is working and where it’s being wasted. In the Australian market, where award rates make every hour expensive, this precision is a competitive necessity.
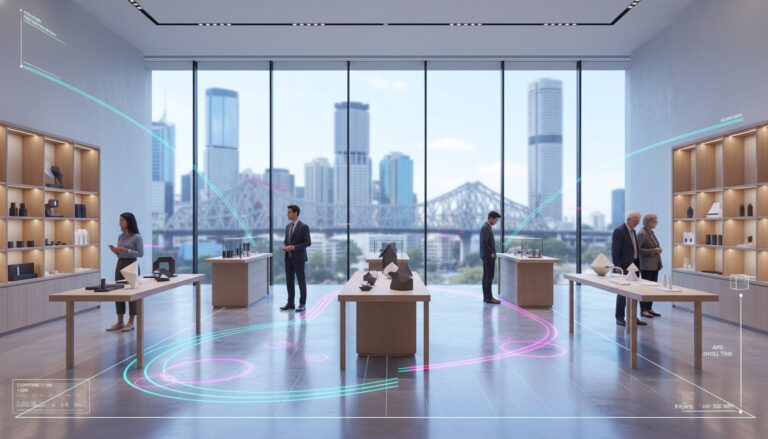
Spatial Analytics and Dwell Time
Modern AI sensors offer 98% accuracy or higher, providing a reliable foundation for your rostering decisions. Spatial analytics go beyond simple entry counts by measuring dwell time in specific zones. If customers spend an average of 15 minutes in the electronics section but only 3 minutes in accessories, your staffing should mirror that engagement level. Detailed footfall data analysis helps identify bottlenecks that mimic busy periods. A queue at a fitting room might look like a high-traffic event, but it’s often a sign of operational friction rather than a need for more floor staff.
Using these insights, you can move away from “gut feel” scheduling. You’ll know exactly which departments require a human touch and which can operate with minimal oversight. This evidence-based logic ensures every A$ spent on wages is an investment in conversion. You can refine your workforce strategy by aligning staff presence with the actual movement of your customers.
Benchmarking Your Labor-to-Traffic Ratio (LTR)
Measuring labor as a percentage of sales is a lagging indicator that tells you what happened yesterday rather than what is happening now. The Labor-to-Traffic Ratio (LTR) serves as the gold standard KPI for 2026 because it quantifies your service capacity against real-time demand. By focusing on LTR, managers move away from reactive scheduling and toward a proactive model for avoiding overstaffing in retail. This metric ensures that your payroll investment aligns with the actual opportunity present on the shop floor.
The LTR Calculation Framework
To calculate your LTR, divide the Total Labor Hours by the Total Visitors for a specific period. For example, if an Australian apparel store utilizes 50 labor hours during a window that sees 500 visitors, the LTR is 0.10, or 10 hours per 100 visitors. Precise data entry is vital here. You must merge your automated roster data with high-fidelity visitor counts to see the true picture of operational efficiency.
Visualizing this data reveals the “service gap” that often remains hidden in traditional reporting. When you overlay an LTR graph against a Sales graph, you can identify periods where labor remains high despite a drop in foot traffic. Implementing Predict-Then-Optimize methods allows retailers to use historical traffic patterns to forecast these gaps before they impact the bottom line. An LTR over 15% in high-volume retail often signals chronic overstaffing.
The “Sweet Spot” is the point where conversion rates are maximized while labor costs remain at their lowest sustainable level. Beyond this point, adding more staff provides diminishing returns, as the floor becomes crowded and staff members often end up performing low-value tasks instead of engaging customers.
Benchmarking by Store Tier
A one-size-fits-all approach to LTR leads to inefficiencies. A flagship store in Sydney’s CBD requires a different LTR target than a regional outlet in Wagga Wagga. Flagship locations often serve as brand showrooms, requiring higher staffing levels to maintain premium service standards and visual merchandising excellence. In contrast, regional stores may prioritize lean operations focused on transaction speed.
Your ratio must also account for non-selling tasks that consume hours without directly interacting with foot traffic. These include:
- Stock replenishment and inventory management.
- Fulfillment of click-and-collect orders, which has grown by 22% in the Australian market since 2023.
- Visual merchandising updates and promotional setups.
Utilizing retail footfall analysis Australia helps head offices set national standards that respect these local nuances. By benchmarking LTR across similar store tiers, you can identify which managers are mastering the balance of service and avoiding overstaffing in retail, allowing you to replicate their success across the entire network.
Implementing a Data-Driven Staffing Strategy
Precision in labor management isn’t achieved through broad cuts, but through surgical adjustments. Successfully avoiding overstaffing in retail requires a 4-phase implementation plan that prioritizes evidence over intuition. Initially, managers must audit existing rosters against 12 months of historical footfall data. This long-term view accounts for Australian retail cycles, such as the June EOFY rush and the November Black Friday surge, revealing exactly where labor hours exceed visitor demand.
The strategy then moves into operational agility. Establishing “On-Call” or “Swing Shift” protocols allows stores to react to peak variability without carrying the cost of a full shift. Retailers using these flexible models often see a 12% reduction in unnecessary labor costs during mid-week lulls. The final phases involve using heatmaps to reallocate staff to high-conversion areas and monitoring conversion rates daily. If a reduction in staff leads to a measurable drop in sales per visitor, the roster must be recalibrated to protect the bottom line.
Predictive Rostering for 2026
The next era of retail management uses AI to remove the guesswork from scheduling. By integrating weather patterns from the Bureau of Meteorology and local event calendars, the FootfallCam V9 Software automates roster suggestions with high accuracy. This technology predicts traffic spikes before they happen, ensuring you have the right headcount for a rainy Saturday or a localized festival. Transparency is key here; sharing these data-backed forecasts with employees helps them understand the logic behind shifting schedules, which reduces friction and improves morale.
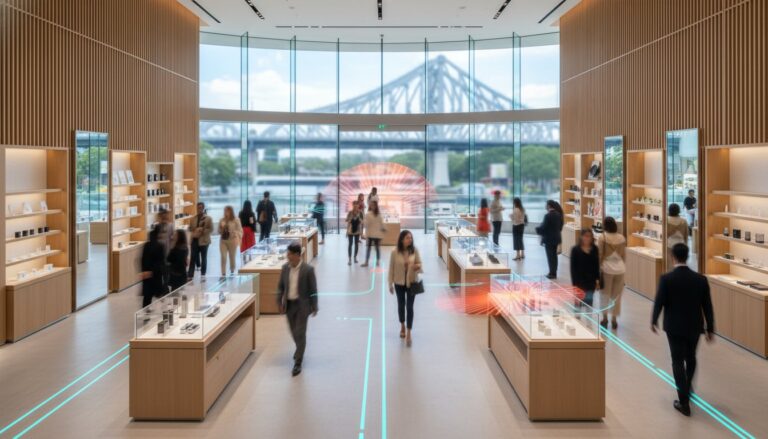
Heatmaps and Zone-Based Optimization
Physical stores often contain “Dead Zones” where staff presence provides zero return on investment. Spatial analytics identify these areas, allowing managers to move personnel to zones where they can actually influence a purchase. Cross-training staff is essential for this fluidity, enabling a team member to move from a quiet homewares section to a busy apparel department in minutes. High-performance people counting systems Australia retailers rely on provide the real-time floor data needed for these quick transitions. This ensures that every A$ spent on wages is directly tied to an active customer journey.
Ready to transform your floor management with real-time data? Explore Footfall analytics solutions today.
The Footfall Australia Advantage: Precision Overstaffing Prevention
Precision in scheduling is the only sustainable way to master avoiding overstaffing in retail. Footfall Australia provides the technical infrastructure to transform raw foot traffic into a strategic operational asset. Our clients across the country typically see a 10% to 15% reduction in labour costs within the first six months of implementation. By aligning staff levels with actual visitor peaks, retailers stop paying for idle time and start investing in customer conversion. This transition from guesswork to data-driven logic is what separates market leaders from those struggling with rising overheads in a competitive 2026 landscape.
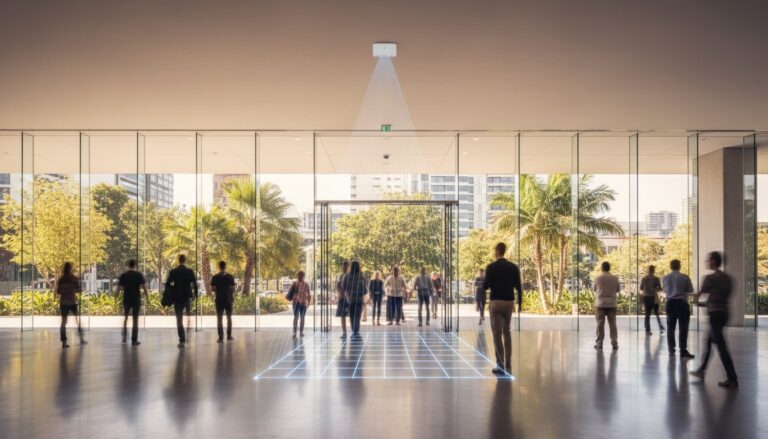
Hardware Built for Retail Rigour
The FootfallCam Pro2 is the preferred choice for national retailers because it handles the complexities of the physical store environment with ease. It uses edge-based AI to count visitors with a verified accuracy of over 98%, even in high-density environments. This hardware respects the Australian Privacy Principles by processing data directly on the device. It counts people without ever capturing or storing Personal Identifiable Information (PII), ensuring your brand remains compliant while gaining deep spatial analytics. For businesses currently relying on older, beam-based counters or basic thermal sensors, our “Legacy Swap Out Plan” provides a clear pathway to upgrade. We replace inaccurate hardware with high-precision sensors that provide the granular data needed for modern workforce management.
Ongoing Success and Support
Data integrity is the foundation of any ROI. We maintain a 99% uptime through our people counter support plans, managed by our local Australian team. This means your data remains clean and actionable, even across large-scale interstate networks. Our monthly reporting packages go beyond simple charts; they identify specific overstaffing trends before they become ingrained habits. This allows regional managers to adjust rosters proactively rather than reacting to a high payroll after the fact. These insights integrate seamlessly with your existing workforce management (WFM) tools, ensuring that your payroll matches your footfall in real-time. It’s about having the right people on the floor exactly when the customer needs them. Don’t let operational blind spots dictate your profitability. Request a data audit for your retail network today and take the first step toward a leaner, more responsive business model.
Future-Proofing Your Retail Operations for 2026
The landscape of Australian retail in 2026 demands a shift from reactive scheduling to proactive, data-led strategy. Success no longer relies on historical sales alone. It’s about understanding the visitor journey and maintaining precise Labor-to-Traffic Ratios. By moving beyond POS metrics and embracing spatial analytics, you eliminate the guesswork that leads to bloated overheads. Mastering the science of avoiding overstaffing in retail ensures every A$ spent on payroll directly supports a high-quality customer experience.
Footfall Australia provides the technological foundation for this transition. We leverage over 20 years of experience in the local market to help businesses turn raw data into actionable intelligence. Our AI-powered FootfallCam Pro2 delivers 98%+ counting accuracy, giving you the clarity needed to align staff levels with real-world demand. With a national partner network ready to handle seamless hardware installation, you can begin optimizing your floor coverage immediately.
Optimise Your Retail Workforce with Footfall Australia
Precision leads to profitability. Let’s build a leaner, smarter retail future together.
Frequently Asked Questions
How do I know if my store is actually overstaffed?
Identify overstaffing by analyzing your staff-to-visitor ratio alongside your conversion rate. If your labour hours increase while conversion stays flat or dips, you’re likely paying for idle time. In 2023, Australian retail benchmarks indicated that labour costs exceeding 15% of gross turnover often signal operational inefficiency. High dwell times without a corresponding rise in transaction volume suggest staff are present but not effectively engaging with customers.
Can people counting data really replace my POS reports for scheduling?
People counting data complements POS reports by revealing the “missed opportunities” that sales data cannot see. While POS tells you who bought something, footfall data shows how many people entered but left empty-handed. Integrating these datasets is essential for avoiding overstaffing in retail because it allows you to roster based on total traffic volume rather than just historical sales peaks. This shift from reactive to proactive scheduling prevents wage wastage.
What is a “good” staff-to-customer ratio for Australian retail?
A standard benchmark for Australian specialty retail is one staff member for every 10 to 15 visitors per hour. This ratio ensures high service levels without bloating the payroll. Luxury boutiques often aim for a 1:3 ratio to maintain premium service, while large-format stores might stretch to 1:25 during peak periods. Monitoring these ratios in real-time allows managers to adjust shifts dynamically based on actual floor density rather than guesswork.
How long does it take to see an ROI from a people counting system?
Most Australian retailers achieve a full return on investment within 6 to 12 months of implementation. By reducing roster bloat by just 4 hours per week at an average award rate of A$29.04 per hour, a store can save over A$6,000 annually. These savings, combined with a typical 2% to 5% increase in conversion rates, quickly offset the initial hardware and software costs. It’s a strategic investment that pays for itself through precision.
Will my staff feel “watched” if I use people counters for rostering?
Staff usually view people counters as a tool for fairness rather than surveillance when the benefits are explained clearly. Using data to prevent burnout during unexpected rushes makes their jobs easier and more predictable. Modern AI sensors focus on anonymous heatmaps and path tracking, ensuring individual privacy remains intact. Transparency about how the data improves their daily workflow helps build a culture of evidence-based performance and reduces workplace stress.
Is it better to be slightly overstaffed or slightly understaffed?
Precision is the goal, but being slightly overstaffed is often less damaging to long-term brand reputation than being understaffed. Understaffing leads to long queues and a 30% increase in “walk-outs” according to 2024 consumer behavior studies. However, avoiding overstaffing in retail through predictive analytics ensures you hit the “sweet spot” where service quality and wage expenses are perfectly balanced. Data removes the need to choose between two sub-optimal options.
How does footfall data account for staff members in the count?
Advanced 3D LiDAR and AI sensors use “staff exclusion” technology to remove employees from the final count. This is achieved through wearable tags or AI algorithms that recognize staff uniforms and movement patterns. By filtering out employees, the data remains 98% accurate. This precision prevents your internal team movements from inflating visitor numbers and skewing your conversion metrics, ensuring your strategic decisions rest on clean data.
Do I need a different system for large-format stores versus boutiques?
The core technology remains similar, but the deployment strategy changes based on floor size and ceiling height. Large-format stores require a network of sensors to track spatial analytics across multiple zones and entrances. Boutiques often only need a single high-precision sensor at the door. Both setups feed into the same cloud-based dashboard, providing a unified view of performance regardless of the physical footprint of the location.