Multi-Store Foot Traffic Benchmarks for Franchise Decisions
A visitor count is only comparable when every store counts the same thing. Multi-store foot traffic benchmarking for franchises compares the number of people visiting each location over a defined period, using consistent counting boundaries. A reliable store baseline comes from daily counts over at least 4-6 weeks, giving franchise teams a clearer reference for interpreting later changes.
It’s natural to compare locations by total visits, but totals can mislead when store layouts, trading conditions or customer patterns differ. This article explains how to make fair comparisons and turn traffic data into practical decisions. Learn how to define a visit, group comparable stores, and interpret peak days, dwell times and traffic sources. Dashboards and heatmaps can also help reveal where performance diverges, so teams can distinguish shifts in customer behaviour from differences in how locations operate.
Key Takeaways
- Set a consistent boundary for what counts as a store visit so location comparisons use the same measure.
- Compare stores with similar operating conditions, and use dashboards to spot meaningful shifts rather than isolated differences.
- Use peak days, dwell times and traffic sources to understand when visits happen and how customer movement varies.
- People-counting systems and analytics software can help franchise teams turn location data into clearer operational decisions.
Visualising store performance with dashboards and heatmaps
Franchisees can compare stores by grouping locations with similar operating conditions, then measuring traffic against each store’s own baseline. Dashboards reveal network patterns, while consistent counting boundaries make comparisons meaningful.
Dashboard and Heatmap Views
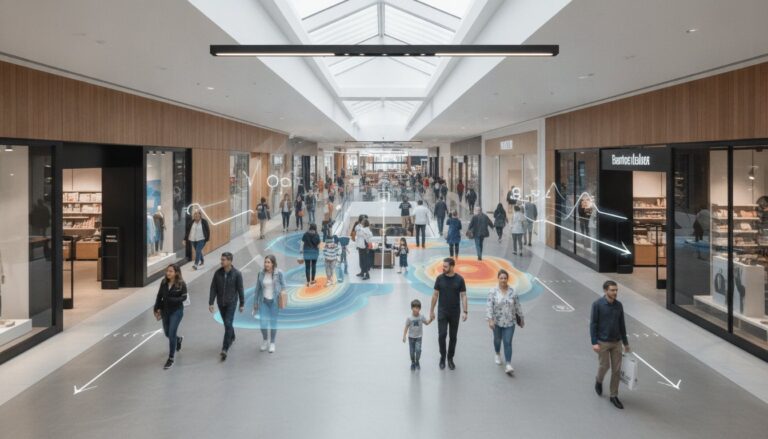
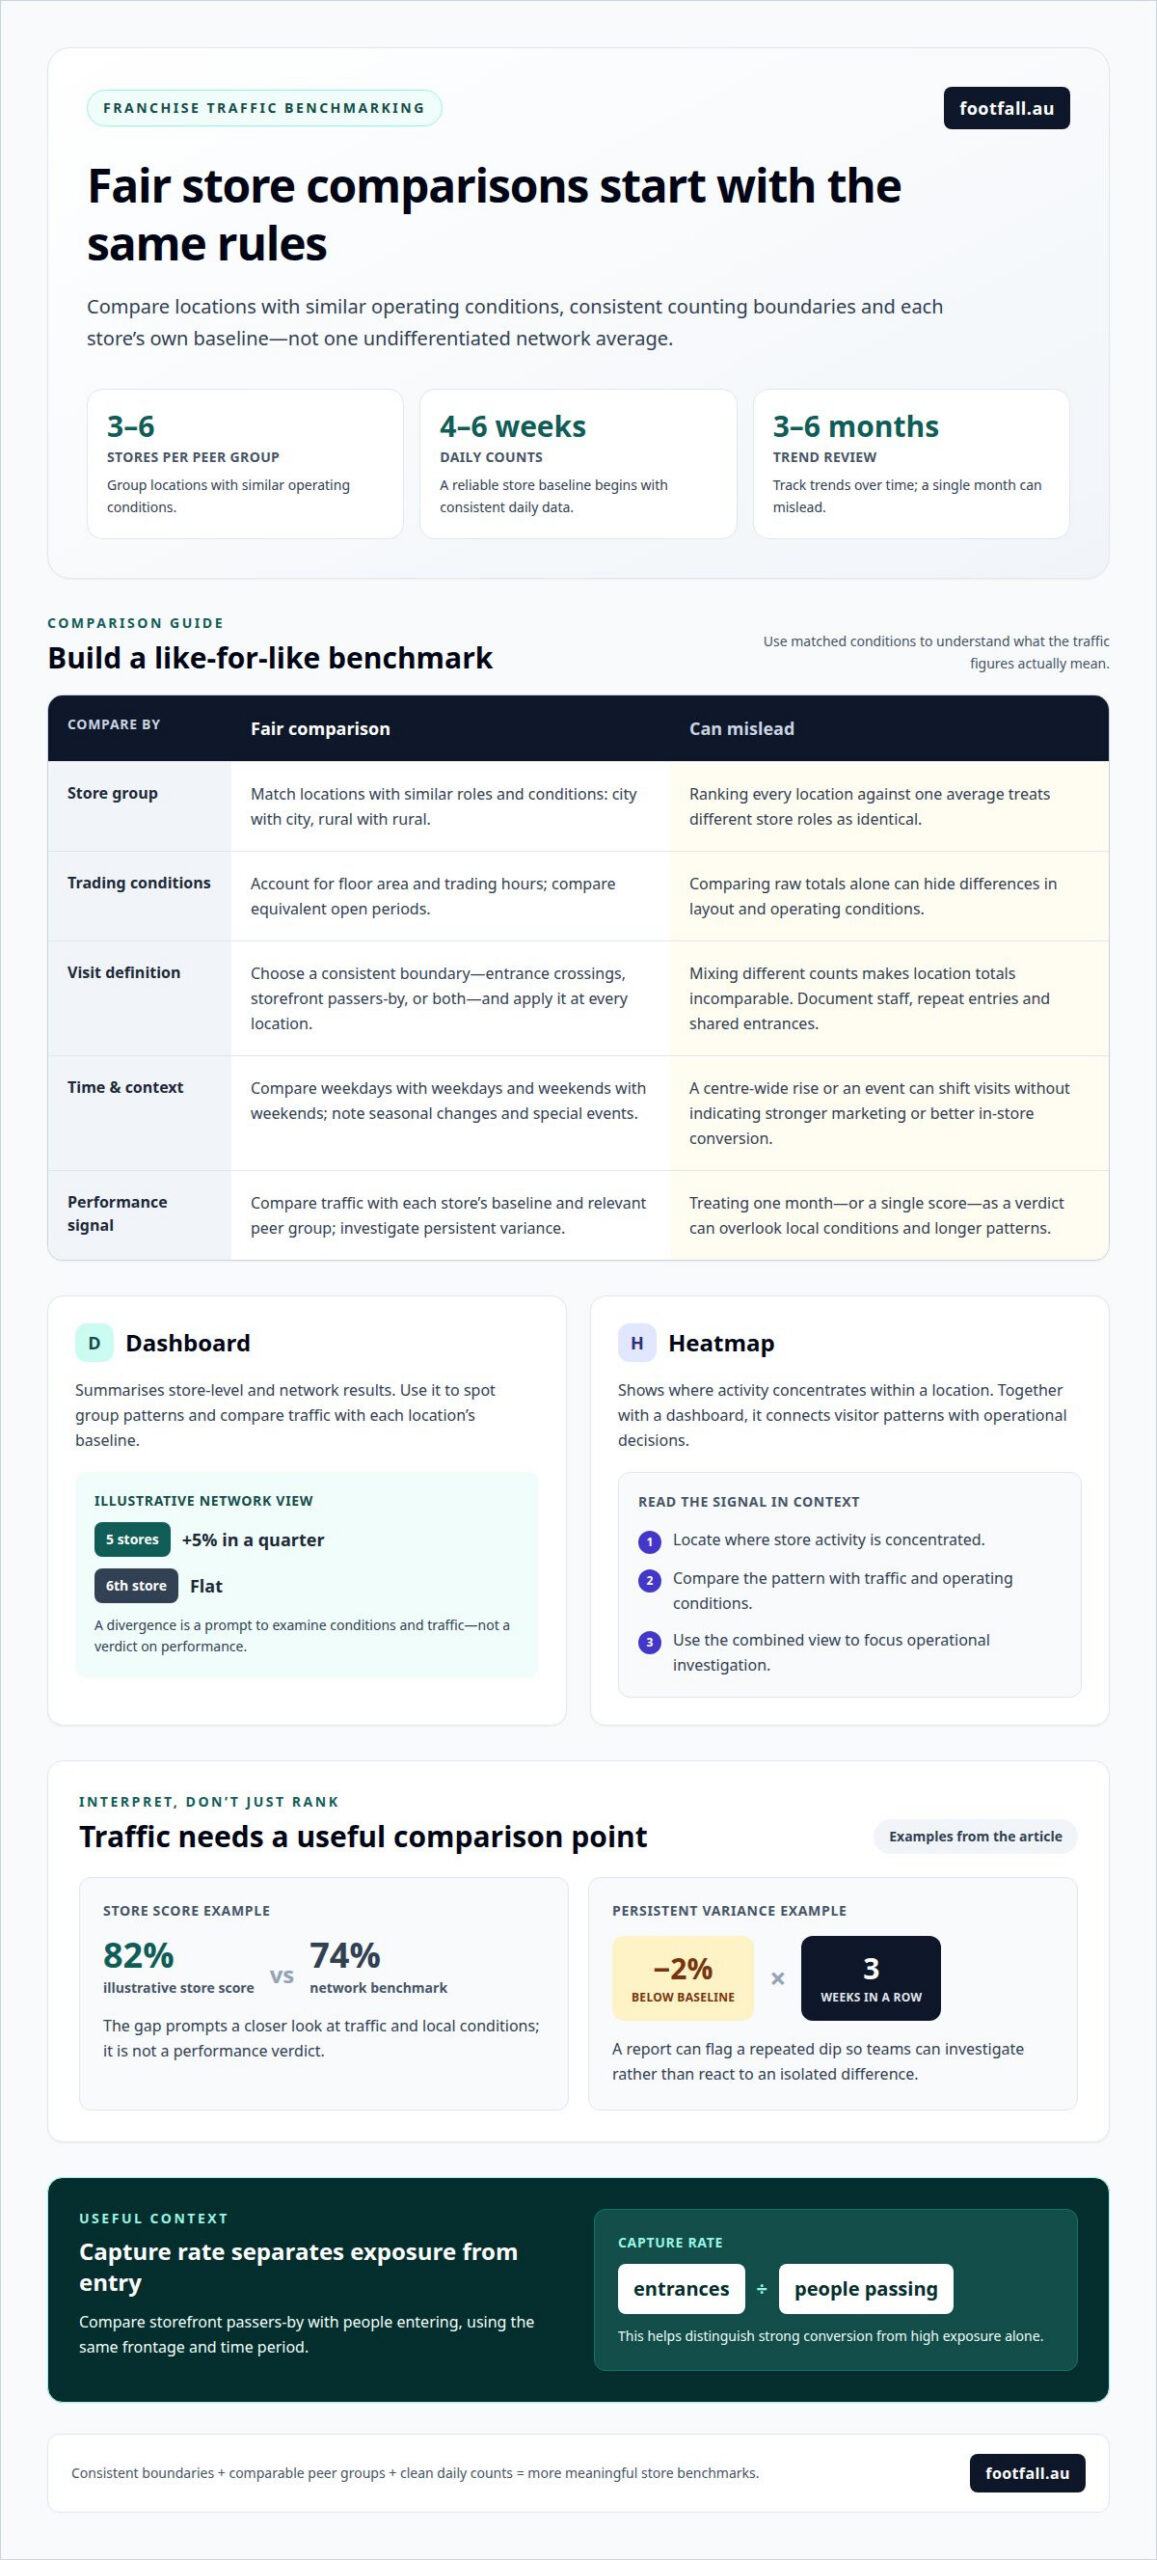
A dashboard summarises store-level and network results, while a heatmap shows where activity concentrates within a location. Together, they help retail teams connect visitor patterns with operational decisions. For example, a dashboard could show five comparable stores growing 5% in a quarter while a sixth remains flat. Capture rate adds context: divide entrances by people passing the storefront, using the same frontage and time period. This helps distinguish strong conversion from high exposure alone.
Comparing Stores Across the Network
Fair comparison means matching stores by relevant conditions, not ranking every location against one undifferentiated average. Compare city locations with city locations, and rural stores with rural stores; account for differences in floor area and trading hours by reviewing rates over equivalent open periods. Retail peer groups generally contain three to six stores with similar operating conditions. Dashboards can show each group’s traffic alongside its own baseline, while a shared chart of accounts makes consolidated revenue reporting and store comparisons easier. This gives franchisees a practical view of relative performance without treating different store roles as identical.
Outliers, Trends, and Performance Variance
Outlier review identifies stores whose results diverge from their peer group or historical pattern, then gives managers a focused operational question to investigate. A network dashboard might show an illustrative Store Score of 82% against a network benchmark of 74%; that gap is a prompt to examine traffic and local conditions, not a verdict on performance. Track trends across 3-6 months, since a single month can mislead. A report can also highlight a store 2% below its baseline for three weeks in a row, helping teams investigate persistent variance and target changes where they may have the greatest effect.
Analysing peak days, dwell times and traffic sources
Peak-day analysis shows when each franchise location attracts its busiest flows, while dwell time indicates how long visits last. Compare weekdays with weekdays and weekends with weekends, using equivalent trading periods across locations. Seasonal changes and special events can shift retail patterns, so annotate them in reports. A daily view connects visitor peaks with staffing decisions and helps teams assess whether coverage matches customer demand.
Traffic-source analysis separates people passing a storefront from visitors entering it, clarifying how exposure relates to capture rate. Review traffic by day and time, then compare locations with similar roles and trading conditions. A reliable baseline uses daily counts for at least 4-6 weeks. These metrics make changes easier to interpret: a rise in visits with shorter dwell times suggests a different pattern from steady traffic with longer visits.
Budget and forecast variance analysis compares actual visits with the traffic assumptions behind store plans. If a location falls short during an expected peak period, managers can examine local events, trading hours or campaign timing before revising the forecast. Pairing visitor counts with revenue and sales data adds context, helping teams assess whether traffic shifts relate to commercial outcomes rather than treating visits as an outcome on their own.
Inventory and usage analysis adds another operational layer. Compare busy periods with stock availability and product movement to see whether popular items are ready when customers arrive. For example, repeated lunchtime peaks may call for different replenishment timing and staffing than a steady afternoon flow. A consistent report format across the network supports efficient comparisons. Foot traffic analytics can help bring these movement patterns into operational view.
Foot traffic definitions and counting boundaries
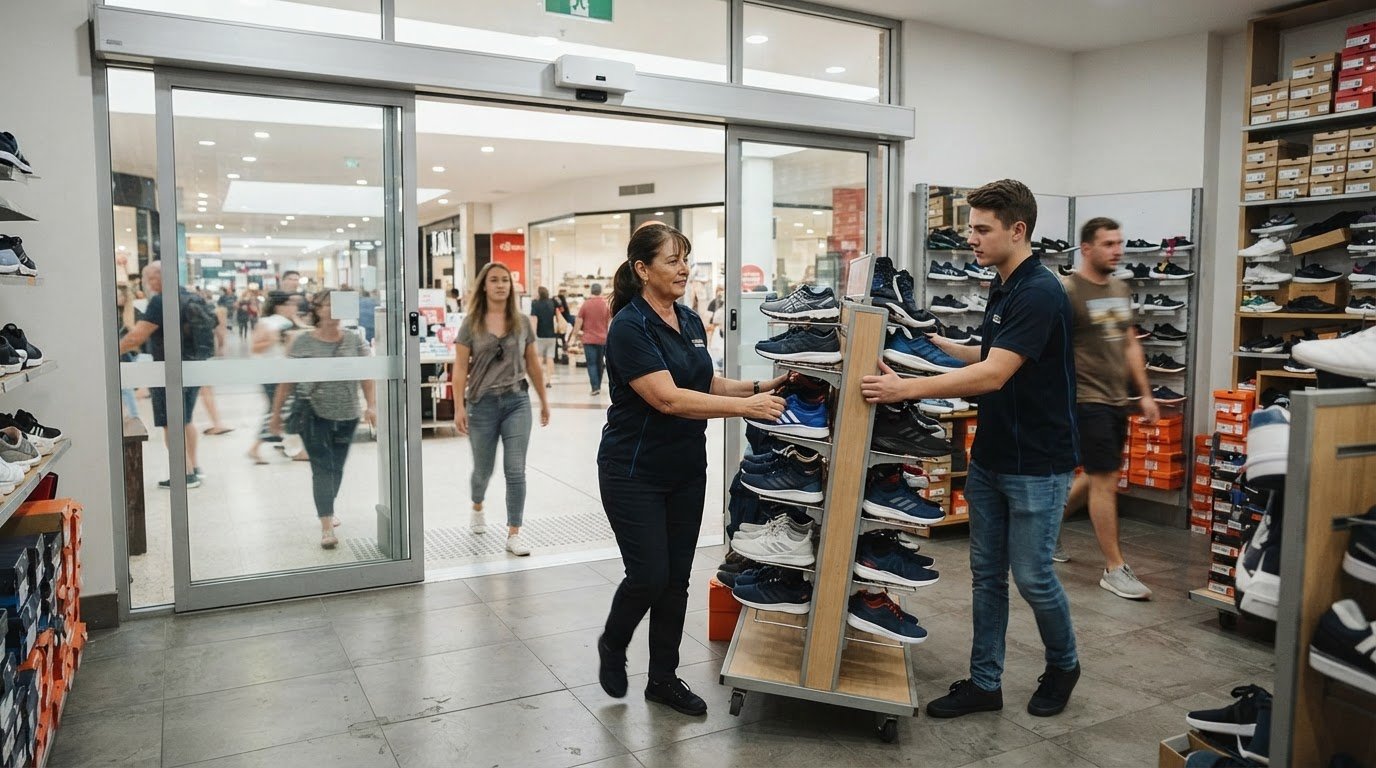
A useful benchmark starts with a precise definition of a visit. Decide whether counting measures people crossing a store entrance, storefront passers-by or both; these figures reflect different behaviours. Apply the same boundary at every location, and document how staff, repeat entries and shared entrances are treated. Multi-store foot traffic benchmarking for franchises depends on consistent rules, not simply comparable totals.
In Australia, privacy and consent considerations depend on what information a system collects and how it is used. Establish whether data could identify individuals, explain collection clearly, and favour aggregated visit counts when individual movement histories aren’t needed. This distinction helps teams choose a measurement approach that fits the insights they need.
There’s no single typical foot traffic benchmark for every Australian industry or store format. Compare like with like: shopping-centre shops, suburban strip stores and rural locations face different exposure, trading patterns and customer flows. Set expectations using each store’s operating conditions and historical patterns, then interpret visits alongside sales and margin. This gives marketing teams more useful context than traffic alone.
Shopping-centre and retail-precinct trends shape the opportunity around a franchise location. Seasonal changes and special events can alter centre visits and shopping habits, so record them alongside store results. A centre-wide rise may lift nearby locations without indicating stronger marketing or improved in-store conversion. Compare each store’s movement with its own baseline and relevant peer group.
Build a reliable framework by defining the count, applying identical boundaries, grouping comparable locations and collecting clean daily data. Use 8-13 weeks of trailing data to establish an expected-performance baseline, smoothing known anomalies. A multi-store foot traffic benchmarking for franchises framework becomes more useful when teams review deviations against local conditions before acting. Explore foot traffic measurement to support consistent counting across locations.
Footfall Australia
Footfall Australia helps franchise teams put consistent foot traffic measurement into practice across multiple locations. Its FootfallCam Pro2 People Counters support people counting, while FootfallCam Pro1 IP Cameras, FootfallCam Centroid and FootfallCam V9 Software are available for relevant measurement and analytics setups.
When your network needs a consistent way to collect store traffic data and benchmark performance, begin by defining counting boundaries and reporting periods. Footfall Australia’s fully managed People Counting and AI Analytic Solutions are designed to use existing CCTV infrastructure. The reporting framework can then help make location results easier to interpret and act on, with insights tailored to the questions your network needs answered.
Contact Footfall Australia to discuss foot traffic measurement for your franchise locations.
Turn measurement into the next operational decision
Reliable benchmarking is most useful when it informs what a team does next. Use reporting patterns to identify where a location needs a closer look, then connect the finding to a practical operational question: staffing, storefront visibility or local marketing timing. That is how multi-store foot traffic benchmarking for franchises becomes a repeatable management tool rather than a report that gets filed away. Consistent measurement can help teams focus attention on the locations and decisions that matter most.
Footfall Australia offers FootfallCam Pro2 People Counters, FootfallCam Pro1 IP Cameras and FootfallCam Centroid to support foot traffic measurement across franchise locations. The right approach depends on store layouts and the movement your team needs to understand.
Contact Footfall Australia to discuss the next step for your network. Clearer measurement gives your team a stronger basis for decisions.
Frequently Asked Questions
What is foot traffic benchmarking?
Foot traffic benchmarking compares store visits against a reference, such as the same location’s past performance or a group of comparable franchise stores. It helps separate a local change from a wider network pattern. For example, if visits decline at one store but remain steady among similar locations, managers can investigate local trading conditions before changing network-wide plans.
How is foot traffic measured and benchmarked across multiple franchise locations?
People counters, video analytics and other traffic measurement methods record visits using defined entry boundaries. For benchmarking, standardise what counts as an entry and align reporting periods across locations. Then compare each store with its own history and a relevant peer group. A suburban store’s weekend pattern, for instance, is more useful against similar stores than against a city-centre location.
What foot traffic data sources and analytics tools are available in Australia for franchises?
Australian franchises can use people-counting systems, video analytics and Wi-Fi analytics to examine visitor movement. Footfall Australia’s fully managed service is designed to use existing CCTV infrastructure, with data masked at the source and no personally identifiable information collected or stored. Its analytics can connect visitor behaviour with factors such as staffing, sales, location, weather and marketing for operational insights.
How can franchises calculate conversion rates, dwell time, and repeat visits from foot traffic data?
Calculate conversion rate by dividing transactions by store visits for the same period, then multiplying by 100. Calculate average dwell time by dividing the total measured visit duration by the number of visits. Repeat-visit rate compares returning visitors with unique visitors, where the measurement method can distinguish repeat visits. Keep time periods and counting boundaries consistent for useful comparisons.
What are typical foot traffic benchmarks by industry and store format in Australia?
There is no single typical foot traffic benchmark for every Australian industry or store format. Compare similar locations, such as shopping-centre shops with one another, and interpret visits against each store’s operating conditions, historical patterns, sales and margin.