How to Use Footfall Data to Increase Sales: A Strategic Guide for 2026
High foot traffic is a vanity metric that often masks significant operational leaks. You’ve likely felt the frustration of a crowded store floor that fails to translate into a busy checkout line. It’s a common challenge; while physical stores still account for nearly 80% of global retail sales in 2026, many retailers struggle to bridge the gap between presence and purchase. This guide provides a strategic roadmap on how to use footfall data to increase sales by transforming raw numbers into actionable intelligence.
You know your marketing is working, but you don’t always know why it isn’t converting. We’ll show you how to move beyond simple counting to create a high-converting sales engine. By the end of this article, you’ll understand how to optimize labor costs based on real-time demand and gain data-backed proof of your marketing ROI. We will explore how advanced tools like the FootfallCam Pro2 and V9 software allow you to diagnose exactly where your sales funnel is leaking so you can stop guessing and start growing. This is about treating physical presence not just as a statistic, but as a sequence of human actions you can finally interpret and influence.
Key Takeaways
- Identify the “Conversion Gap” by analyzing the discrepancy between total store entries and completed transactions to pinpoint where potential revenue is lost.
- Optimize store layouts and staff rotas using real-time heatmaps and traffic flow patterns to maximize engagement in high-value zones.
- Measure the precise ROI of marketing initiatives by tracking “Traffic Lift” and benchmarking performance across various store locations.
- Master how to use footfall data to increase sales by transitioning from intuitive management to an evidence-based operational strategy.
- Implement high-precision technology like the FootfallCam Pro2 to filter out staff and non-prospects, ensuring your analytics remain 99.5% accurate.
The Conversion Gap: Why Footfall is More Than a Headcount
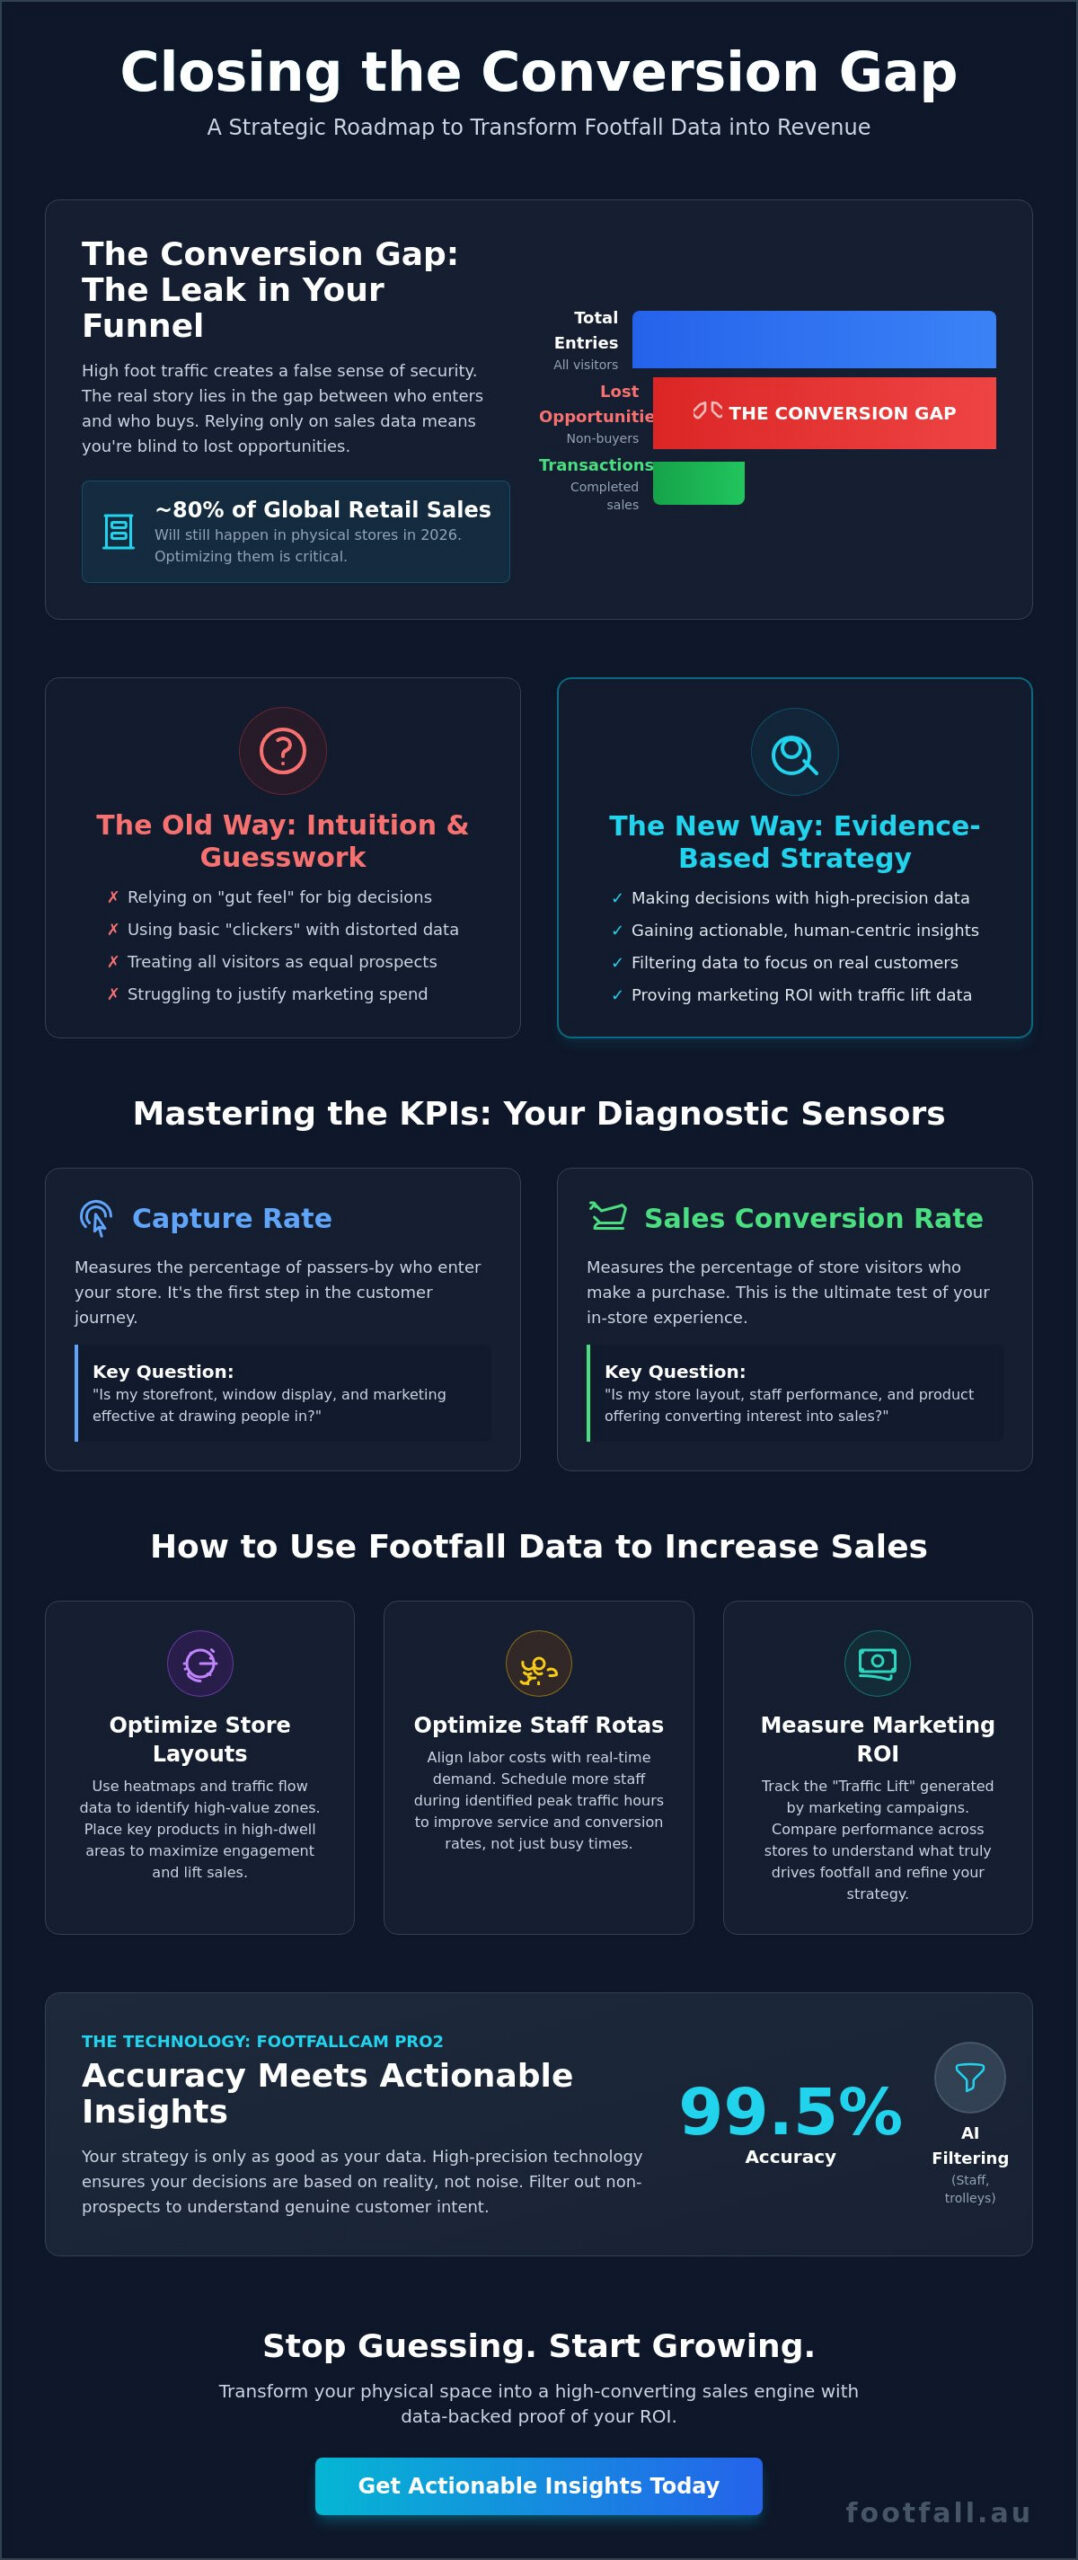
High visitor numbers often create a false sense of security for retail managers. While a crowded shop floor suggests brand relevance, it doesn’t always correlate with a healthy bottom line. This discrepancy between the number of people who enter a space and those who complete a transaction is known as the Conversion Gap. If you rely solely on Point-of-Sale (POS) data, you’re only seeing half of the story. POS systems record what was purchased, but they remain silent about the hundreds of lost opportunities that walked back out the door. To understand how to use footfall data to increase sales, you must first recognize that footfall is the essential denominator in every success equation. Without knowing how many people entered, your sales figures are just isolated numbers without context.
Empirical evidence is the only reliable way to replace the “gut feel” that often dictates retail decisions. In an environment where physical stores still account for nearly 80% of global retail sales, guessing why a weekend was quiet or a promotion failed is no longer a viable strategy. Sophisticated data allows you to see exactly where the sales funnel is leaking. It transforms a physical space into a measurable environment where every entry is a data point waiting to be optimized. This transition from intuition to evidence-based management is what separates market leaders from those struggling to maintain floor traffic conversion.
Moving Beyond Simple Traffic Counts
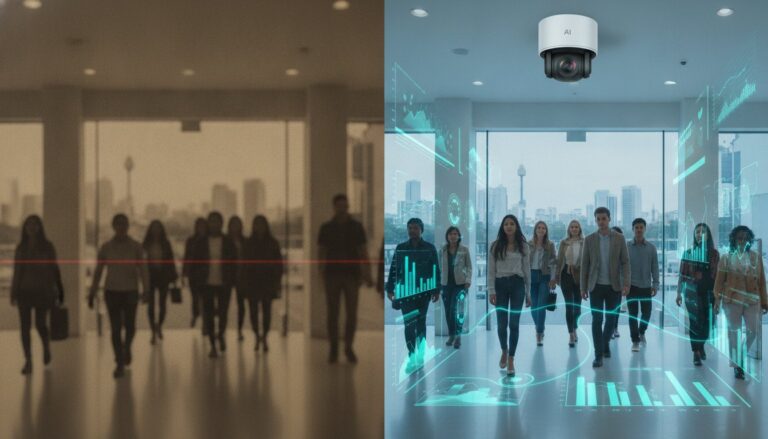
Traditional “clicker” systems or basic infrared beams offer a distorted view of reality. They count movements, not people, often failing to distinguish between a family of four and four individual prospects. Modern footfall data analysis goes much deeper by identifying unique visitor patterns and peak flow times. This level of detail uncovers hidden sales opportunities, such as identifying a high-traffic window on a Tuesday morning that is currently understaffed. By moving beyond a simple headcount, you gain the clarity needed to align your resources with actual consumer behavior.
The Human Narrative of Retail Movement
Every person who enters your store follows a narrative of movement and intent. Their path through the aisles isn’t random; it’s a sequence of actions that can be interpreted through a high-precision people counter. Dwell time in specific zones serves as a primary indicator of purchase probability. If customers spend significant time in a promotional area but don’t buy, the issue might be pricing or display clarity rather than lack of interest. Ensuring clean data is vital here. Systems like the FootfallCam Pro2 use AI to filter out staff movements and shopping trolleys, ensuring that your strategic decisions are based on genuine customer intent. Understanding how to use footfall data to increase sales starts with these accurate, human-centric metrics.
Mastering the KPIs: Capture Rate vs. Sales Conversion Rate
To understand how to use footfall data to increase sales, you must treat store traffic as a two-stage behavioral journey rather than a single event. Many managers make the mistake of looking at sales totals in isolation, but true growth comes from dissecting the path from the pavement to the point of sale. This requires mastering two fundamental Key Performance Indicators: Capture Rate and Sales Conversion Rate. These metrics act as diagnostic sensors, pinpointing exactly where your sales process is failing or flourishing. When this traffic intelligence is fused with demographic data and trade area analysis, it reveals whether you’re attracting the right audience or simply a high volume of disinterested passers-by.
Data clarifies the problem. If your capture rate is high but sales are low, the issue lies inside your doors. Conversely, a low capture rate suggests your storefront is failing to engage the street. Establishing a clear framework for benchmarks in the Australian market allows you to set realistic targets. In high-density urban areas like Sydney or Melbourne, a capture rate might naturally be lower due to sheer volume, yet the potential for high conversion remains. Implementing a precision counting system allows you to monitor these shifts in real-time, providing the empirical foundation needed for strategic adjustments.
Calculating and Improving Your Capture Rate
The formula is straightforward: (Store Entrants / Outside Passing Traffic) x 100. This metric is the definitive judge of your window displays and storefront appeal. If you update a seasonal display and see your capture rate climb from 4% to 6%, you have data-backed proof of ROI. High outside traffic is an opportunity; your capture rate tells you how much of that opportunity you’ve seized. Improving this figure often involves testing different visual merchandising strategies or street-level signage and measuring the immediate impact on entry volume.
Optimising the Sales Conversion Rate
Once a visitor is inside, the focus shifts to the Sales Conversion Rate: (Total Transactions / Store Entrants) x 100. This is where you identify “lost sales.” If 100 people enter but only 10 buy, you must investigate why 90 people left empty-handed. Often, conversion dips aren’t caused by product quality but by operational friction. Long queues at the checkout or poor stock levels in high-traffic zones can drive customers away. By linking these dips to specific hours or zones, you can implement targeted changes to your service model. Learning how to use footfall data to increase sales means identifying these friction points and removing them before they impact your quarterly revenue.
Operational Optimisation: Staffing and Layout for Maximum Revenue
Operational efficiency is the direct result of aligning your most expensive resources—staff and floor space—with actual customer demand. Once you have identified your conversion gap, the next step in understanding how to use footfall data to increase sales involves refining the in-store experience. Decisions regarding where to place a new product line or how many associates to schedule for a Saturday afternoon shouldn’t rest on intuition. Instead, high-precision heatmaps and flow analysis provide a visual representation of human intent. To measure the true efficacy of your store’s environment, you must evaluate how physical movement correlates with your transaction data.
Data-Driven Staff Scheduling
Labor is often a retailer’s largest controllable expense. Overstaffing during quiet periods erodes margins, while understaffing during peak hours leads to abandoned baskets and frustrated visitors. By utilizing FootfallCam V9 software, managers can identify “power hours”—those specific windows where traffic volume is highest and the potential for revenue is greatest. Aligning your most experienced sales staff with these periods ensures that high-intent customers receive the service required to close a sale.
- Optimise Service Levels: Determine the ideal staff-to-customer ratio that maintains high conversion without inflating labor costs.
- Eliminate Dead Time: Reassign non-sales tasks, like restocking, to periods identified by historical data as low-traffic zones.
- Protect Margins: Use predictive analytics to adjust rotas before unexpected traffic spikes occur, based on seasonal trends.
Strategic Store Layout and Merchandising
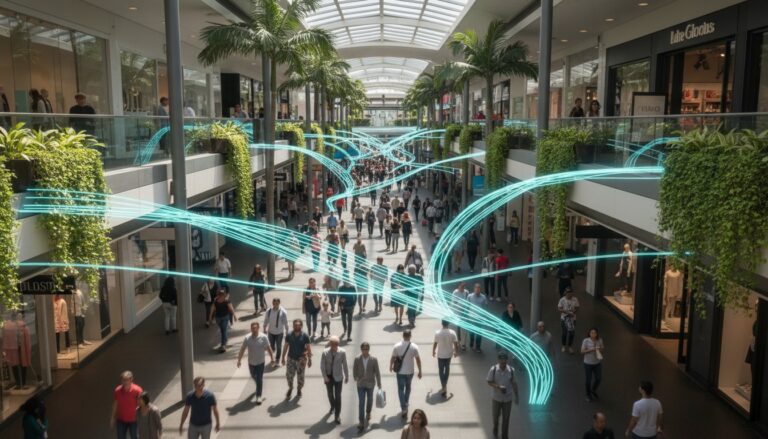
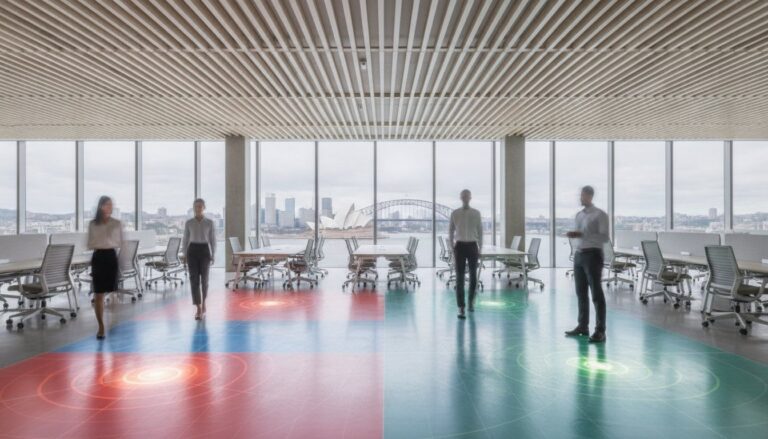
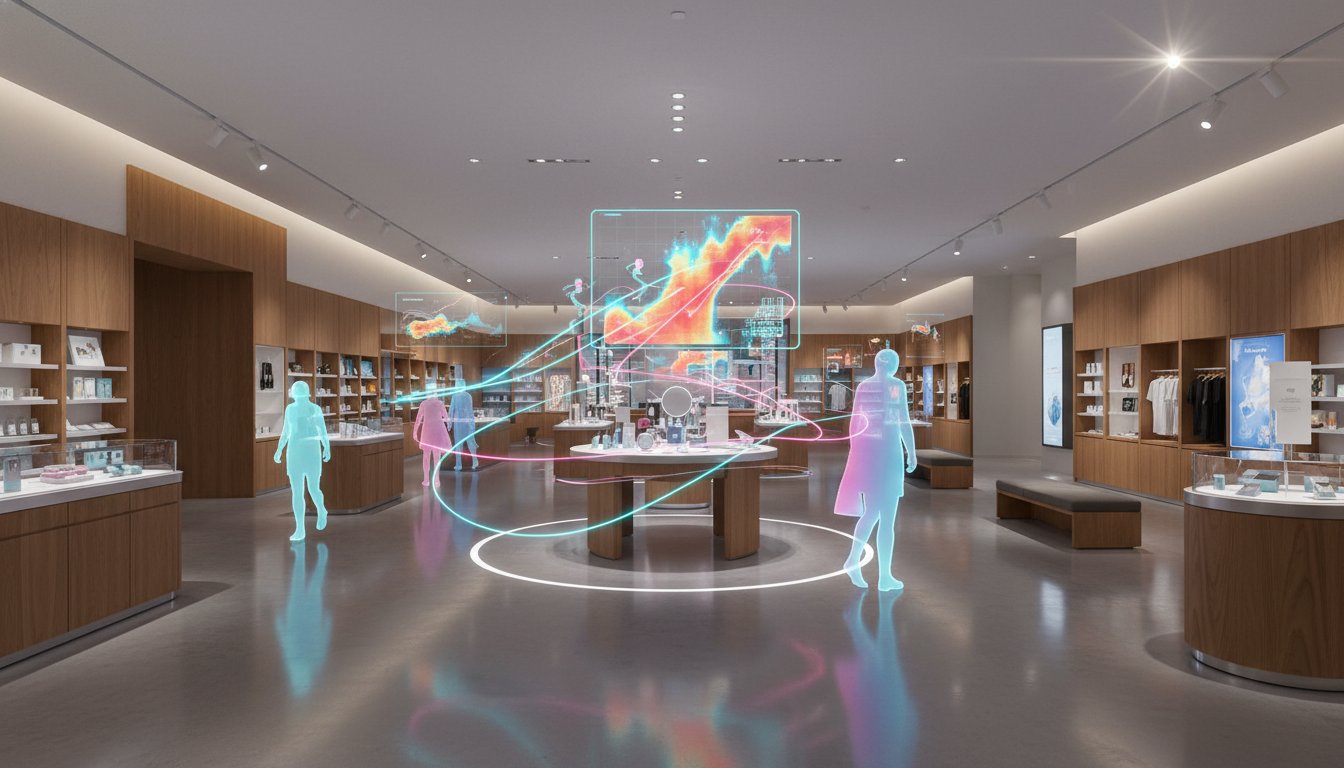
A store’s layout acts as a silent salesperson. Heatmapping technology from sensors like the FootfallCam Pro2 reveals “dead zones” where customer flow stalls and “hot zones” where engagement is naturally high. If your high-margin items are tucked away in a low-traffic corner, your layout is actively working against your sales targets. A fundamental strategy for how to use footfall data to increase sales is to treat your floor plan as a dynamic asset that requires constant optimization.
Data-backed merchandising allows you to A/B test end-cap displays or aisle configurations with scientific rigour. If a layout change increases dwell time in a specific department but doesn’t lift sales, it indicates a problem with the product mix or pricing rather than the pathing. By integrating movement data with transaction records, you create a transparent view of which zones contribute most to your bottom line. This empirical approach ensures that every square meter of your retail space is engineered for maximum revenue generation.
Measuring Marketing Efficacy and ROI
Marketing expenditure often feels like a black box for physical retailers. While digital campaigns provide clear click-through rates, the transition from an online ad to a physical entry is frequently lost in translation. Understanding how to use footfall data to increase sales requires a shift in how we quantify marketing success. By establishing historical baselines, you can filter out seasonal trends and organic growth to isolate the exact ‘Traffic Lift’ generated by a specific campaign. This empirical approach allows you to calculate the true cost per visitor, providing a level of transparency previously reserved for e-commerce.
Effective measurement depends on isolating variables. If your traffic increases during a summer sale, you must determine how much of that surge was due to your advertising spend versus the natural seasonal peak. By comparing current data against a multi-year historical average, you can accurately measure the efficacy of your creative assets. This data-driven logic ensures that your budget is allocated to the channels that actually drive bodies through the door, rather than those that simply generate digital noise.
Evaluating In-Store Promotions
Marketing Lift is the percentage increase in traffic recorded during a campaign compared to a baseline period of similar length and conditions. Success isn’t just about getting people into the building; it’s about what they do once they’re inside. AI-driven sensors allow you to track dwell time at specific promotional stands to see if your visual merchandising is capturing attention. This data helps you determine if a promotion actually increased your total traffic or if it just shifted existing demand within the store layout. If a display has high dwell time but low conversion, it’s a clear signal that the offer or the price point needs immediate adjustment.
Cross-Store Benchmarking for National Growth
Scaling a retail operation requires a standardized way to measure success across diverse locations. Retail footfall analysis in Australia is essential for identifying ‘Champion Stores’ within a national network. These are the locations that consistently outperform others in conversion rates, even if their total traffic is lower. By normalizing data to account for different street-traffic volumes, you can isolate the operational best practices that make these stores successful. Replicating the staffing models or layout strategies of these high-performers across your entire fleet is the fastest way to drive national growth. Stop guessing which store managers have the “magic touch” and start identifying the empirical reasons for their success. Optimise your marketing spend by integrating advanced footfall analytics into your ROI calculations today.
The FootfallCam Pro2 Solution: Accuracy Meets Actionable Insights
Strategic decisions are only as robust as the data that informs them. When managing multi-million dollar retail portfolios, a margin of error isn’t just a statistical anomaly; it’s a financial risk. The FootfallCam Pro2 provides the 99.5% accuracy required to move from speculative management to empirical certainty. By utilizing advanced AI, the system automatically filters out non-prospects such as children, staff, and shopping trolleys. This ensures your conversion metrics reflect genuine customer intent rather than operational noise. Understanding how to use footfall data to increase sales requires this level of precision to ensure every layout change or staffing adjustment is based on a clean, reliable dataset.
The quiet confidence that comes from data-driven logic allows managers to lead with authority. Instead of relying on intuition, you can point to clear, scientific evidence that explains why a specific store is underperforming. This high-precision approach treats physical presence as a sequence of human actions that can be interpreted and optimized. By removing the guesswork from the equation, you create a transparent environment where success is measured by accuracy and efficiency. This is the foundation of a modern, forward-thinking retail strategy in 2026.
Seamless POS and Data Integration
True insight emerges when traffic counts meet transaction records. The FootfallCam V9 software allows you to sync transaction data with traffic timestamps for granular, real-time analysis. This integration transforms raw numbers into a clear view of your sales funnel, highlighting exactly when and where conversions are dropping. A cloud-based dashboard provides national oversight, allowing headquarters to monitor performance across all Australian locations from a single interface. It provides a steady, logical flow of information that empowers regional managers to act quickly. Automating these reports reduces manual data entry and human error, freeing your team to focus on high-level strategic sales initiatives rather than administrative maintenance.
Ensuring Long-Term Data Integrity
Even the most advanced technology requires ongoing attention to remain effective. Prioritising people counter support is vital to prevent ‘data drift,’ where hardware misalignment or environmental changes begin to skew your results. Regular health checks and software updates protect your ROI by ensuring the narrative of movement within your store remains accurate over years of operation. We treat physical presence as a sequence of human actions that must be interpreted correctly to drive growth. Data is only valuable if it leads to a specific, positive change in operations. Ready to optimise your sales? Contact Footfall Australia for a tailored data strategy.
Engineering the Future of Retail Growth
Mastering your retail environment requires more than just monitoring traffic. It demands a sophisticated understanding of human movement and its direct impact on your bottom line. By identifying the conversion gap and aligning staffing with real-time demand, you move away from intuitive guesswork toward a model of empirical certainty. This guide has outlined the essential framework for how to use footfall data to increase sales by treating every entry as a measurable opportunity for growth.
Achieving these results requires technology that matches your strategic ambition. Since 2004, we’ve served Australian businesses with proprietary AI hardware that delivers 99.5% accuracy. Supported by a national network of local installation and support partners, we ensure your data remains a reliable foundation for every multi-million dollar decision. Maximise your retail revenue with a FootfallCam Pro2 system today and transform your physical space into a high-performance sales engine. The future of retail belongs to those who lead with data.
Frequently Asked Questions
How can footfall data specifically help increase my retail sales conversion?
Footfall data serves as the diagnostic denominator for your entire sales funnel. It identifies specific periods where your store has high traffic but low transactions, highlighting precisely where potential revenue is being lost. By understanding these patterns, you can implement targeted changes to your service model or store layout to capture more sales from the visitors already in your store. It transforms a crowded floor from a vanity metric into a series of actionable opportunities.
Is it possible to integrate footfall data with my current POS system?
Integration with existing POS systems is a standard capability of the FootfallCam V9 software. While we don’t sell POS hardware ourselves, our software is engineered to ingest your transaction data to provide a real-time view of your conversion rates. This creates a seamless comparison between store entries and completed sales. It allows managers to see the immediate impact of operational changes on the bottom line without manual data entry.
What is a good sales conversion rate for an Australian retail store?
Conversion rates in Australia vary significantly based on the retail sector and store format. While global e-commerce conversion rates are approaching 3% in 2026, physical retail typically experiences much higher figures because of the high intent of in-store visitors. Luxury boutiques may have lower traffic but higher conversion, while convenience stores rely on high volume. Benchmarking against your own historical data is the most reliable way to measure internal growth.
How does people counting technology distinguish between staff and customers?
Advanced AI hardware like the FootfallCam Pro2 uses sophisticated filtering to identify and exclude staff movements from your customer counts. The system can be configured with specific exclusion zones and AI-driven behavior analysis to ensure that employees working near the entrance don’t inflate your visitor statistics. This ensures your data remains clean and reflects genuine customer intent. Clean data is the foundation of any successful retail strategy.
Can footfall data help me reduce my operational costs while increasing sales?
Operational costs are reduced by aligning your labor spend with actual customer demand patterns. Footfall data allows you to create efficient rotas that prevent overstaffing during quiet periods while ensuring enough staff are present during “power hours.” This optimization protects your margins and improves the customer experience simultaneously. It’s a dual-purpose strategy that ensures you aren’t wasting resources during lulls or losing sales during peaks.
How accurate does a people counter need to be for reliable sales analysis?
Accuracy levels of 99.5% are essential for making reliable strategic decisions in a competitive market. Systems with lower accuracy often suffer from data drift, which can lead to incorrect conclusions about your store’s health. High-precision counters ensure that your analysis of how to use footfall data to increase sales is based on empirical fact rather than skewed statistics. This precision is non-negotiable when making multi-million dollar sales and staffing decisions.
How do I measure the ROI of a people counting system?
ROI is measured by tracking the revenue growth that results from specific, data-driven operational changes. By monitoring the “Traffic Lift” and conversion improvements after implementing new staffing or layout strategies, you can quantify the financial impact of the technology. Most retailers find that the reduction in labor waste and the identification of lost sales opportunities provide a significant return. It’s about turning insights into measurable profit increases.
Can footfall analytics help me decide on my store’s opening and closing hours?
Opening and closing hours are optimized by analyzing traffic patterns immediately before and after your current operating times. If the sensors detect a high volume of potential customers passing the storefront while the doors are closed, it indicates a clear opportunity for extended hours. This data ensures your store is open exactly when your target audience is most active. It prevents you from paying for staff during dead hours or missing revenue during late-night peaks.