Understanding Customer Dwell Time: A Strategic Guide to Behavioural Analytics in 2026
What if your highest footfall figures are actually masking a significant operational leak? While 79% of retail sales still occur in physical stores as of 2026, many managers remain in the dark about what happens between the entrance and the checkout. Understanding customer dwell time is the critical link that transforms raw data into a clear narrative of human behavior. It moves your strategy away from guesswork and toward a precise, empirical model of how people truly interact with your environment.
You’ve likely felt the frustration of high traffic that doesn’t translate into sales or the struggle to justify staffing costs during perceived peaks. It’s a common hurdle when you’re forced to rely on intuition rather than evidence. This guide will show you how measuring and optimizing the time spent in your store can transform your operational efficiency and drive measurable revenue growth. We’ll examine a clear framework for behavioral analytics and actionable strategies to boost engagement using advanced tools like the FootfallCam Pro2 and V9 Software.
Key Takeaways
- Move beyond simple footfall counts by understanding customer dwell time as a primary metric for measuring true engagement within specific zones.
- Identify why legacy tracking methods are losing precision and how 3D Time-of-Flight sensors provide the empirical evidence required for strategic decision-making.
- Discover how to align staffing levels with peak engagement hours rather than just entry volumes to improve operational efficiency.
- Use heat mapping and A/B testing to eliminate retail dead zones and optimize store layouts for higher conversion rates.
- Learn how FootfallCam V9 software visualizes complex movement patterns to empower your team with intuitive and actionable reporting.
Defining Dwell Time: Why Minutes Matter in Physical Spaces
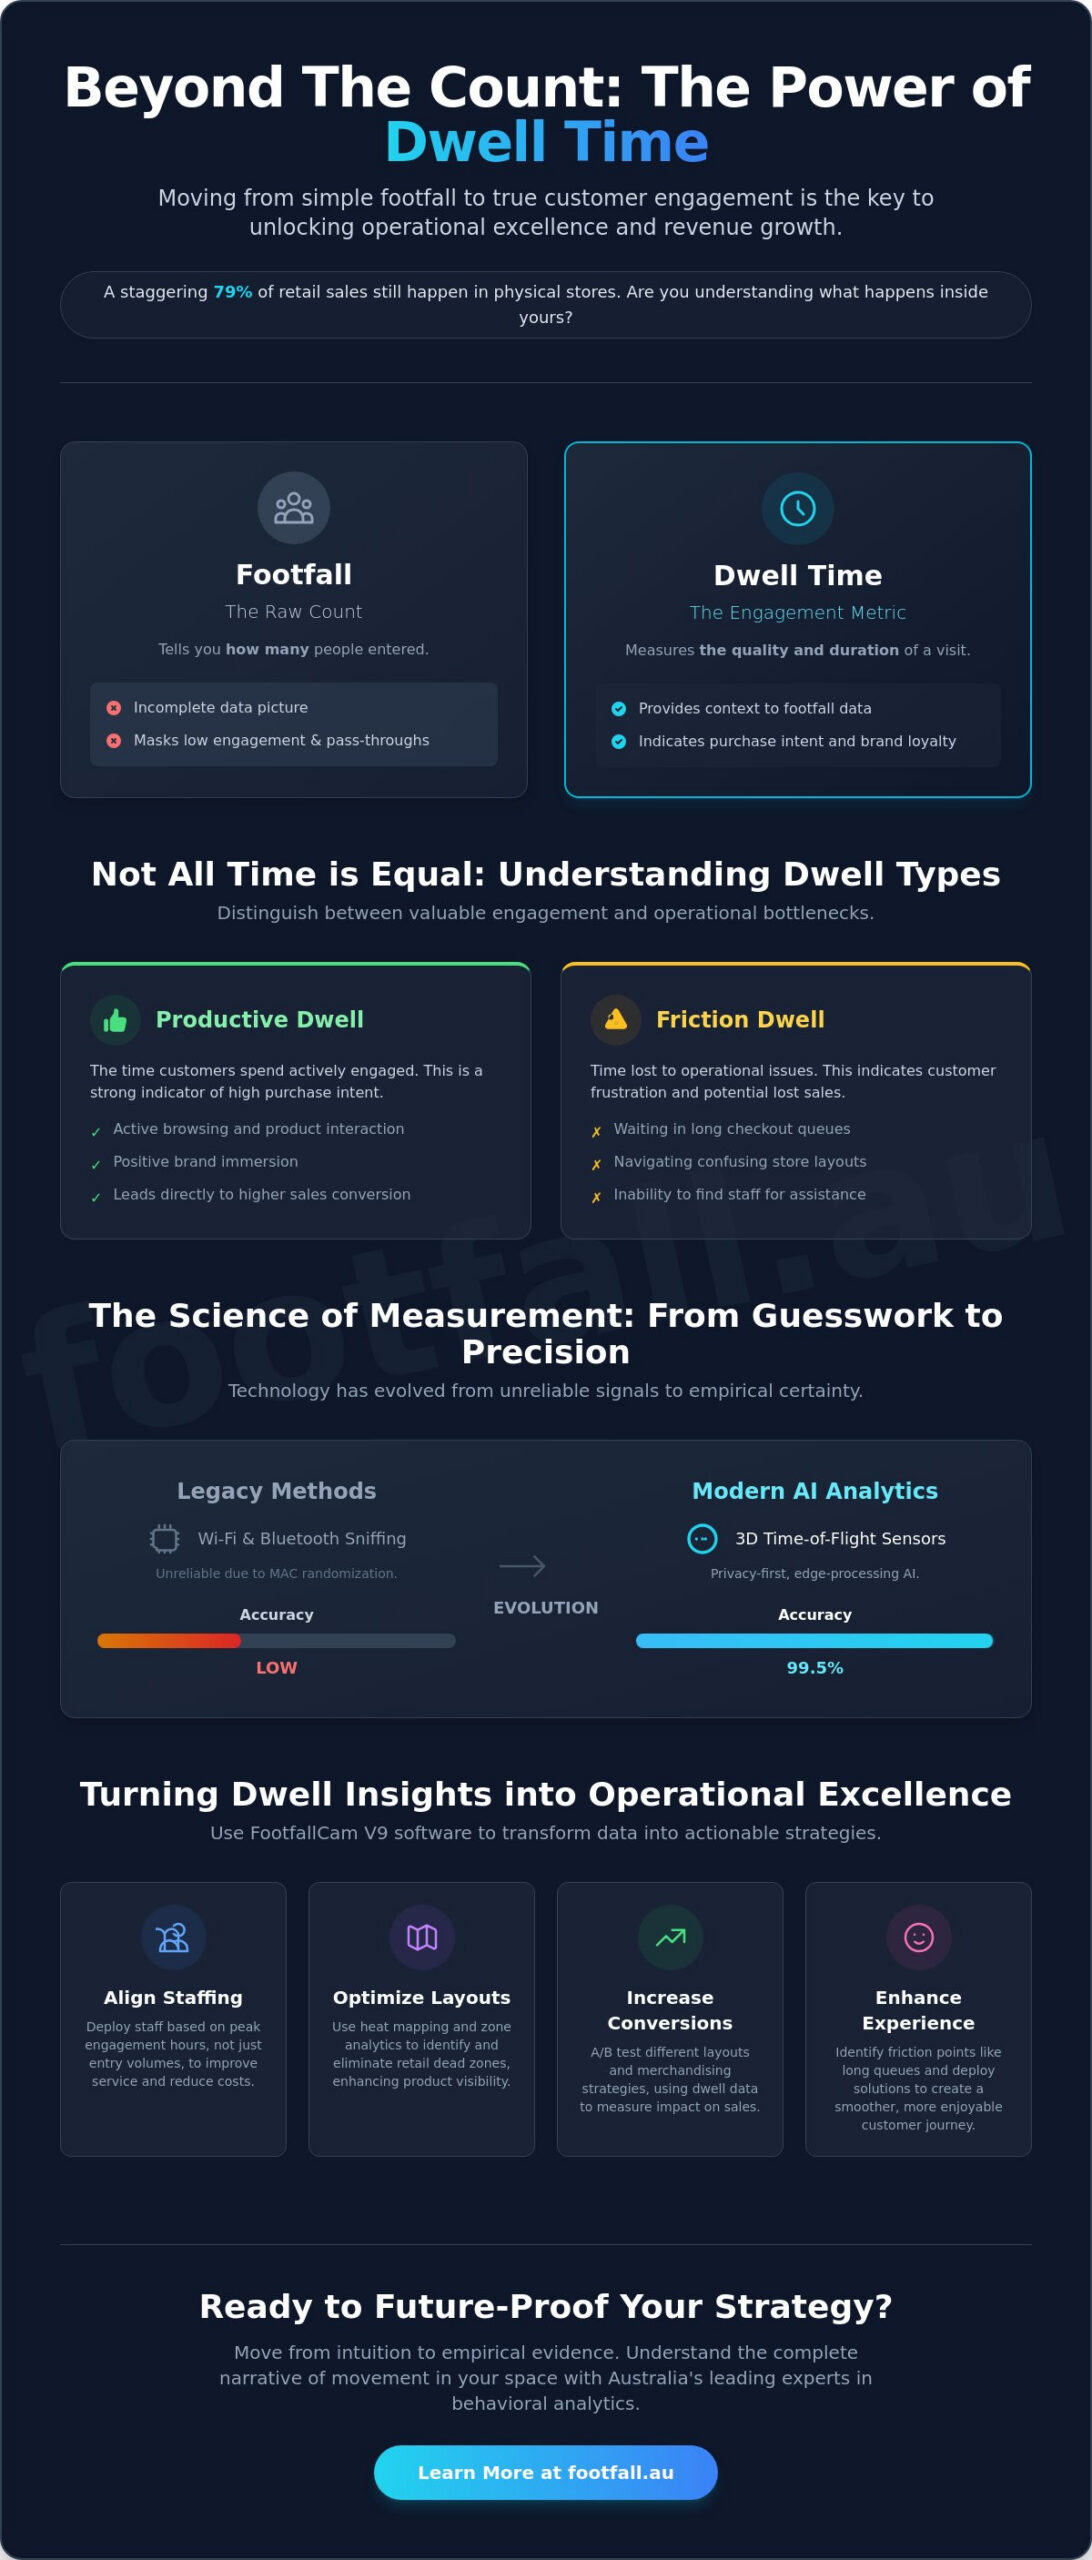
Dwell time represents the total duration a visitor spends within a specific environment or defined zone. While traditional metrics focus on the moment a customer crosses the threshold, understanding customer dwell time allows you to interpret the quality of that visit. It marks a strategic shift from merely counting heads to measuring actual engagement levels. In a landscape where 79% of retail sales still occur in physical locations, the ability to distinguish between a casual passerby and a committed browser is essential for driving operational growth.
This metric serves as a leading indicator for both sales conversion and brand loyalty. High dwell time in a product zone typically correlates with higher purchase intent, yet not all time spent is equal. Strategic experts distinguish between productive dwell and friction dwell. Productive dwell involves active browsing, product interaction, and brand immersion. Conversely, friction dwell represents time lost to operational inefficiencies, such as navigating a confusing layout or waiting in an overextended queue. Identifying these nuances ensures that your data leads to specific, positive changes in store management.
Dwell Time vs. Footfall: Completing the Data Picture
Raw visitor numbers often paint an incomplete picture of asset performance. High footfall paired with low dwell time frequently suggests a pass-through problem, where your environment fails to capture or hold interest. By integrating people counting data with dwell metrics, you establish a baseline that reveals the true utility of your space. Dwell time provides the context that raw visitor numbers lack, turning a simple tally into a narrative of movement that helps you understand why certain areas underperform despite high traffic.
The Psychology of Presence: Interest vs. Intent
The physical environment acts as a silent influencer of human behavior. Factors such as lighting, acoustic levels, and spatial layout directly impact the clock, either encouraging exploration or triggering an early exit. Through video content analysis, retailers can identify the specific threshold where a visitor transitions from passive observation to active consideration. This data allows for empirical testing of how environmental changes affect customer psychology and subsequent purchase intent.
In Australian retail environments, the engagement threshold is the specific duration of stationary presence in a high-value zone that statistically indicates a customer has moved from browsing to active product evaluation. By identifying these moments, operations teams can deploy staff more effectively to assist customers at the peak of their interest. This evidence-based approach replaces intuition with accuracy, ensuring that every operational adjustment is backed by the narrative of movement captured by your sensors.
The Science of Measurement: From Wi-Fi Sniffing to AI Precision
Evaluating the evolution of measurement technology reveals a clear transition from proximity-based tracking to visual intelligence. Legacy methods like Wi-Fi and Bluetooth sniffing once served as industry standards, yet they’ve become increasingly unreliable in 2026. The primary culprit is MAC randomization, a privacy feature now standard across mobile operating systems that causes a single device to appear as multiple unique visitors. Relying on these outdated signals leads to inflated footfall counts and skewed duration data, making understanding customer dwell time nearly impossible with legacy hardware.
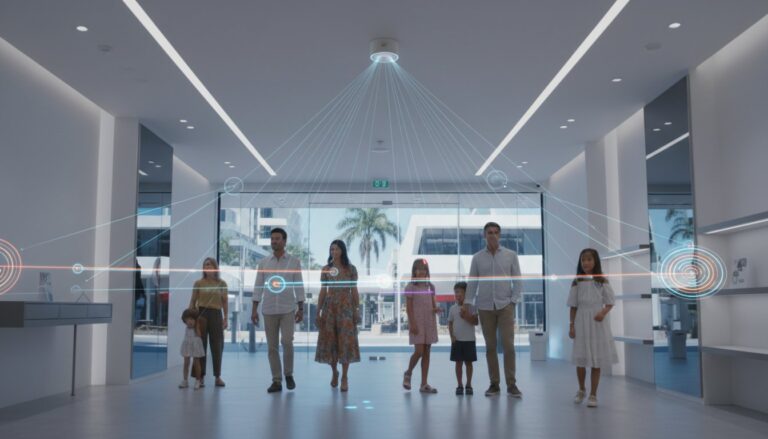
Modern 3D Time-of-Flight (ToF) sensors and AI-driven behavioral analytics have replaced these approximations with empirical certainty. These systems don’t rely on device signals; instead, they use depth-sensing technology to create a precise narrative of movement. By establishing a data baseline with 99.5% accuracy, retailers can finally trust their analytics to drive high-stakes operational changes. This precision ensures that every minute recorded reflects a genuine human presence rather than a digital ghost or a background signal. If you’re looking to upgrade your current infrastructure, the Footfall Australia team provides expert guidance on transitioning to these high-accuracy systems.
Privacy remains a cornerstone of this technological shift. Advanced AI sensors process data at the edge, meaning they analyze behavior locally without ever capturing or storing personally identifiable information (PII). This “privacy-by-design” approach ensures full compliance with Australian data protection standards. You gain deep insights into how long a customer lingers at a display without ever needing to know who that customer is, striking a perfect balance between depth of insight and consumer anonymity.
Why AI People Counters Lead the Market in 2026
AI-powered sensors distinguish between human beings and inanimate objects with clinical precision. Unlike basic infrared beams, the FootfallCam Pro2 identifies the skeletal structure of a visitor, allowing it to ignore shopping trolleys, strollers, and even children if they fall below a specific height threshold. This filtering is vital for maintaining data integrity. It ensures that your dwell time metrics aren’t diluted by the presence of equipment or non-buying units, providing a clean dataset that reflects actual consumer intent.
Employee Exclusion: Cleaning Your Data for Accuracy
Staff movement is the most common source of data contamination in dwell time reporting. Employees naturally spend hours in the store, which can artificially inflate average dwell times and mask true customer behavior patterns. Advanced sensors solve this by using AI path filtering or wearable ‘staff tags’ to automatically exclude employees from the final count. This cleaning process ensures your metrics reflect the authentic journey of a customer, allowing you to make operational decisions based on shopper engagement rather than staff routine.
Decoding the Relationship Between Dwell Time and Conversion Rates
A common misconception in retail analytics is the belief that more time spent on-site always translates to higher sales. While there is a correlation, the relationship is actually a bell curve rather than a linear progression. Finding the ‘Sweet Spot’, the optimal duration that maximizes purchase probability, is the core objective of understanding customer dwell time. For a high-end boutique, this might be 45 minutes; for a convenience store, it could be less than four. Identifying this industry-specific benchmark allows you to differentiate between a customer who is deeply engaged and one who is simply lost.
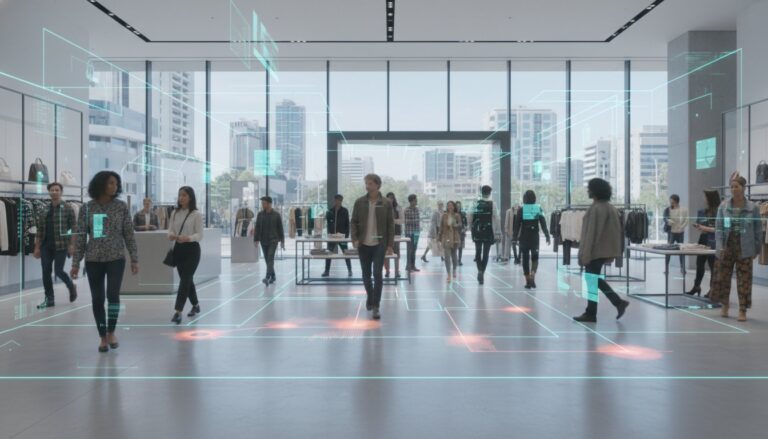
Heat mapping serves as a vital tool for identifying ‘dead zones’ where engagement drops to zero despite high traffic volume. These areas represent missed opportunities where customers pass through without pausing. By correlating dwell data with transaction records, you can calculate the ROI of time spent in specific aisles. This process uncovers the ‘Window Shopper’ effect, where measuring external dwell time at storefront displays helps you understand your capture rate. If people linger outside but don’t enter, your visual merchandising is attracting attention but failing to convert that interest into a visit.
Mapping the Customer Journey Through Zone Analytics
To gain a granular view of behavior, you must divide your space into functional areas. ‘Interest Zones’, such as promotional displays, should ideally see high dwell times, while ‘Service Zones’, like checkout counters, benefit from efficiency. Utilizing retail footfall analysis Australia allows you to track zone-to-zone migration patterns. This data reveals bottlenecks where high dwell time isn’t a sign of interest but a symptom of frustration. If a customer spends ten minutes in a service zone without a transaction, you’ve likely identified a negative dwell event that harms brand loyalty.
The Conversion Gap: When Long Stays Don’t Equal Sales
A significant conversion gap often exists when dwell time is high but sales remain flat. This usually indicates ‘friction dwell’ caused by a slow checkout experience or a confusing store layout. By refining your approach to understanding customer dwell time, you can accurately identify the conversion gap that exists when high duration doesn’t lead to a transaction. It’s vital to use your analytics to distinguish between ‘engagement’ and ‘confusion’. Shoppers who loop back through the same aisle multiple times are often searching for an item they can’t find, not browsing with intent. You can differentiate between high-engagement browsing and service-delay dwell by comparing the time spent interacting with products against the time spent stationary in non-merchandise areas.
Strategic Applications: Turning Dwell Insights into Operational Excellence
A sophisticated approach to understanding customer dwell time allows managers to transition from reactive troubleshooting to proactive optimization. Data without application is merely noise; the true value of this metric lies in its ability to dictate precise operational changes. Beyond the sales floor, these insights extend to marketing effectiveness and facility management. For instance, measuring how long a window display holds the attention of passersby provides an immediate feedback loop for visual merchandising teams. Similarly, facility managers can optimize cleaning and maintenance schedules by identifying zones with the highest usage density and dwell duration, ensuring resources are directed where they’re most needed.
The true value of understanding customer dwell time lies in its ability to reveal which physical assets are earning their floor space and which are merely taking it up. By analyzing the “holding power” of in-store activations or promotional end-caps, you can justify marketing spend with empirical evidence. This objective data replaces the traditional reliance on “gut feel” when deciding which layouts to keep and which to discard. When you treat the physical environment as a series of measurable interactions, every square meter becomes an opportunity for efficiency.
Optimising Staffing Based on Engagement Density
Traditional labour models often rely on entry counts to determine staffing levels, yet traffic peaks don’t always align with engagement peaks. These “Power Hours” for sales are actually defined by high dwell density in product zones rather than just a high volume of people entering the building. By deploying staff to high-dwell areas, you ensure that team members are available to assist customers at the exact point of decision. This targeted approach reduces labour waste during high-traffic but low-engagement periods, allowing you to maintain high service standards without inflating overheads.
Layout Refinement: The ‘Stickiness’ of Your Space
Layout testing through A/B methodology provides a clear path to validating new store designs. By comparing dwell time across different floor configurations, you can measure the “stickiness” of your space—the environment’s ability to keep customers moving and browsing comfortably. It’s essential to monitor the “bustle” factor; if a zone becomes too crowded, dwell time may drop as customers seek to exit the perceived chaos. Advanced reporting from the FootfallCam V9 Software helps you evaluate the impact of signage and spatial flow, ensuring that customers spend their time interacting with merchandise rather than searching for exits or assistance.
To begin implementing these data-driven strategies in your facility, contact the experts at Footfall Australia for a comprehensive hardware and software audit.
Future-Proofing Your Strategy with Footfall Australia’s Analytics
Building a future-proof strategy requires more than just high-accuracy sensors; it demands a software ecosystem that translates movement into management logic. Understanding customer dwell time becomes a sustainable advantage only when the data is accessible, integrated, and consistently accurate. By centralising your behavioral metrics within the FootfallCam V9 software, you move beyond isolated statistics to a holistic view of store performance. This platform allows you to merge dwell metrics into your broader footfall data analysis, ensuring that time-based insights inform every part of your operational workflow.
Financial sustainability is equally important when selecting an analytics partner. Many industry providers rely on high-cost, recurring data subscriptions that can drain operational budgets over time. Choosing a one-time hardware investment model combined with perpetual software licensing offers a significant advantage. This approach prioritises long-term utility and reduces the total cost of ownership, allowing you to allocate resources toward implementing the changes your data suggests rather than simply paying to access it.
Seamless Software Integration and Reporting
The V9 dashboard simplifies complex behavioural data for management teams by converting raw duration numbers into intuitive visual trends. It removes the technical barriers to entry, allowing department heads to identify engagement patterns at a glance. You can configure automated reports for weekly dwell time performance reviews, delivering specific insights directly to stakeholders. This automation ensures that your team remains focused on strategic growth rather than manual data entry, maintaining a steady rhythm of evidence-based decision-making across the organisation.
National Support for Data Integrity
Data is only valuable if it remains accurate across your entire estate. Maintaining this integrity requires regular health checks and precise calibration of your counting infrastructure. Footfall Australia’s national network ensures consistency across multi-site national rollouts, providing the technical support necessary to keep your sensors performing at peak levels. Whether you manage a single flagship location or a diverse retail portfolio, this local expertise ensures that your narrative of movement is always based on a foundation of empirical truth.
Ready to see the narrative behind your numbers? Contact Footfall Australia for a tailored analytics consultation to discover how precise behavioural data can transform your physical environment.
Transforming Movement into Measurable Growth
Transitioning from basic footfall counting to a sophisticated behavioral model is no longer optional for competitive retail environments. You’ve seen how precise 3D Time-of-Flight technology eliminates the inaccuracies of legacy tracking, providing a clean dataset for high-stakes decision-making. By identifying the specific engagement thresholds of your industry and aligning your staffing with actual engagement density, you convert physical presence into a predictable driver of revenue. Mastering the art of understanding customer dwell time ensures that every square meter of your facility is optimized for the human actions it hosts.
Footfall Australia has been serving Australian businesses since 2004, providing the empirical evidence needed to replace intuition with accuracy. Our FootfallCam Pro2 AI technology delivers 99.5% accuracy, supported by comprehensive national maintenance plans to ensure your data remains a reliable asset. It’s time to move beyond the entrance tally and start interpreting the full narrative of your space. Unlock deeper insights into your customer behaviour with Footfall Australia and build a future-proof strategy rooted in data-driven logic.
Frequently Asked Questions
What is a good average dwell time for a retail store?
A “good” average dwell time is relative to your specific business model and conversion goals. In a high-consideration environment like a luxury showroom, a longer duration indicates deeper engagement; however, in a fast-casual dining setting, high dwell time might signal service bottlenecks. Focus on finding your own baseline and optimizing for the “sweet spot” where duration correlates most strongly with completed transactions.
How do people counters measure dwell time without tracking personal data?
Modern sensors like the FootfallCam Pro2 use 3D Time-of-Flight technology and skeletal tracking to analyze movement without capturing faces or identifiable traits. Data is processed at the edge, meaning the device only transmits anonymous coordinates and timestamps to the V9 software. This approach ensures understanding customer dwell time remains fully compliant with Australian privacy standards while providing deep behavioral insights.
Can dwell time data help me reduce my staffing costs?
Dwell time data allows you to optimize staffing by aligning labor with periods of high engagement density rather than just entry volume. You can reduce labor waste by identifying times when footfall is high but dwell time is low, suggesting a “pass-through” audience that requires less assistance. This evidence-based approach ensures your team is present exactly when and where customers are making purchase decisions.
What is the difference between dwell time and bounce rate in a physical store?
Bounce rate in a physical store refers to visitors who enter and exit within a very short threshold, often under 60 seconds, without engaging with merchandise. Dwell time measures the total duration of the visit for those who stay beyond that threshold. High bounce rates usually indicate a mismatch between your storefront marketing and the actual in-store experience, while dwell time reflects the quality of the internal journey.
Do I need a specific type of sensor to track dwell time accurately?
Accurate dwell time tracking requires 3D sensors or AI-driven video analytics to distinguish between stationary individuals and those passing through a zone. Legacy 2D cameras or infrared beams lack the depth perception needed to calculate duration within a specific area. Systems like the FootfallCam Pro2 provide the 99.5% accuracy necessary to establish a reliable narrative of movement across different store sections.
How often should I review my dwell time analytics?
Reviewing your analytics on a weekly basis allows for agile operational adjustments, such as tweaking staff rosters or promotional placements. For broader strategic changes, such as major layout overhauls, a monthly deep dive into understanding customer dwell time trends is more effective. Consistent monitoring helps you identify seasonal shifts in behavior before they impact your bottom line.
Can dwell time be tracked in outdoor public spaces or only indoors?
Dwell time can be tracked in both indoor and outdoor environments using specialized hardware. Outdoor spaces require weather-resistant sensors or the FootfallCam Centroid, which applies AI analytics to existing IP camera feeds. This technology is particularly useful for managing public plazas or outdoor shopping precincts where understanding how people utilize seating areas or event spaces is critical for facility management.
How is dwell time recorded if a customer leaves and comes back?
Most systems record a customer leaving and returning as two distinct visits to maintain data integrity and stay within privacy limits. Advanced AI filtering helps ensure that quick exits and re-entries, such as a customer grabbing a trolley from outside, don’t artificially skew your average dwell time. This ensures your reporting reflects authentic shopping sessions rather than fragmented movements, providing a cleaner dataset for your analysis.