How to Integrate Footfall and Sales Data: The Ultimate Guide to Retail Precision
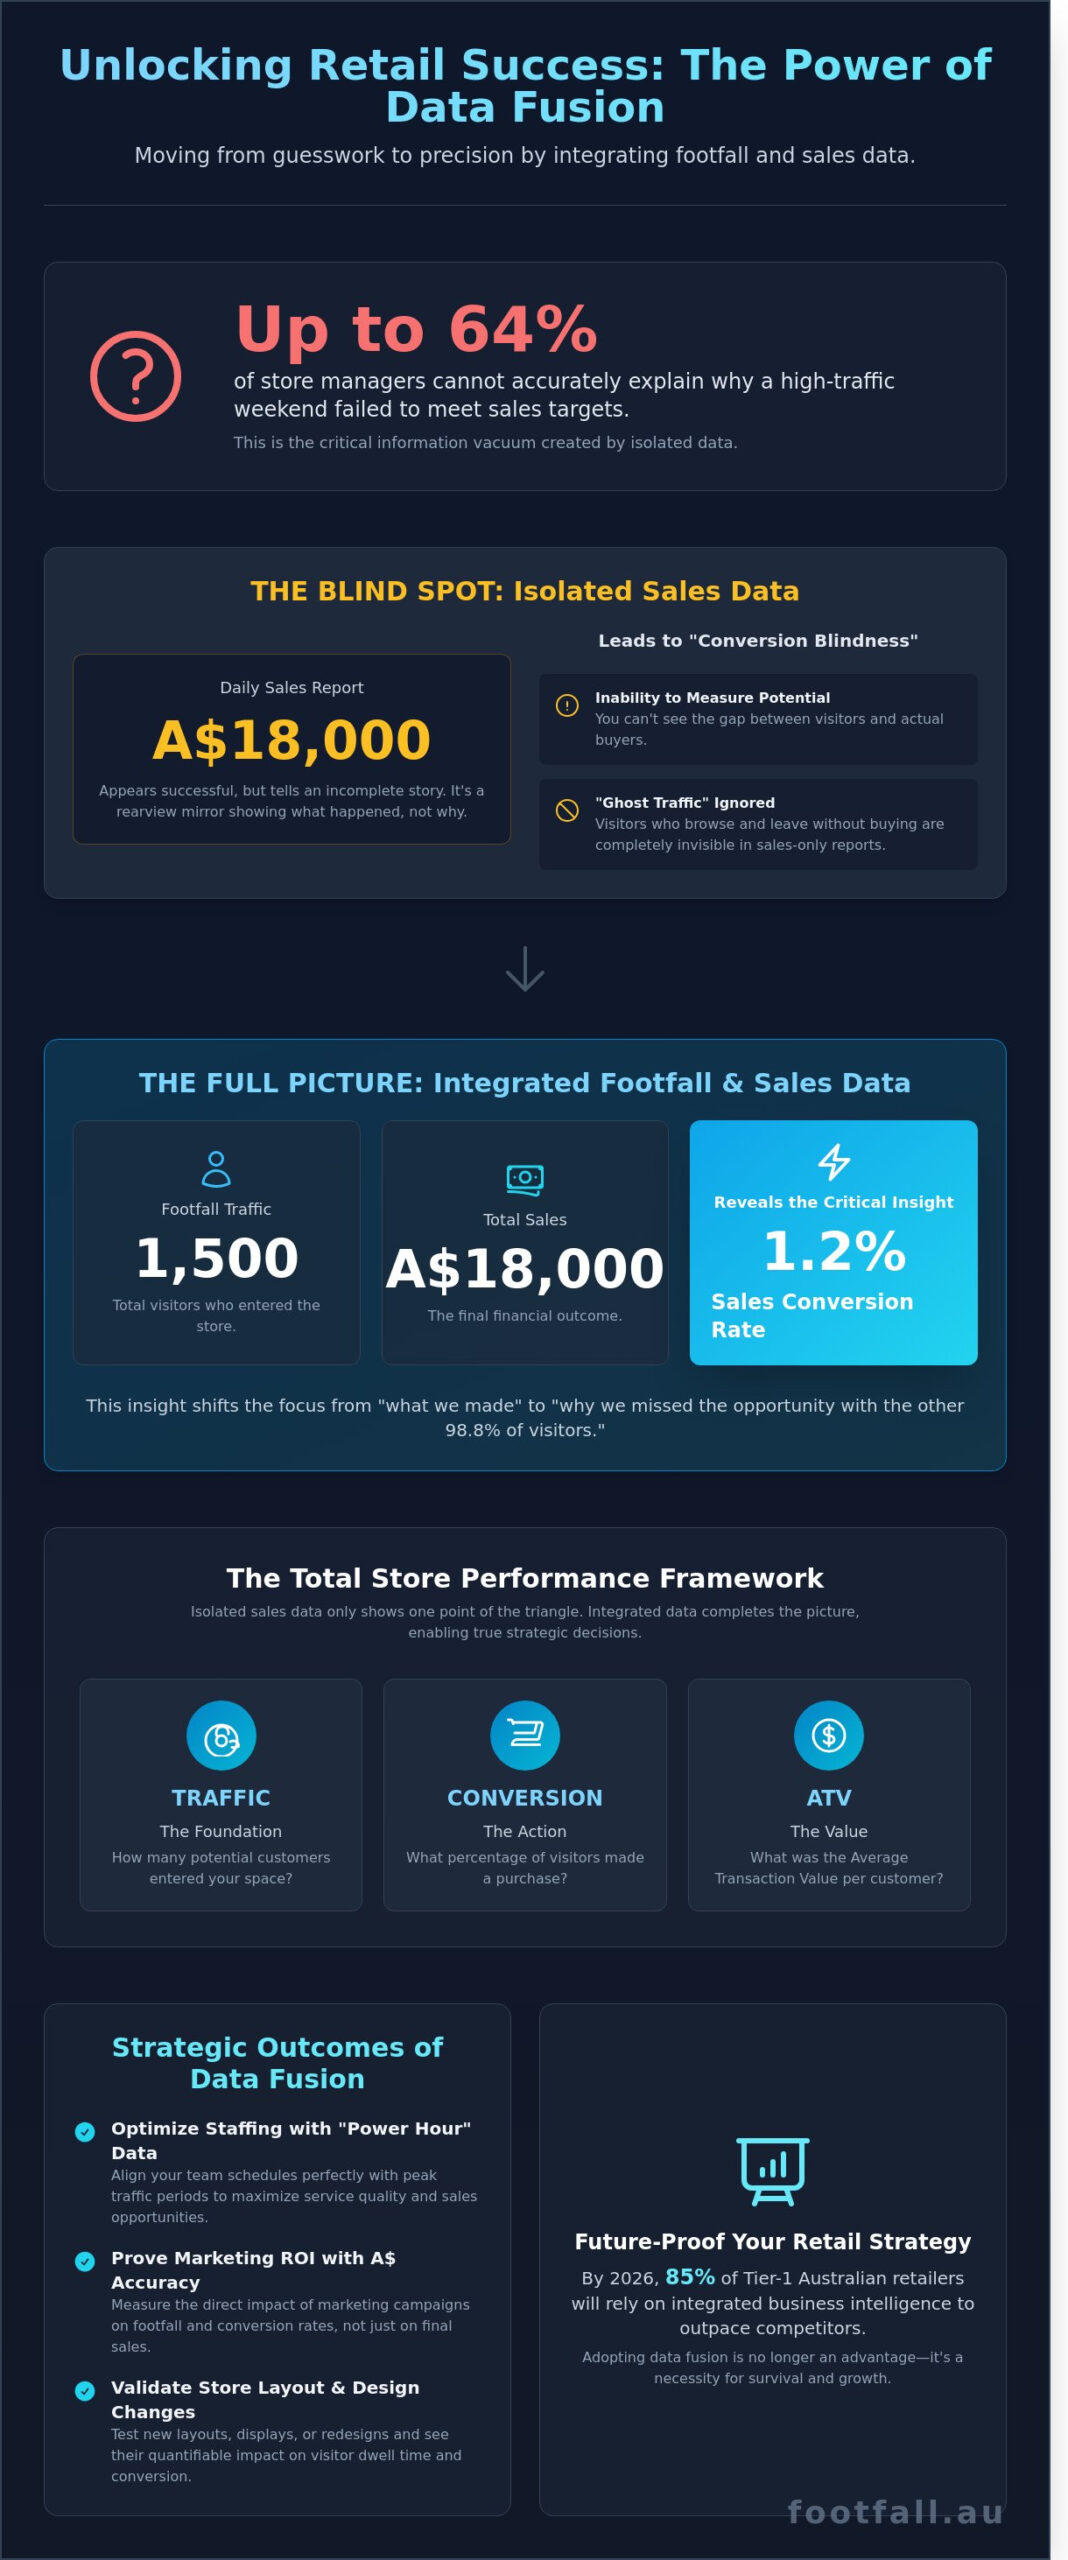
Recent data from Australian retail analysts suggests that up to 64% of store managers cannot accurately explain why a high-traffic weekend failed to meet sales targets. You’ve likely felt the frustration of a packed floor in your Sydney or Melbourne flagship only to see underwhelming figures at close of play. To solve this, you must integrate footfall and sales data to bridge the gap between simple visitor counts and actual transaction value. This isn’t just about counting heads; it’s about decoding the human intent behind every entry to ensure your floor space is performing at its peak.
We agree that guessing your conversion rate is no longer a viable strategy for 2026. This guide provides the blueprint to unlock actionable insights, allowing you to move away from intuition and toward a model of retail precision. You’ll learn how to consolidate your KPIs into a single dashboard, prove your marketing ROI with A$ accuracy, and implement staffing schedules that align perfectly with peak demand. We’ll start by breaking down the silos between your marketing and operations teams to create a seamless flow of intelligence that drives measurable growth.
Key Takeaways
- Understand the critical shift from isolated sales figures to data fusion, revealing the human behavior and “why” behind every transaction.
- Discover the technical roadmap to successfully integrate footfall and sales data via automated APIs or secure local server uploads for a unified reporting view.
- Master high-precision KPIs like Sales Conversion Rates and Shopper-to-Staff ratios to benchmark store effectiveness with scientific accuracy.
- Learn to optimize Australian staffing rosters against “Power Hours” to maximize revenue and service quality during peak traffic periods in Sydney or Melbourne.
- Explore how advanced sensor hardware and local technical support provide a future-proof foundation for retail growth and marketing attribution in 2026.
The Power of Data Fusion: Why Footfall and Sales Integration is Non-Negotiable
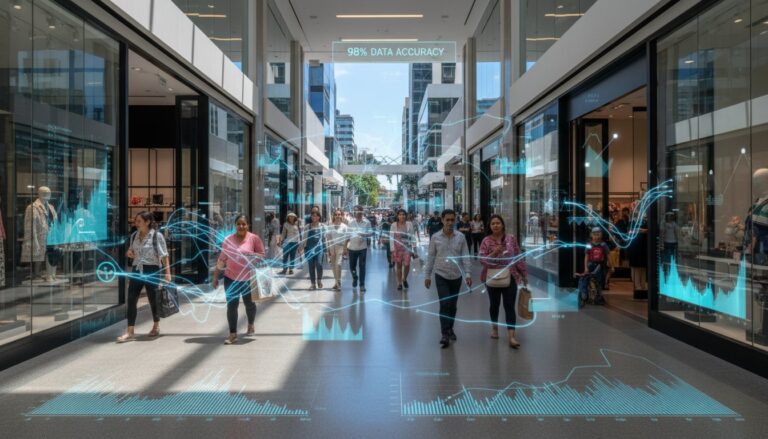
Data fusion represents the automated synchronisation of visitor traffic with Point of Sale (POS) transaction records. When you deploy people counting systems alongside your financial data, you move from recording outcomes to understanding behaviours. Sales data alone is a rearview mirror; it shows what happened yesterday but fails to explain why 450 people entered your Sydney CBD flagship store while only 38 made a purchase.
To integrate footfall and sales data is to bridge the gap between physical movement and fiscal results. In the Australian retail market, where commercial rents in Melbourne’s Bourke Street Mall or Brisbane’s Queen Street can exceed A$3,000 per square metre, every visitor who leaves empty-handed represents a direct hit to your ROI. By 2026, 85% of Tier-1 retailers in these hubs will rely on integrated business intelligence to outpace competitors who still rely on gut feeling.
When you integrate footfall and sales data, you transform raw traffic into a roadmap for growth. This evidence-based approach provides the quiet confidence needed to make high-stakes decisions. It shifts the focus from “how much did we make?” to “how much did we miss?”
The Blind Spot of Isolated Sales Analytics
Relying solely on POS data creates a dangerous information vacuum. A store might report A$18,000 in daily sales and appear successful to an off-site stakeholder. However, if 1,500 people entered the premises, that 1.2% conversion rate suggests a massive failure in floor service or stock availability. This phenomenon involves ghost traffic; these are the visitors who browse, wait in long queues, and eventually leave without a trace in your accounting software.
Conversion Blindness is the inability to measure the gap between potential and actual customers.
Without this metric, you can’t determine if a revenue dip was caused by a drop in street traffic or a failure of your team to close sales. Data from a 2023 retail performance study showed that 72% of managers who lacked footfall insights incorrectly blamed marketing for poor sales when the actual issue was understaffing during peak Saturday afternoon hours. Integrated data eliminates this blame game by providing objective clarity.
Defining the Total Store Performance Framework
Success in physical retail rests on the Retail Triangle: Traffic, Conversion, and Average Transaction Value (ATV). Isolated sales data only tracks the final point of that triangle. Integration creates a holistic view of the customer journey from the moment they cross the threshold to the final tap of their card. This logic allows Australian business owners to validate strategic investments with precision rather than hope.
If you spend A$65,000 on a store redesign in a high-traffic Brisbane shopping centre, you need to know if it actually increased dwell time and conversion, not just total revenue. Integrated data provides that evidence. It replaces the anxiety of guesswork with the calm of calculated strategy. It ensures that every operational change is backed by a verifiable pattern of human movement.
This framework empowers you to see your store as a living laboratory. You can test new layouts, staffing models, or window displays and see the impact on conversion rates within hours. It’s a modern necessity for any business looking to survive the tightening margins of the next decade.
The Technical Roadmap: How to Integrate Footfall and Sales Data
Precision is the foundation of retail intelligence. To integrate footfall and sales data effectively, you must first audit your existing infrastructure. Modern Australian retailers typically operate on one of two systems: cloud-based POS platforms like Shopify or Vend, or legacy local server installations. The goal is to create a unified stream where every visitor entering your doors is matched against a transaction record. This alignment transforms raw numbers into a clear narrative of consumer intent and store performance.
Accuracy depends on granular time-stamp synchronisation. You shouldn’t rely on daily totals if you want to optimise staff rosters or marketing spend. Instead, align data at 60-minute intervals. If a Sydney flagship store sees a peak at 1:00 PM but sales don’t spike until 1:45 PM, you’ve identified a service bottleneck or a long dwell time that requires investigation. Data cleansing is equally vital. Advanced sensors now use AI to exclude staff counts and delivery personnel from the final tally. A 2023 audit of retail data found that failing to filter staff movements can skew conversion rates by as much as 12%, leading to flawed strategic decisions.
Automated API Integration vs. Manual Imports
Automated API connections offer a “set and forget” solution for real-time decision making. The FootfallCam V9 software simplifies this by handling diverse data payloads from various POS vendors through a centralised dashboard. For Australian multi-store networks, the process is streamlined. First, generate a secure access token within your POS settings. Second, map your unique site codes to the corresponding sensor IDs. Finally, initiate the data handshake. This eliminates human error and provides a live view of your conversion metrics across every territory. It’s the most reliable way to integrate footfall and sales data without manual intervention.
Handling Legacy Systems and Non-Cloud Data
Retailers using older POS hardware often face hurdles with native cloud connectivity. In these cases, a “Legacy Swap Out Plan” is the most efficient path forward. By upgrading to sensors that handle data processing at the edge, you can bypass complex server configurations. For smaller boutiques in Adelaide or Perth, a daily CSV upload remains a viable alternative. Exporting sales logs at the close of business and uploading them to the analytics portal ensures your performance reports are ready by the next morning. You can explore integration options tailored to your specific hardware setup to ensure no data is left siloed. Since January 2024, over 40% of independent Australian retailers have adopted this hybrid approach to bridge the gap between old hardware and modern analytics.
Data integrity requires a disciplined approach to filtering. You must account for “delivery traffic” which can spike during morning hours. By setting specific exclusion zones or using height-based filtering, the system ignores objects that don’t fit the profile of a customer. This ensures your sales-to-visitor ratio remains pure. When your data is clean, your insights become actionable. You stop guessing why sales are down and start seeing exactly where the visitor journey is breaking down. It’s a shift from reactive management to proactive strategy, backed by the weight of evidence-based logic.
Deciphering the Integrated Dashboard: Key KPIs for Growth
Raw sales figures only tell half the story. They record the final transaction but ignore the hundreds of missed opportunities that walked out the door. When you integrate footfall and sales data, you gain the ability to see the entire customer journey. This integration transforms your dashboard from a simple ledger into a strategic roadmap. You stop guessing why a Tuesday was quiet and start seeing the exact correlation between door counts and register rings.
The Conversion Rate: Your Store’s Vital Sign
The sales conversion rate is the most critical metric for any physical retailer. You calculate it by dividing total transactions by total footfall and multiplying by 100. In the Australian retail landscape, benchmarks vary significantly by sector. A high-intent environment like a hardware store often sees conversion rates between 65% and 80%, as customers usually arrive with a specific task in mind. Conversely, fashion retailers in high-traffic areas like Melbourne’s Bourke Street Mall might average between 15% and 25%.
- Low Conversion Alerts: If your rate drops 5% below your 30-day rolling average, it’s a signal to investigate.
- Staffing issues: A high volume of shoppers with low sales often indicates that your A$28-per-hour floor staff are stretched too thin to close deals.
- Stock misalignment: If footfall is high but conversion is low, your marketing is working, but your inventory isn’t meeting the demand.
ATV and Dwell Time Correlation
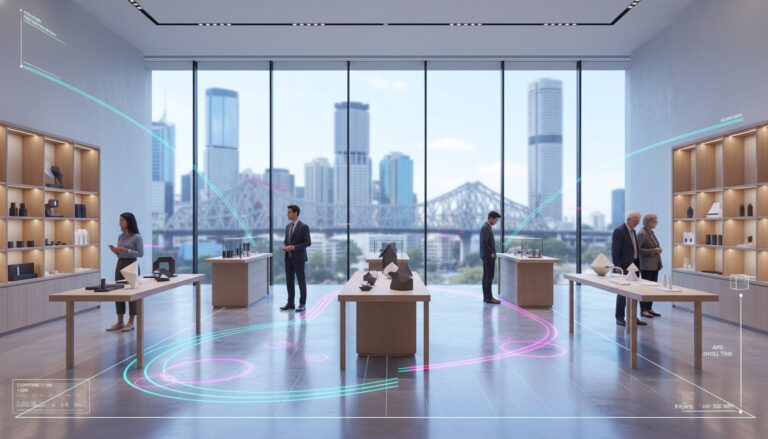
Utilising FootfallCam Pro2 data allows managers to see how long a customer stays and how much they spend. This relationship isn’t always linear. Data from 2023 retail studies shows that “mission shoppers” often have a low dwell time but a high Average Transaction Value (ATV). They know what they want, buy it, and leave. “Window shoppers” may stay for 25 minutes but result in a A$0 transaction. By looking at these metrics together, you can tailor your floor layout to cater to both groups.
Sales per Visitor (SPV) adds another layer of precision. While ATV tells you the value of a successful sale, SPV tells you the value of every person who crosses the threshold. If your SPV is A$12 and your store attracts 4,000 visitors monthly, your revenue is A$48,000. Increasing that SPV by just A$3 through better upselling or layout optimization adds A$12,000 in monthly revenue without requiring a single extra cent in marketing spend. Heatmaps integrated with sales data pinpoint high-traffic zones where engagement is high but transactions are zero, revealing specific areas where product placement fails to convert interest into revenue.
Operational efficiency also relies on the Shopper-to-Staff Ratio. To integrate footfall and sales data effectively, you must track how many staff members are on the clock during peak “power hours.” If a Sydney boutique has 40 shoppers entering per hour but only two staff members, the conversion rate will naturally plummet. Maintaining a ratio of 1:10 or 1:15, depending on the service level required, ensures you don’t waste the A$150 you spent on digital ads to get those shoppers through the door.
Strategic Implementation for the Australian Retail Landscape
Strategy in Australian retail requires precision. High operational costs, particularly under the Fair Work Act, mean guesswork is expensive. When you integrate footfall and sales data, you transform raw numbers into a roadmap for profitability. This integration allows you to move beyond basic reporting and start predicting consumer behaviour with scientific accuracy.
Roster Optimisation and Fair Work Compliance
Australia’s retail labour market is one of the most expensive globally. Base rates for Level 1 employees under the General Retail Industry Award 2020 increased to A$24.73 per hour in July 2023. You can’t afford to overstaff during quiet periods; conversely, understaffing during “Power Hours” leaves money on the table. Use historical traffic patterns from major events, such as the 2023 Black Friday weekend, to predict 2024 staffing needs. Align your highest-performing sales staff with these peak periods to ensure high-value traffic meets your best closers. This data-driven approach ensures you remain compliant with Fair Work requirements while protecting your margins.
Marketing Effectiveness and Footfall Attribution
Digital spend in Sydney and Melbourne often disappears into a black hole without physical attribution. Integrated data reveals the “In-Store Effect” of your digital campaigns. If a localised Instagram campaign targeting Brisbane shoppers doesn’t move the needle on the “Turn-in Rate,” your creative or targeting strategy failed. If traffic rose in your Canberra stores but sales stayed flat, the floor team or stock levels were likely the bottleneck. By comparing the “Catchment Area” effectiveness with actual sales conversion, you can justify local marketing budgets based on evidence rather than intuition. This allows for a granular evaluation of window displays, where you compare how many people entered the store versus how many actually made a purchase.
Store layout optimisation relies on the same logic. Use spatial analytics to justify floor plan changes. If data shows high dwell time in a specific back corner but zero sales conversion, that area is a “dead zone” despite the traffic. Reallocate high-margin products to these high-traffic areas based on integrated evidence. This ensures every square metre of your Australian floor space is generating maximum yield.
The ROI of this integration is quantifiable and immediate. Small gains lead to massive outcomes. Consider a store with 8,000 monthly visitors and an average transaction value (ATV) of A$115. A 15% conversion rate generates A$138,000 in monthly revenue. Lifting that conversion rate by just 1% to 16% adds A$9,200 to your monthly top line. Over a single year, this represents an A$110,400 increase from just one location. When you integrate footfall and sales data, you gain the visibility required to trigger these incremental gains across your entire network.
Precision in retail management isn’t a luxury; it’s a requirement for survival in a competitive market. Stop guessing where your revenue leaks are occurring and start using hard evidence to plug them.
Explore our integration solutions to start capturing these gains today.
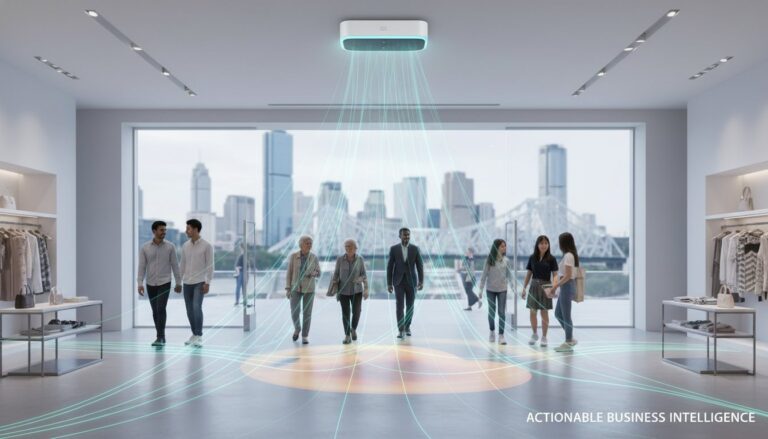
Future-Proofing Your Retail Strategy with Footfall Australia
The FootfallCam Pro2 sensor serves as the high-precision eyes of your store; the V9 software acts as the strategic brain. This hardware-software synergy allows retailers to integrate footfall and sales data without the manual errors associated with legacy systems. By 2026, retail success will depend on predictive modeling rather than reactive adjustments. Footfall Australia provides the infrastructure to bridge that gap today, moving beyond simple traffic counts to true conversion intelligence. Our systems deliver 98% counting accuracy, providing a foundation of evidence that replaces guesswork with actionable logic.
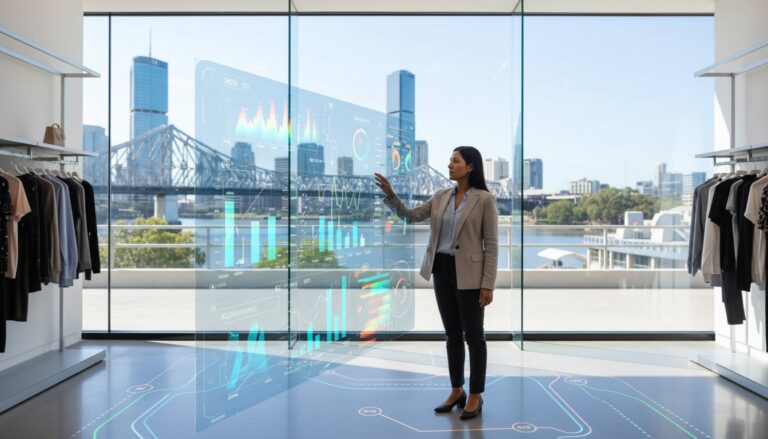
The FootfallCam V9 Ecosystem
The V9 dashboard isn’t just a display; it’s a central intelligence hub. It uses automated API ingestion to pull sales figures directly from your POS system, matching every dollar to a specific visitor journey. This automation eliminates the 5 to 10 hours per week store managers often waste on manual data entry. We’ve designed the reporting to be modular. A Store Manager sees real-time staff-to-customer ratios to optimize the floor, while the C-Suite accesses high-level regional performance benchmarks across 200+ locations. Security remains a non-negotiable priority. All data processing aligns with Australian Privacy Principles, ensuring your customer insights never compromise individual anonymity or local data protection standards.
Scalability is a core feature of our architecture. We support businesses at every stage of growth, whether you’re managing a single boutique in Perth or a national retail chain with 500 outlets. The system grows with you. You can start with basic traffic monitoring and layer on heat mapping or queue management as your operational needs evolve. This flexibility ensures your initial investment remains relevant as market conditions shift toward 2026 consumer trends, where hyper-localization will be the primary driver of profitability.
Local Expertise and Support Plans
Technical friction is the primary reason most data integration projects fail. Choosing a local Australian partner removes this barrier. Footfall Australia provides on-the-ground technical support specifically for complex POS integrations, ensuring your software “handshake” is seamless and permanent. We understand the nuances of the Australian retail landscape, from the seasonal shifts in Melbourne’s CBD to the specific trading hours of regional shopping centers. Our team ensures your hardware is calibrated for local lighting and architectural conditions, which can vary significantly across different states.
- Premium Support Plans: These plans offer proactive monitoring to ensure 99.9% data uptime, preventing gaps in your historical records.
- Custom API Development: We help bridge the gap between niche POS systems and the V9 analytics suite.
- Data Integrity Audits: Regular checks to ensure your conversion rates remain accurate as store layouts change.
Staying ahead of the competition requires more than just collecting numbers; it requires a partner who can help you decode them. As consumer behavior becomes more unpredictable, having a unified data stream becomes your most valuable asset. Don’t let your sales data sit in a silo while your footfall data remains untapped. Discover how Footfall Australia can integrate your data today and start making decisions based on the reality of your store floor.
Master the Precision of Data-Driven Retail
Transitioning from fragmented metrics to a unified strategy isn’t just an upgrade; it’s a survival requirement for the modern Australian storefront. You’ve learned that a true technical roadmap requires more than just counting heads. It demands a seamless link between your physical traffic and your transaction records. When you integrate footfall and sales data, you bridge the gap between simple attendance and actual revenue growth. This fusion reveals exactly where your conversion leaks happen and how your staff scheduling impacts the bottom line.
Footfall Australia has been empowering local businesses since 2004. Our proprietary V9 Software offers native POS integration that turns raw numbers into actionable intelligence. With dedicated local support teams stationed in all major Australian cities, you’re never navigating these technical shifts alone. It’s time to stop guessing why customers walk out and start understanding the specific journey they take.
Maximise your retail conversion with Footfall Australia
The evidence is ready for you to use. Let’s build a more profitable future for your store together.
Frequently Asked Questions
How do I calculate my store’s conversion rate using footfall data?
You calculate your conversion rate by dividing the total number of sales transactions by the total number of visitors recorded by your footfall counter. If your Sydney boutique records 400 visitors and 60 transactions in a single day, your conversion rate is 15%. This figure provides an objective measure of how well your staff and store layout turn browsers into paying customers.
Can I integrate sales data from any POS system with FootfallCam?
Yes, FootfallCam is designed to integrate footfall and sales data from over 60 global POS providers, including Australian favourites like Vend, Square, and Hike. The platform uses a flexible API architecture to pull transaction records directly into your analytics dashboard. This ensures you have a unified view of your retail performance without needing to switch between different software applications.
Is it possible to automate the sales data import process?
You can fully automate the data transfer using an API connection or scheduled SFTP uploads. Most retailers in Australia set their systems to sync at 11:00 PM nightly, ensuring the previous day’s metrics are ready for review by 8:00 AM the following morning. Automation removes the risk of manual entry errors and saves your management team approximately 3 hours of administrative work each week.
What is a good conversion rate for a retail store in Australia?
A strong conversion rate for Australian specialty retail typically sits between 20% and 30%, though this varies significantly by sector. Luxury retailers often operate at a 5% to 12% conversion rate, while high-volume pharmacies frequently see figures above 45%. Comparing your 2024 data against these specific industry benchmarks helps you determine if your store is meeting local market expectations.
Do I need a developer to integrate my sales and footfall data?
You don’t need a developer if you’re using one of our standard integration modules for popular POS platforms. Our technical team handles the configuration process, which typically takes about 90 minutes to establish. If you’re using a bespoke or legacy database system, a developer might spend 4 to 6 hours mapping the specific data fields to our API endpoints.
How does integrating data help with staff scheduling?
Integration allows you to identify your Sales Per Labour Hour (SPLH) and match staff levels to actual visitor peaks. If your data shows a 35% increase in foot traffic every Friday at 1:00 PM, you can schedule your top sellers during this window to maximise conversion. This evidence-based approach reduces labour costs by 12% on average by eliminating overstaffing during quiet morning periods.
Will my data remain secure and private during the integration process?
Your data remains protected by enterprise-grade encryption and strictly adheres to the Australian Privacy Act 1988. FootfallCam uses TLS 1.2 protocols for all data transmissions, ensuring that sensitive financial figures are never exposed to external parties. We manage over 15 million data points daily with a 99.9% server uptime, providing a secure environment for your most critical business intelligence.
What happens if my POS system doesn’t have an API for integration?
You can still integrate footfall and sales data by using a simple CSV upload or a secure FTP folder. You just export your daily sales report and drop the file into the FootfallCam portal, which takes less than 4 minutes to process. This ensures that even retailers using older hardware can access sophisticated conversion analytics and make data-driven decisions for their business.