Maximise Retail ROI with Store Traffic Analytics
What if a store’s busiest hours aren’t its most productive? Store traffic analytics can show the gap between visits and outcomes, but a visitor count alone can’t explain it. Retail teams need consistent measures they can compare across days, stores and operational changes, without treating a pattern as proof of cause.
This guide explains how to choose metrics for the question at hand, interpret footfall alongside measures such as conversion rate, and use reliable data to assess practical changes. You’ll learn how to distinguish a useful signal from a misleading fluctuation, make fair comparisons and connect observed shopper activity with operational decisions. The aim isn’t to add dashboards, but to make a clearer decision, then check whether the change made a difference.
Key Takeaways
- Store traffic analytics is most useful when you match each measure, from footfall to dwell time, to a specific business question.
- Separate visitor volume from conversion rate and traffic patterns. Counts alone can’t explain why results changed.
- Use a simple test sequence: define the decision, choose a metric, establish a baseline, make a change and review the result.
- Build a consistent measurement process with clear metric definitions and regular reviews. Footfall Australia offers FootfallCam Pro2 People Counters and FootfallCam V9 Software as an integrated hardware and software option.
What Store Traffic Analytics Measures, and What Visitor Counts Cannot Tell You
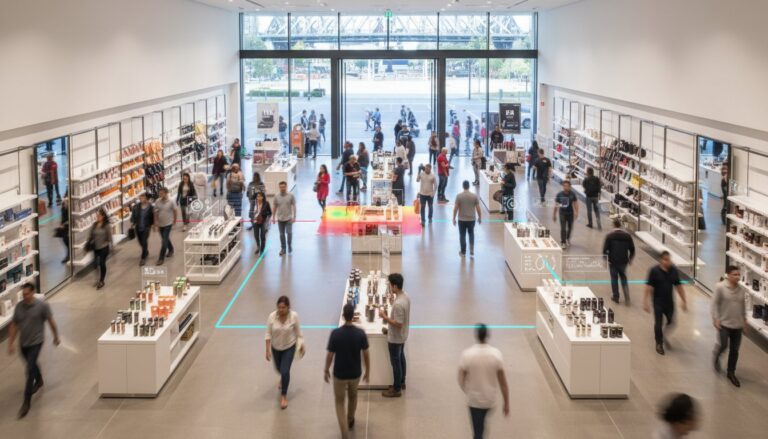
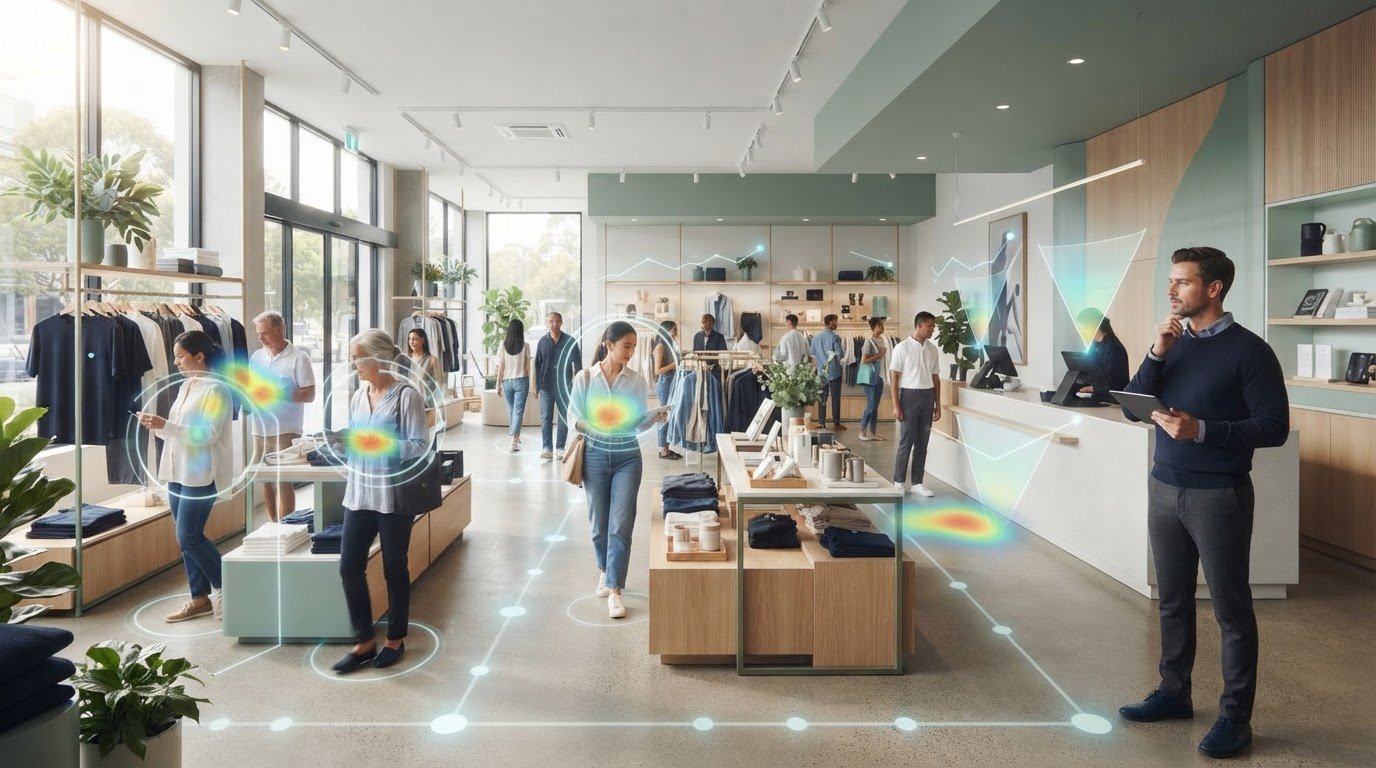
Store traffic analytics measures and interprets the volume and movement of visitors through a physical store. A footfall count records how many people enter during a defined period. It indicates visitor volume, but not whether those visits led to purchases or what visitors experienced inside.
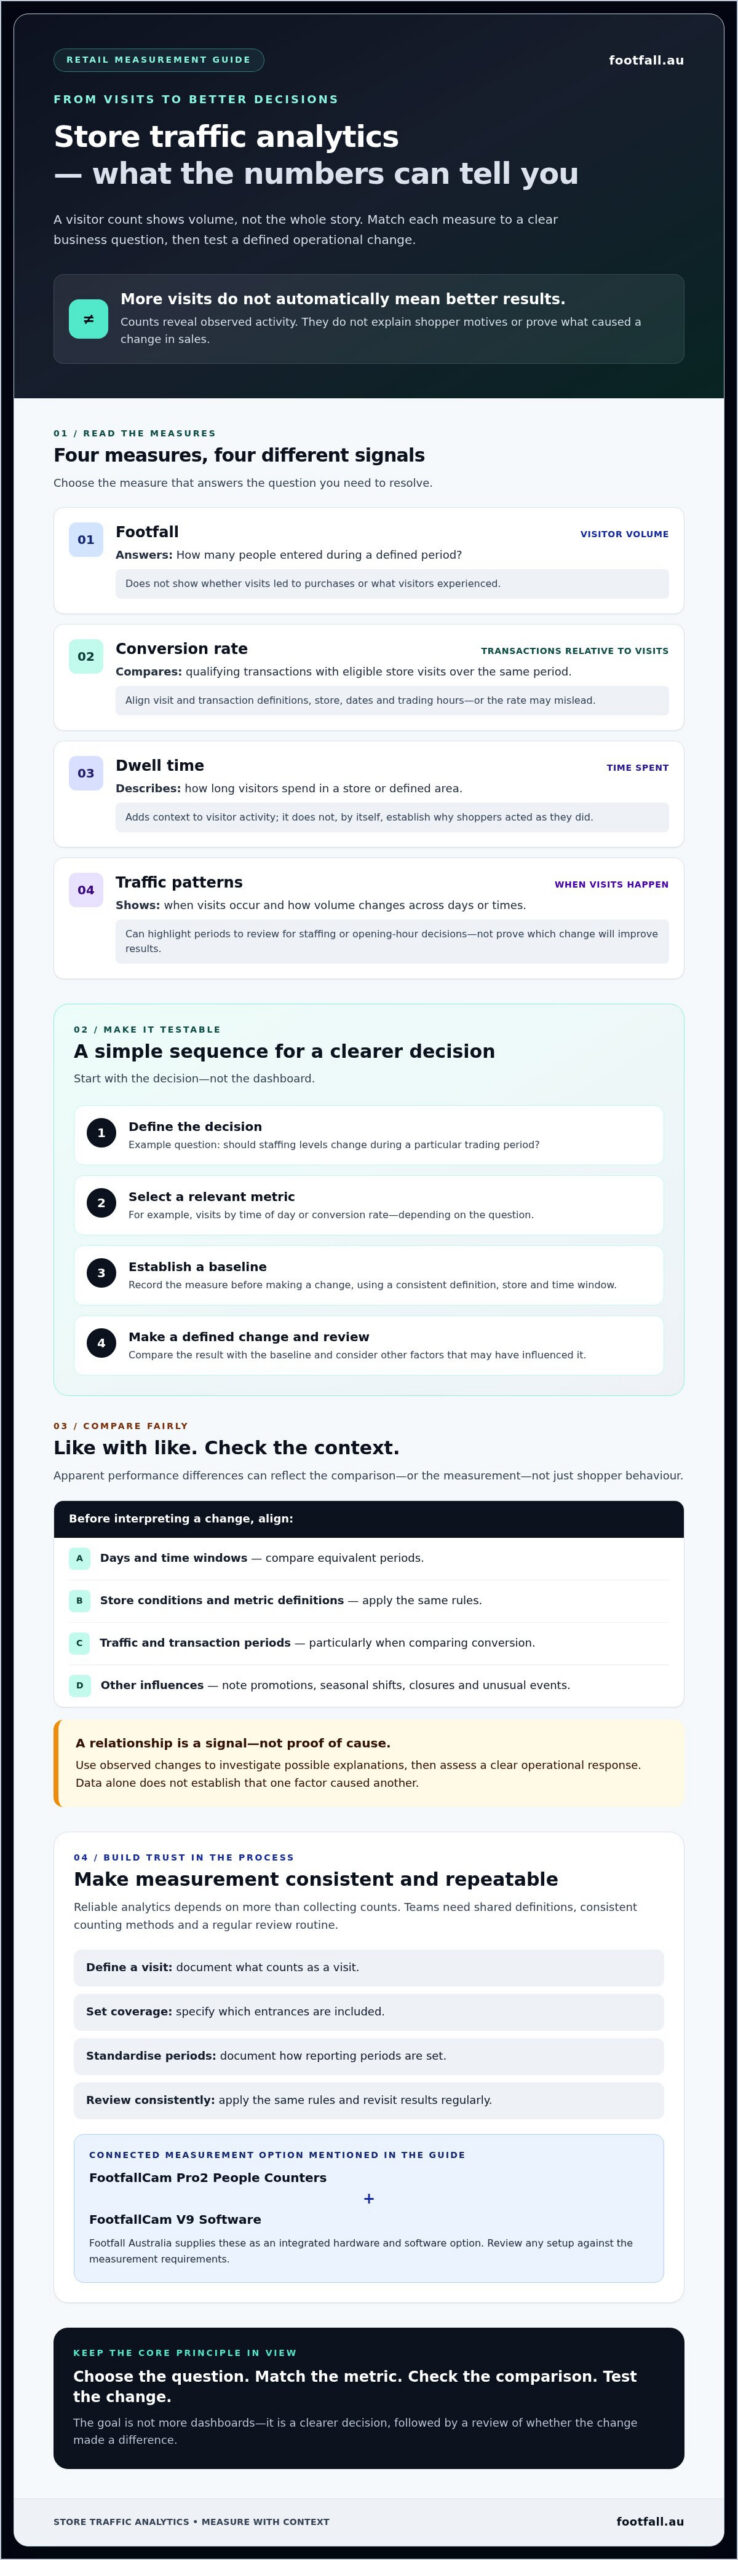
Other measures provide context. Conversion rate compares qualifying transactions with eligible store visits over the same period. Dwell time describes how long visitors spend in a store or a defined area. Traffic patterns show when visits occur and how volume changes across days or times. Together, these measures can highlight patterns worth investigating, but they don’t reveal customer motives or prove that a particular factor caused sales to rise or fall.
Which store traffic metrics answer different business questions?
Start with the decision you need to make. Visitor counts answer, “How many people came in?” Comparing counts by day and time adds, “When were visits concentrated?” This can help identify periods to review when assessing staffing or opening-hour patterns, but it doesn’t establish which change would improve results.
To calculate conversion rate, use a consistent count of eligible visits and a comparable transaction count for the same store and time period. Visit and transaction data may come from separate systems, so align their definitions, dates and trading hours. If one source covers different hours or dates, the resulting rate may be misleading.
A metric is useful only when it helps answer a specific business question. Use it to identify a signal, then investigate possible explanations and assess a defined change. Treat the data as evidence of observed activity, not a complete account of why shoppers acted as they did.
How to Turn Store Traffic Analytics into a Testable Decision
Useful analysis starts with a decision, not a dashboard. Store traffic analytics can help frame a question, but teams need to assess a change before concluding that an operational choice improved performance.
- Define the decision: Should staffing levels change during a particular trading period?
- Select a metric: Choose a measure that relates to the question, such as visits by time of day or conversion rate.
- Establish a baseline: Record the metric before making a change, using a consistent definition, store and time window.
- Test and review: Make a defined adjustment, compare results with the baseline and consider other factors that may have influenced them.
The same approach can help investigate whether opening-hour patterns align with visitor activity or whether visits shift during a campaign. These are questions to examine, not outcomes the data guarantees. For a deeper framework, explore this strategic guide to footfall data analysis.
How can teams compare traffic data without drawing false conclusions?
Compare like with like: use the same days of the week, time windows, store conditions and metric definitions. Note promotions, seasonal shifts, closures and unusual events, as these may affect visits independently of the change being assessed. For conversion comparisons, align traffic and transaction data to the same store and periods. If the data doesn’t cover the same hours or dates, check the mismatch before interpreting the rate.
A relationship between two observed measures is a correlation, not proof that one caused the other. Treat a change as a signal to investigate, then assess a clear operational response. Retailers reviewing their measurement setup can also consider Footfall Australia’s people-counting options.
Build a Store Traffic Analytics Process Teams Can Trust
Reliable store traffic analytics depends on more than collecting counts. Teams need consistent counting methods, shared definitions and a regular review routine. If stores classify visits differently or compare different periods, apparent performance differences may reflect measurement rather than shopper behaviour. Document what counts as a visit, which entrances are included and how reporting periods are set, then apply those rules consistently.
People-counting hardware and analytics software can support this process as a connected option. Footfall Australia supplies FootfallCam Pro2 People Counters and FootfallCam V9 Software. Review the product information against your measurement requirements, and see the people counting systems guide for Australia for broader context.
What should a practical analytics review include?
Keep each review focused and repeatable. Record:
- The question: What operational decision are you assessing?
- The metric and period: Which measure are you using, and what dates or trading hours does it cover?
- The observation: What changed, and what relevant conditions may have affected the result?
- The next test: What action or further measurement could help clarify the finding?
Use the same definitions and review routine across stores before comparing results. If a count appears unusual, check whether entrance coverage, counting conditions or data availability changed before interpreting it as a shift in traffic. Keep observations separate from explanations, and treat each conclusion as something to validate rather than assume.
Begin by identifying the decisions your team needs to support and the data required for dependable comparisons. Then review Footfall Australia’s solutions to consider relevant people-counting hardware and analytics software.
Make Your Next Retail Decision Evidence-Led
Store traffic analytics creates value when teams use consistent measures to answer a clear question, assess a practical change and review what the evidence shows. Footfall counts describe visits. Comparisons with aligned transaction data can add context, but patterns don’t prove why shoppers acted as they did. A reliable process keeps these limits in view and turns observations into better-informed decisions.
Footfall Australia serves retailers across Australia through a national partner network. Its offerings include FootfallCam Pro2 People Counters and FootfallCam V9 Software, combining people-counting hardware with analytics software.
Explore Footfall Australia’s people-counting and analytics solutions to discuss the right measurement approach for your business.
Frequently Asked Questions
What is store traffic analytics?
Store traffic analytics is the measurement and interpretation of visitor volume and movement in a physical store. It can include footfall counts, patterns by time and dwell time. When comparable transaction data is available, teams can also assess conversion rate. These measures describe observed activity; they don’t reveal shoppers’ motives or prove what caused a sales result.
How do you measure store traffic?
Measure store traffic with people-counting equipment at relevant entrances, using consistent counting rules and time periods. Check that each comparison covers the same entrances and trading hours. To calculate conversion, pair eligible visit counts with transaction data for the same store and period. Review promotions, seasonal shifts and unusual events before interpreting changes.
Can store traffic analytics improve retail conversion rates?
Store traffic analytics can help teams identify patterns to investigate, but collecting data alone won’t increase conversion. Compare visits and transactions over aligned periods, then assess a specific operational change, such as adjusting staffing during a high-traffic period. Review the result against a baseline and consider other influences. The comparison can inform decisions, but it can’t guarantee an improvement or prove cause by itself.
What is the difference between footfall and store traffic analytics?
Footfall is the count of people entering a store over a defined period. Store traffic analytics is broader: it uses footfall and other relevant measures to examine patterns in visitor volume and movement. Depending on available, comparable data, analysis may also include dwell time or conversion rate. In short, footfall is one input; analytics interprets measures in relation to a business question.