Measuring Engagement in Exhibition Spaces: The 2026 Data-Driven Guide
With 78% of organizations across Australia and New Zealand now utilizing AI for event management, the standard for success has shifted from simple attendance to sophisticated behavioral analysis. You likely recognize that a high visitor count doesn’t always translate to meaningful interaction, yet justifying ROI to stakeholders remains difficult without deeper insights. It’s a persistent challenge; manual surveys are often too slow and biased, leaving you with gaps in your understanding of how visitors truly navigate your environment. This 2026 guide focuses on measuring engagement in exhibition spaces by transforming raw movement into actionable, data-driven metrics.
We’ll show you how to replace intuition with empirical evidence, using advanced analytics to capture the narrative of human movement. You’ll learn a clear framework for quantifying “stopping power” and dwell time, allowing you to identify exactly which exhibits underperform and why. We’ll explore how automated reporting saves time for your staff while providing the data-backed evidence needed to support future layout and design decisions. By the end of this article, you’ll have a strategic roadmap to optimize every square meter of your exhibition impact.
Key Takeaways
- Move beyond vanity metrics by defining success through the intersection of visitor presence, duration, and meaningful interaction.
- Utilize dwell time and heatmap analysis to pinpoint exhibition “dead zones” and resolve bottlenecks that disrupt the visitor narrative.
- Replace biased manual surveys with automated AI sensors to capture objective behavioral data without the interference of the “observer effect.”
- Establish a clear framework for measuring engagement in exhibition spaces that provides the empirical evidence needed to justify ROI to stakeholders.
- Leverage high-precision hardware like the FootfallCam Pro2 to gain real-time insights while preserving the aesthetic integrity of curated spaces.
Beyond Attendance: Defining Meaningful Engagement in Modern Exhibitions
Success in a physical space used to be measured by how many people crossed the threshold. While door counts provide a baseline for total traffic, they offer almost no insight into whether the content actually resonated with the audience. In 2026, the industry has moved beyond these vanity metrics. We now define engagement as the precise intersection of presence, duration, and interaction. It’s about understanding the narrative of movement. Relying on entry numbers alone fails to reflect exhibition success because it treats a person who spends 30 minutes studying a centerpiece the same as someone who merely walks through to find the exit.
By measuring engagement in exhibition spaces through a data-driven lens, you can differentiate between these two behaviors. This transition from qualitative guesses to quantitative behavioral narratives allows curators to see their space as a living environment rather than a static room. This analytical approach is rooted in the foundations of museum informatics, which bridges the gap between digital data and physical experiences to create more impactful public spaces.
The Three Pillars of Exhibition Analytics
- Attraction: This measures the percentage of total visitors who actually stopped at a specific exhibit. It reveals the “stopping power” of your visual design and marketing.
- Retention: This tracks how long they stayed once they stopped, often referred to as dwell time. High retention suggests that the exhibit successfully held their attention and provided value.
- Flow: This maps the path visitors took through the hall. It identifies where they dropped off, which exhibits they skipped, and where physical bottlenecks formed.
Why Australian Institutions are Moving to Evidence-Based Curation
Institutions across Australia are facing increased pressure to justify both public and private funding. Stakeholders no longer accept vague reports on visitor satisfaction; they demand hard data that proves cultural and economic impact. Adopting these metrics helps organizations meet the “National Standards for Australian Museums and Galleries” by ensuring spatial optimization and accessibility are backed by empirical evidence. A key part of this strategy is calculating “Holding Power.” We define Holding Power as the ratio of average dwell time to the physical size of the exhibit. This metric allows you to compare the efficiency of a small interactive display against a large-scale installation. Using this data for measuring engagement in exhibition spaces ensures every design decision serves a strategic purpose and maximizes the utility of the available space.
The Core Metrics of Visitor Engagement: Dwell Time and Flow Analysis
Effective management of physical environments requires more than just counting heads. It demands an understanding of how visitors spend their time. Dwell time is the primary indicator of interest; it allows us to distinguish between a visitor who is simply “passing through” and one who is truly “engaged.” By setting specific thresholds, such as a minimum stay of 30 seconds, you can filter out incidental movement and focus on meaningful interactions. This quantitative framework for assessing visitor engagement ensures that your reports reflect genuine interest rather than accidental traffic.
Path tracking takes this a step further by mapping the sequential journey through your narrative. It’s not enough to know people stayed; you need to know where they went next. Analyzing these patterns helps you compare engagement across different days, peak times, and even broad visitor demographics. This cross-analysis reveals whether your content resonates equally with morning school groups and weekend tourists, providing a level of detail essential for measuring engagement in exhibition spaces that manual observation simply cannot match. For those planning to visit international exhibitions in destinations like Singapore or Thailand, you can find out more about streamlining your entry documentation through professional concierge services.
Decoding Heatmaps for Spatial Strategy
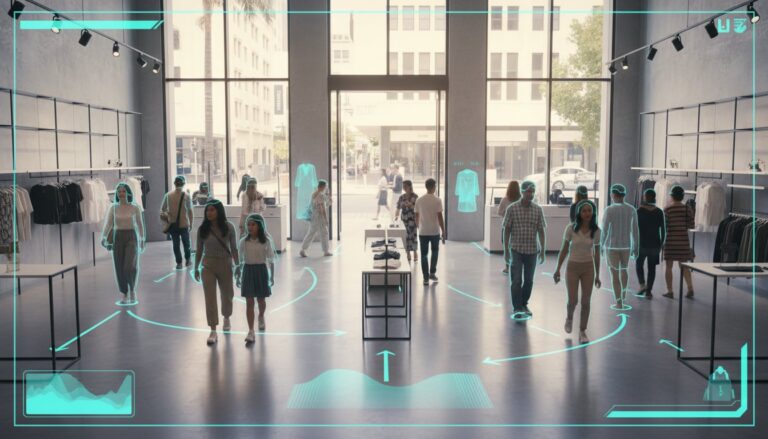
Heatmaps provide a visual representation of density, making it easy to see which exhibits attract the most attention. You can instantly identify high-traffic “hotspots” versus neglected “dead zones” in the corners of the hall. This is where footfall data analysis becomes a strategic tool. By correlating these visual maps with specific curated content, you can determine if a lack of engagement is due to the exhibit itself or its physical placement.
Data also helps you identify “The Friction Point.” This occurs when visitor density reaches a level that causes discomfort, leading to disengagement. If a heatmap shows a deep red cluster that doesn’t move, you’ve found a bottleneck. Relocating a popular display or widening a walkway can instantly improve the visitor experience. If you’re looking to refine your spatial strategy, exploring automated analytical tools can help you visualize these trends in real-time.
Visitor Flow and Narrative Sequencing
Every exhibition tells a story, and the “Golden Path” is the ideal route you’ve designed for visitors to follow. Path tracking data allows you to see if reality matches your vision. You might discover an “Exit Leak,” where a significant percentage of visitors leave the exhibition prematurely through a side door or after a specific display. Identifying these leaks allows for iterative curation, such as placing more compelling signage or adjusting the lighting to draw visitors back into the main narrative.
Modern AI systems identify these flow patterns by processing movement as anonymous vectors, ensuring that individual privacy is strictly preserved while still providing the granular data needed for measuring engagement in exhibition spaces. By treating movement as a sequence of human actions, you can optimize the environment to better serve your audience’s natural behaviors.
Automated AI Counters vs. Manual Surveys: Choosing the Right Methodology
Choosing the right methodology determines whether your data is a reliable foundation for strategy or a collection of biased anecdotes. Historically, manual surveys and human observers were the only tools available for measuring engagement in exhibition spaces. While these methods provide qualitative depth, they’re often cost-prohibitive to maintain 24/7 and suffer from significant human error. AI sensors provide a more consistent longitudinal dataset, allowing managers to observe trends over months rather than just a few hours of sampling.
The “Observer Effect” remains a primary concern with manual tracking. When visitors see a person with a clipboard, their behavior shifts. They might spend more time at an exhibit to appear interested or move faster to avoid interaction. Automated systems eliminate this bias by remaining invisible to the visitor. This ensures the movement patterns you analyze are natural and authentic. It provides the quiet confidence that your decisions are based on how people actually behave when they think no one is watching.
Data integrity is further strengthened by compliance with shifting regulations. With the 2026 reforms to the Australian Privacy Act 1988, the definition of personal information has expanded to include technical data and device IDs, with penalties for breaches reaching up to AUD $50 million. Modern AI counters address this by processing movement as anonymous vectors. They don’t store facial images or personal identifiers, ensuring your organization remains compliant while moving beyond traditional metrics to capture deeper behavioral insights.
The Limitations of Self-Reporting
Surveys often fall victim to “recall bias,” where visitors misremember their journey or exaggerate their interest in specific topics to align with social desirability. There’s frequently a measurable gap between what people claim they liked and where they actually spent their time. This is why people counting technology has become the preferred baseline for Australian institutions. It provides an objective record of physical presence that complements, rather than relies on, visitor memory. By measuring engagement in exhibition spaces through direct observation, you gain a transparent view of exhibit performance.
AI-Driven Insights: Beyond Simple Counting
Advanced 3D sensors offer more than basic tallies. They use height filtering to distinguish between children, adults, and staff, which is essential for understanding demographic engagement. These systems also provide real-time alerts for capacity management, ensuring safety standards are met during peak periods. Integrating people counting systems Australia into your existing exhibition management software allows for seamless reporting and immediate operational adjustments, turning raw movement into a strategic narrative of success.

Optimising Exhibition Layouts Through Real-Time Behavioral Data
Data reaches its full utility only when it drives specific, positive changes in exhibition operations. While historical analysis is vital for long-term planning, real-time behavioral data allows you to intervene during a live event. This process, known as iterative curation, transforms a static display into a responsive environment. By measuring engagement in exhibition spaces as it happens, you can identify which displays are underperforming and test immediate solutions. This agile approach ensures that your exhibition remains optimized for its entire duration, rather than relying on post-event reflections to fix layout issues.
For organizers managing the logistical challenges of touring exhibitions across Australia, partnering with freight forwarders melbourne provides a reliable solution for transporting sensitive displays and technical equipment between major venues, ensuring the physical infrastructure is as ready as the analytical systems.
Testing “A/B Layouts” provides a scientific method for improving visitor interaction. You can compare two different signage styles or lighting configurations on different days to see which version increases dwell time or attraction power. This empirical evidence replaces intuition, giving you the quiet confidence to make design adjustments that are proven to work. With 87% of organizations planning to increase their AI budgets in 2026, the ability to forecast staffing needs through predictive analytics is becoming a standard requirement. Historical flow patterns allow you to predict peak periods, ensuring you have the right number of staff available precisely when visitor density is highest.
The Iterative Curation Framework
- Step 1: Establish baseline metrics during the first week of the exhibition to understand natural visitor flow and initial engagement levels.
- Step 2: Identify the lowest-performing exhibit by looking at its “Attraction Power,” which is the percentage of total visitors who stop at the display.
- Step 3: Modify the exhibit’s placement, lighting, or digital interactive elements, then measure the delta in engagement over the following 48 hours.
Maximising the “Boutique” Experience
Maintaining a premium experience requires careful management of crowd density. Data allows you to ensure every visitor has enough personal space to appreciate key artworks without feeling crowded. There is a direct correlation between high visitor density and lower satisfaction scores; when a space feels too full, dwell time usually drops as people rush to find quieter areas. Implementing people counting technology enables dynamic staffing at help desks and entry points to manage these surges effectively. This ensures that your exhibition maintains its curated atmosphere regardless of total attendance volume. If you’re ready to transform your spatial strategy with empirical evidence, explore our data-driven analytical solutions to begin optimizing your environment today.
Implementing FootfallCam Solutions for Australian Exhibition Excellence
Transitioning from analytical theory to physical implementation requires hardware that is as reliable as the data it produces. The FootfallCam Pro2 has established itself as the industry standard for measuring engagement in exhibition spaces. It provides the precision necessary to capture the narrative of movement without ever intruding on the visitor experience. By choosing a system designed specifically for high-density environments, you ensure that every interaction is recorded with scientific accuracy. This level of detail is essential for justifying ROI to stakeholders who demand more than just simple door counts.
Footfall Australia brings a distinct advantage to these complex installations. With a 20-year history of supporting national institutions, our team understands the unique challenges of the Australian cultural and events sector. We provide the local expertise and national support required to move beyond raw numbers into a strategic, long-term partnership. Our commitment to high-quality technical solutions ensures that your data remains a valuable asset that consistently drives operational growth and spatial optimization.
Hardware That Disappears into the Design
Curated environments demand a minimal aesthetic footprint. The FootfallCam Pro2 features a discreet, ceiling-mounted profile that preserves the visual integrity of sensitive gallery spaces. Its advanced wide-angle lens provides extensive coverage, which significantly reduces the total hardware count needed for large exhibition halls. We offer both wired and wireless options to accommodate the structural constraints of heritage-listed Australian buildings. This flexibility allows for high-precision tracking in spaces where traditional cabling might be prohibited, ensuring that historical integrity and modern analytics coexist seamlessly.
V9 Software: Your Central Engagement Hub
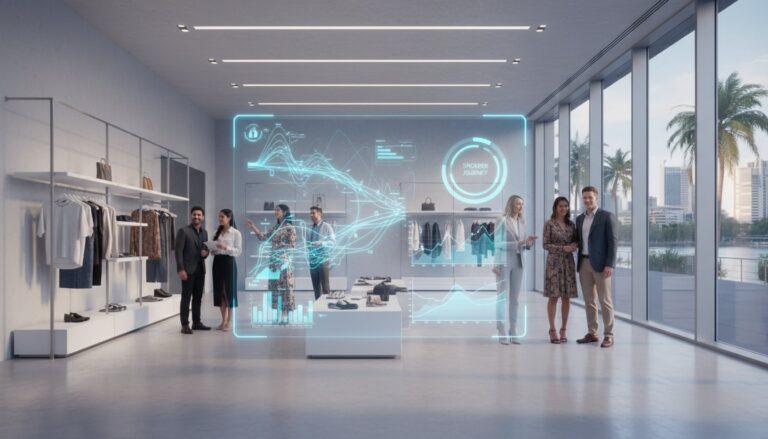
Raw data only gains value when it’s translated into a clear, actionable strategy. The FootfallCam V9 Software acts as your central engagement hub, consolidating complex movement patterns into intuitive, boardroom-ready reports. You can customize dashboards to focus on exhibit-specific KPIs, such as attraction rates, retention percentages, or average dwell time. These automated weekly reports empower curators and stakeholders to make evidence-based decisions without the burden of manual data processing. It’s a system designed to empower the user, providing the empirical foundation needed for measuring engagement in exhibition spaces with total confidence. By integrating these insights into your workflow, you transform the way your organization understands and serves its audience.
Transforming Movement into Strategic Curatorial Growth
The shift toward empirical evidence is no longer optional for organizations seeking to maximize their cultural and economic impact. By prioritizing high-precision metrics over static attendance figures, you gain the clarity needed to refine every aspect of your visitor journey. We’ve explored how measuring engagement in exhibition spaces through dwell time, flow analysis, and iterative curation creates a responsive environment that serves both the content and the audience. This objective approach ensures that every design decision is backed by data rather than intuition.
Implementing these systems requires a partner that understands the intersection of technology and human behavior. Footfall Australia has been trusted by major Australian institutions since 2004 to provide sophisticated analytical solutions. Our FootfallCam Pro2 hardware delivers 99.5% accuracy while maintaining full compliance with national privacy standards, ensuring your data remains secure and actionable. This level of reliability allows you to focus on storytelling while we handle the technical foundations of behavioral measurement.
Request a Tailored Exhibition Engagement Analysis from Footfall Australia to begin optimizing your space today. You’re now equipped to turn raw movement into a narrative of success.
Frequently Asked Questions
How do I measure visitor engagement without using intrusive surveys?
Utilizing AI-driven people counters allows you to capture objective data without interrupting the visitor experience. These systems observe movement patterns automatically, which eliminates the “observer effect” and recall bias common with manual clipboards. By measuring engagement in exhibition spaces through automated sensors, you capture natural behavior and long-term trends that surveys frequently miss.
Is it possible to track the specific path a visitor takes through an exhibition?
Yes, modern analytics tools provide granular path tracking by mapping the sequential journey of visitors through your space. You can visualize the “Golden Path” to see if visitors follow your intended narrative or identify “Exit Leaks” where people prematurely leave the exhibition. These insights allow for iterative curation to improve flow and ensure the layout aligns with your strategic goals.
How accurate are AI people counters in crowded exhibition spaces?
High-precision hardware like the FootfallCam Pro2 achieves 99.5% accuracy even in high-density environments. These sensors use 3D stereoscopic vision to distinguish between individuals in a crowd, effectively filtering out shadows and inanimate objects. This reliability provides the quiet confidence needed to justify ROI to stakeholders with empirical evidence rather than intuition or guesses.
Do people counters comply with Australian privacy laws for public spaces?
Modern systems comply with the Australian Privacy Act 1988 by processing movement as anonymous vectors rather than personal identifiers. They don’t record facial features or store sensitive data, which is essential given the 2026 reforms that broaden the definition of personal information. This ensures your organization meets national standards for data protection while gathering essential behavioral metrics.
Can I use existing CCTV cameras to measure exhibition engagement?
You can integrate existing CCTV infrastructure by using a solution like FootfallCam Centroid. This device connects to your IP cameras and applies AI processing to transform standard video feeds into engagement data. It’s a cost-effective way to implement measuring engagement in exhibition spaces without requiring a complete hardware overhaul in large-scale venues or heritage buildings.
What is the difference between dwell time and simple foot traffic?
Foot traffic is a simple entry count, while dwell time measures the specific duration of a visitor’s stay at a point of interest. Dwell time is a much stronger indicator of “Holding Power” and attraction. Distinguishing between someone walking through and someone studying an exhibit allows you to identify which specific content truly resonates with your audience.
How much does a professional people counting system cost for a temporary exhibition?
Costs vary depending on the scale of the exhibition and specific technical requirements, such as wide-angle coverage or wireless needs for heritage sites. While enterprise-grade AI implementations represent an initial investment, most organizations find that automated reporting and optimized staffing provide a clear path to long-term efficiency. You should consult with a specialist to determine the specific configuration for your budget.
Can I distinguish between staff and visitors in my engagement data?
Yes, advanced sensors use height filtering and staff exclusion tags to separate personnel from the general public. This ensures your engagement data isn’t skewed by staff members performing routine checks or security rounds. Filtering these movements provides a cleaner dataset that accurately reflects the genuine interest levels and behaviors of your paying visitors.