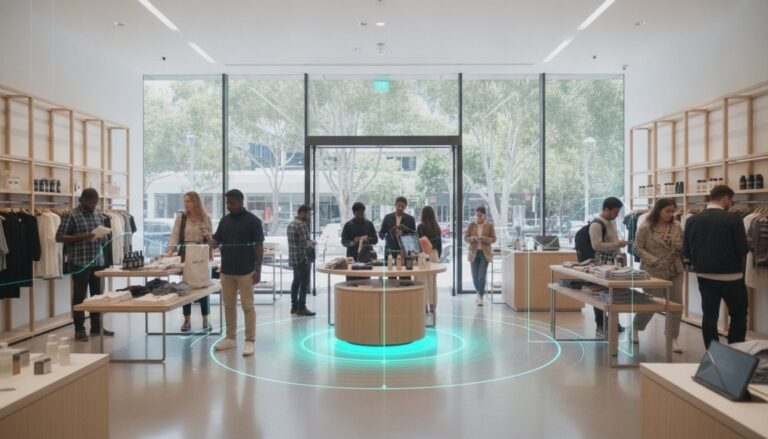
Proof of Performance for Retail Tenants: The 2026 Guide to Tenant Mix Optimisation
Why are you still paying rent based on a landlord’s “estimated” traffic when your own store’s pull power remains unverified? In an Australian market where regional centres are seeing investment returns project to 9% per annum, the pressure on occupancy costs is higher than ever. You likely feel the weight of justifying your position in the mix without having an independent way to audit the traffic numbers handed to you. Leveraging shopping centre footfall data for tenant mix optimisation is the only way to move past intuition and base your lease strategy on empirical evidence.
We recognize that proving your store’s “pull” power is difficult when you’re restricted to the landlord’s narrative. This guide will provide you with the framework to master the metrics and technology needed to gain a seat at the table with quiet confidence. We’ll preview how tools like the FootfallCam Pro2 and Centroid system allow you to capture precise movement patterns; this gives you the data-backed leverage required to lower costs and optimise your store placement. By the end of this article, you’ll have a clear path toward using sophisticated reporting to turn physical presence into a measurable strategic advantage.
Key Takeaways
- Shift from simple turnover reporting to holistic traffic analytics to define your store’s true value within the retail ecosystem.
- Leverage shopping centre footfall data for tenant mix optimisation to secure objective leverage during lease renewals and mid-term rent reviews.
- Quantify your store’s magnetism through capture rate metrics that prove your brand’s ability to attract and convert passing centre traffic.
- Implement high-accuracy hardware like the FootfallCam Pro2 to establish an independent, auditable data stream that bypasses landlord estimations.
- Integrate movement analytics with your existing software to automate reporting and demonstrate the direct impact of your location on the centre’s performance.
Defining Proof of Performance in the 2026 Australian Retail Landscape
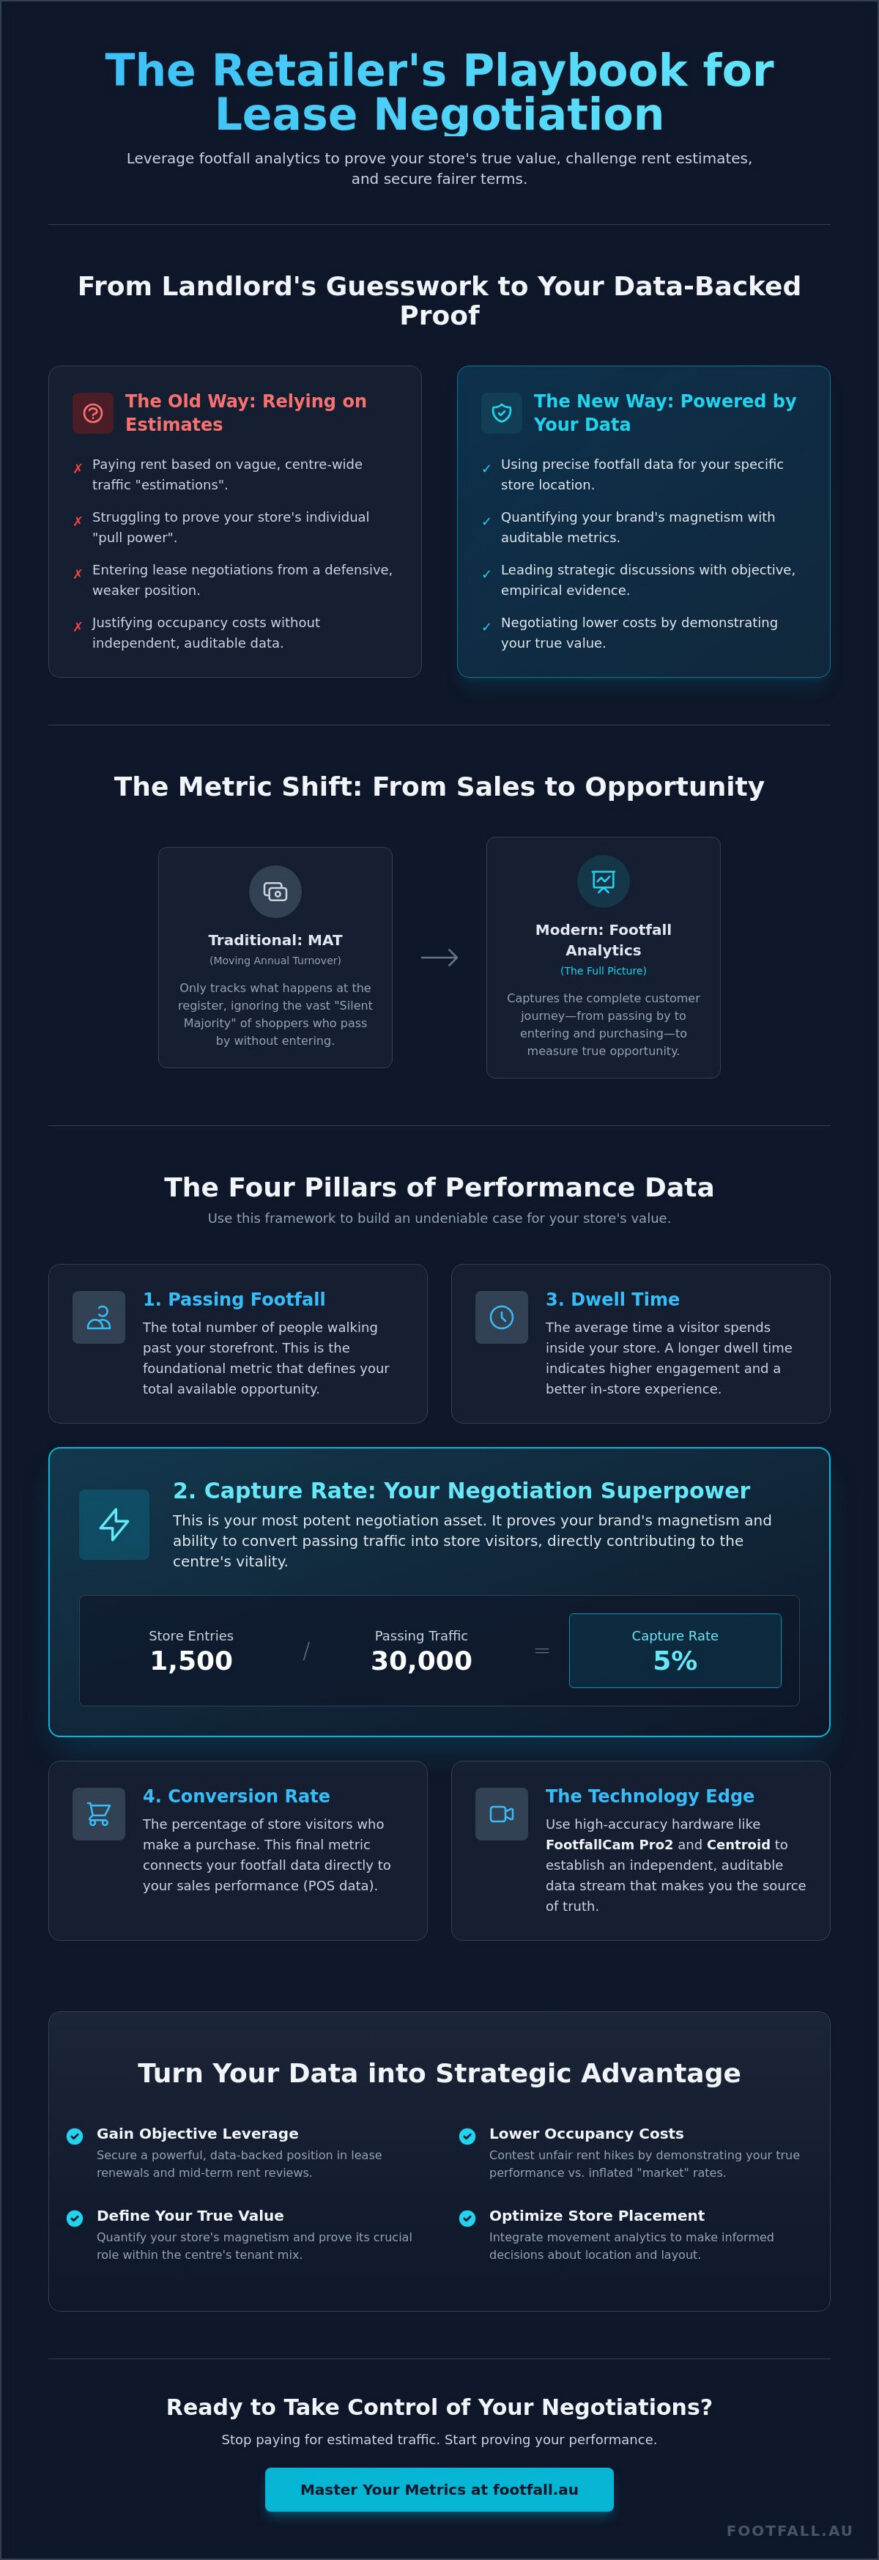
The Australian retail market has undergone a fundamental transformation. Traditional metrics like Moving Annual Turnover (MAT) are no longer sufficient to describe the true health of a shopping center environment. While MAT tracks what occurs at the register, it fails to explain the human behavior that precedes the sale. Modern tenants are now prioritising shopping centre footfall data for tenant mix optimisation to prove their value beyond the final transaction. This shift is driven by a need to verify the actual volume of opportunity available within specific mall zones rather than relying on centre-wide averages.
Landlords, institutional investors, and banks increasingly demand objective proof of store performance to justify valuations and debt coverage. In Australia, where occupancy cost ratios have historically fluctuated, having auditable data is a defensive necessity. The Retail Leases Act across various states provides a framework for fair dealing; however, it does not provide the empirical data needed to contest a rent hike. You must bring your own evidence to the table. Accurate traffic counts allow you to demonstrate the exact “pull” your brand exerts on a precinct, ensuring you aren’t overpaying for prestige that doesn’t translate into store visits.
The Shift from Compliance to Commercial Leverage
Independent retailers often feel at a disadvantage when negotiating against major Real Estate Investment Trusts (REITs). Data bridges this gap. By presenting zone-specific traffic counts, you can challenge “market rent” assumptions that might be based on outdated or inflated centre-wide figures. Proof of Performance is the objective verification of a tenant’s impact on a retail environment. This metric allows you to demonstrate exactly how much foot traffic you generate for your neighbours. It turns a defensive negotiation into a strategic discussion about your store’s role as an anchor within the local mix.
Why 2026 Retail Demands More Than Just POS Data
Relying solely on Point-of-Sale (POS) figures creates a significant blind spot. It ignores the “missed opportunity” of shoppers who walked past your door without entering. These individuals represent the “Silent Majority.” They might engage with your window display or experience your brand without completing a purchase, yet they still contribute to the centre’s overall vibrancy and your brand’s physical reach. Integrating retail footfall analysis Australia into your monthly reporting ensures you capture this full narrative. It transforms a simple sales report into a strategic document. This level of insight helps you identify whether a sales dip is due to poor conversion or a genuine drop in centre-managed traffic flow.
The Essential Metrics for Shopping Centre Footfall Data for Tenant Mix Optimisation
Strategic decision-making relies on a granular understanding of visitor movement. Landlords usually provide aggregate centre figures, but these broad numbers don’t reflect the specific micro-climate outside your store front. Using shopping centre footfall data for tenant mix optimisation lets you isolate the actual opportunity in your immediate corridor. Establishing this baseline is the first step toward measuring whether your location is a high-traffic thoroughfare or a quiet corner. It moves the conversation from “estimated” visibility to verified exposure.
Effective data collection for tenant mix goes beyond simple counting. It involves analyzing the relationship between four key pillars: footfall, capture rate, dwell time, and conversion. These metrics allow you to interpret human actions as a sequence of strategic events. When you understand the flow of people as a series of deliberate choices, you can better align your store operations with the reality of the physical environment.
Capture Rate: Proving Your “Pull” in the Tenant Mix
Your capture rate is your most potent negotiation asset. Calculated as (Store Entries / Passing Traffic) x 100, it defines your brand’s magnetism. If your capture rate consistently exceeds the category average, you’re operating as a “mini-major” or anchor specialty store. This status is critical when centre-wide traffic drops. If your store remains a destination while general mall traffic declines, you have empirical proof that your brand is sustaining the precinct. This level of insight ensures you aren’t unfairly penalised for broader centre mismanagement.
Occupancy Cost Ratio (OCR) and Data-Driven Rent
Australian retailers use the Occupancy Cost Ratio (OCR) to assess lease sustainability. This represents your total rent and outgoings as a percentage of gross sales. In 2026, you should use footfall trends to justify OCR adjustments during centre renovations or layout changes that affect visitor flow. High footfall with low conversion identifies operational issues rather than location-based ones. Distinguishing between these factors prevents you from blaming a good location for poor internal performance. If you need to establish these benchmarks, consider how automated reporting tools can simplify your evidence collection.
Leveraging Performance Data in Lease Negotiations and Renewals
Entering a rent review without independent metrics is a strategic risk that often leads to unfavorable outcomes. Using shopping centre footfall data for tenant mix optimisation transforms a stressful renewal into a structured commercial exchange. It allows you to present a Data-Backed Counter-Offer that moves beyond the landlord’s anecdotal evidence of “increased centre activity.” When you have a clear record of the traffic specifically passing your lease line, you can negotiate from a position of quiet confidence rather than intuition.
Countering Arbitrary Rent Increases
Presenting a 12-month traffic trend report to a leasing manager is the most effective way to debunk claims of estimated growth. If the centre’s general traffic has risen but your specific zone has stagnated due to changing tenant placements, your data proves it. You can use footfall data analysis to identify “dead zones” within the centre. This evidence is crucial for justifying lower rents or resisting increases that don’t align with the actual opportunity provided by the location. Comparing your store’s high capture rate against broader centre averages also reinforces your brand’s value as a destination that the landlord cannot afford to lose.
Beyond base rent, traffic data provides leverage for securing fit-out contributions and challenging Common Area Maintenance (CAM) charges. If you can prove your store acts as a major drawcard for a quiet wing, you’re in a stronger position to request capital for store upgrades. Similarly, you can argue that CAM charges should reflect actual traffic usage patterns rather than a simple square-metre calculation. This ensures your occupancy costs remain proportionate to the commercial utility you receive from the space.
Holding Landlords Accountable for Promised Traffic
Verification is essential when a landlord makes structural changes to the centre layout. If a major anchor is relocated or an entrance flow is altered, the impact on your store’s visibility can be immediate and severe. By using people counting systems Australia, you can document the exact percentage drop in passing traffic following these changes. This creates a factual basis for a “Landlord Performance” argument, which is often the only way to trigger a mid-term rent review or seek compensation for diminished trade.
Consider the logic of a proportionate rent reduction. If your data shows a consistent 15% decrease in the opportunity audience because of centre-wide management decisions, your rent should reflect that new reality. This level of accountability forces a more collaborative relationship between tenant and landlord. It ensures that both parties are working toward an optimised mix where decisions are backed by empirical evidence of human movement rather than speculative projections.
Implementing a Robust Proof of Performance Framework
Establishing a reliable framework requires more than just mounting a sensor. It demands a systematic approach to data collection that can withstand the scrutiny of a legal dispute or a board-level audit. To achieve shopping centre footfall data for tenant mix optimisation that carries weight, you must follow a structured implementation path. Start by installing high-accuracy AI-driven counters like the FootfallCam Pro2 at all store thresholds. These devices distinguish between shoppers and mall staff, providing the granular detail necessary for objective reporting.
Once the hardware is in place, integrate the stream with your Point of Sale (POS) system using FootfallCam V9 Software. This allows for automated correlation between traffic and transactions. We recommend establishing a 90-day baseline to account for Australian seasonal variations, such as the 28% traffic increase typically seen during school holidays. This baseline ensures your performance metrics aren’t skewed by temporary market shifts. Finally, automate your weekly dashboards and conduct regular audits to maintain 98% data integrity, ensuring your evidence remains beyond reproach.
Ensuring Data Integrity and Accuracy
Data only provides leverage if it’s accurate. In a lease dispute, landlords will often challenge “estimated” or “sampled” data. To be considered legal-grade, your system must maintain a verified accuracy of 98% or higher. Professional retail metrics require sophisticated staff exclusion and child filtering to ensure your capture rates reflect genuine commercial opportunity. It’s also vital that your collection methods are fully privacy-compliant, adhering to both the Australian Privacy Principles (APP) and international GDPR standards. This commitment to accuracy and ethics transforms your data from a simple internal metric into a powerful external asset.
Visualising Performance for the Boardroom
Raw data is rarely enough to influence a board or a leasing manager. You need to create dashboards that tell a clear story of either sustained growth or the need for strategic intervention. Automated reporting ensures you maintain constant lease leverage without the need for manual data entry. By linking your local store metrics to broader people counting technology, you gain the market context required to prove your store’s performance relative to wider Australian retail trends. This visibility empowers stakeholders to make decisions based on empirical human behavior rather than intuition.
If you’re ready to secure your retail position with auditable evidence, explore our range of high-accuracy people counters to begin building your proof of performance framework today.
Strategic Advantage with Footfall Australia Solutions
Establishing a strategic advantage in the 2026 retail market requires more than just high-level insights. It demands hardware that landlords and institutional investors respect. Using shopping centre footfall data for tenant mix optimisation is only effective if the underlying technology is beyond reproach. Footfall Australia provides the infrastructure required to turn raw traffic numbers into a persuasive narrative for lease renewals, ensuring your commercial interests are protected by empirical evidence rather than landlord estimations.
The transition from raw data to actionable leverage happens through seamless integration. Our systems connect directly with your existing retail ecosystems, providing an immediate return on investment by automating the reporting process. This ensures your “proof of performance” is always ready for a mid-term review or a board-level presentation. With national support and maintenance plans, we ensure your data stream remains consistent and auditable across your entire Australian portfolio.
The FootfallCam Pro2: Your Silent Negotiator
The FootfallCam Pro2 serves as a silent negotiator in every lease discussion. It utilizes AI-based counting and 3D stereoscopic vision to deliver 98% accuracy, even in high-density environments. Its ability to perform reliable staff exclusion is a critical feature for national retail chains in Australia, as it ensures capture rates aren’t artificially deflated by employee movements. You can learn more about the FootfallCam Pro2 and its technical specifications to see why it remains the preferred choice for sophisticated retail analytics.
Securing Your Retail Future
Moving from “guessing” to “knowing” your store’s true value changes the power dynamic in any shopping centre. You no longer have to accept arbitrary rent hikes when you can prove your store’s magnetism with hard numbers. For retailers managing multiple locations, we offer comprehensive implementation strategies that ensure data integrity across all your Australian locations. This unified approach allows you to compare performance across different centre types and demographic catchments with quiet confidence.
If you’re ready to master your retail metrics, we can help you transition to a data-driven model. You can request a site survey for a national rollout to begin quantifying your impact on the centre mix. Our team provides dedicated people counter support to ensure your systems remain calibrated and your reporting stays automated. Secure your position in the 2026 retail landscape by making movement measurable and performance provable.
Securing Your Commercial Leverage in the 2026 Retail Market
Mastering the metrics of human movement is the most effective way to protect your retail footprint against arbitrary market shifts. You’ve seen how shifting from simple turnover to comprehensive traffic analytics provides a level of transparency that traditional reporting lacks. By implementing a framework centered on shopping centre footfall data for tenant mix optimisation, you move from a defensive stance to one of strategic authority. This shift ensures your occupancy costs remain aligned with the actual commercial opportunity provided by your location.
Relying on empirical evidence allows you to negotiate lease terms with quiet confidence. With over 20 years of Australian retail expertise, we provide the tools required to verify your store’s magnetism and hold landlords accountable. Our national partner network ensures seamless installation and support across all states, delivering a guaranteed 98% counting accuracy for your peace of mind. It’s time to let auditable data define your brand’s value within the centre mix.
Empower your lease negotiations with FootfallCam Pro2 data today
Take the lead in your next rent review by bringing verified insights to the table. Your store’s future deserves the stability of evidence-based success.
Frequently Asked Questions
What is the most important metric for a retail tenant to track in 2026?
The capture rate remains the most critical metric for retail tenants. It measures the percentage of passing mall traffic that enters your store, effectively proving your brand’s magnetism. While sales data shows what you’ve earned, your capture rate quantifies the opportunity you’ve successfully converted. This metric is essential for justifying your store’s value within the broader retail ecosystem.
Will a landlord actually accept third-party footfall data in a negotiation?
Landlords typically accept third-party data if it meets auditable, high-accuracy standards. Most major Australian REITs recognize that independent, AI-driven reporting provides a more granular view of specific mall zones than their own general centre-wide sensors. Presenting a 98% accuracy certificate alongside your shopping centre footfall data for tenant mix optimisation creates a factual basis that is difficult to dismiss during lease negotiations.
How does people counting differ from simple CCTV monitoring for retail?
People counting utilizes specialized 3D stereoscopic sensors designed specifically for depth perception and movement analysis. Unlike standard CCTV, which is used for security and loss prevention, AI-driven counters like the FootfallCam Pro2 provide anonymous, non-identifiable data. These systems filter out non-human objects, children, and staff members to ensure the final report reflects genuine commercial traffic rather than simple visual records.
Is it legal to track customer movement in Australian shopping centres?
Tracking customer movement is legal in Australia as long as the methodology complies with the Privacy Act 1988 and the Australian Privacy Principles (APP). Modern systems ensure compliance by processing data on the device itself and only transmitting numerical statistics. They don’t record identifiable facial features or personal information. This “privacy by design” approach allows retailers to gather vital insights without infringing on individual rights.
What is considered a “good” capture rate for a specialty retail store?
A “good” capture rate typically ranges between 8% and 15% for specialty retailers in Australian centres. This figure varies significantly depending on your category and store location. For example, a high-frequency service tenant might see higher rates, while a luxury boutique may operate successfully with a lower, more targeted percentage. The goal is to establish a personal baseline and strive for consistent growth against your specific zone’s traffic.
How much does a professional people counting system cost to implement nationally?
The cost of a national implementation depends on the scale of your portfolio and the specific technical requirements of each site. You should evaluate the total cost of ownership by considering hardware durability, software integration, and ongoing support plans. While we don’t quote fixed prices due to the customized nature of retail rollouts, a professional system is an investment in long-term lease leverage and operational efficiency.
Can I use people counting data to reduce my staffing costs during quiet periods?
You can certainly use movement data to optimize labor allocation and reduce unnecessary staffing costs. By identifying consistent peaks and troughs in visitor flow, you can align your rosters with actual demand rather than relying on gut feeling. This ensures your highest-performing staff are on the floor during busy periods; this directly improves your sales conversion rate and overall store profitability.
What happens if the landlord’s traffic data contradicts my own store data?
If your data contradicts the landlord’s figures, you should present your auditable accuracy report as the primary evidence. Landlord data is often based on centre-wide averages or older infrared sensors that lack the precision of modern AI counters. Providing zone-specific shopping centre footfall data for tenant mix optimisation allows you to pinpoint discrepancies. This evidence is vital for contesting rent hikes based on “estimated” centre growth that hasn’t reached your specific lease line.